
A massively parallel 3′ UTR reporter assay reveals relationships between nucleotide content, sequence conservation, and mRNA destabilization
- Adam J. Litterman1,
- Robin Kageyama1,
- Olivier Le Tonqueze2,
- Wenxue Zhao2,3,
- John D. Gagnon1,
- Hani Goodarzi4,
- David J. Erle2 and
- K. Mark Ansel1
- 1Department of Microbiology and Immunology and Sandler Asthma Basic Research Center, University of California San Francisco, San Francisco, California 94143, USA;
- 2Department of Medicine and Lung Biology Center, University of California San Francisco, San Francisco, California 94143, USA;
- 3School of Medicine, Sun Yat-Sen University, Guangzhou, People's Republic of China, 510245;
- 4Department of Biochemistry and Biophysics, Department of Urology, and Helen Diller Family Comprehensive Cancer Center, University of California San Francisco, San Francisco, California 94143, USA
Abstract
Compared to coding sequences, untranslated regions of the transcriptome are not well conserved, and functional annotation of these sequences is challenging. Global relationships between nucleotide composition of 3′ UTR sequences and their sequence conservation have been appreciated since mammalian genomes were first sequenced, but the functional relevance of these patterns remain unknown. We systematically measured the effect on gene expression of the sequences of more than 25,000 RNA-binding protein (RBP) binding sites in primary mouse T cells using a massively parallel reporter assay. GC-rich sequences were destabilizing of reporter mRNAs and come from more rapidly evolving regions of the genome. These sequences were more likely to be folded in vivo and contain a number of structural motifs that reduced accumulation of a heterologous reporter protein. Comparison of full-length 3′ UTR sequences across vertebrate phylogeny revealed that strictly conserved 3′ UTRs were GC-poor and enriched in genes associated with organismal development. In contrast, rapidly evolving 3′ UTRs tended to be GC-rich and derived from genes involved in metabolism and immune responses. Cell-essential genes had lower GC content in their 3′ UTRs, suggesting a connection between unstructured mRNA noncoding sequences and optimal protein production. By reducing gene expression, GC-rich RBP-occupied sequences act as a rapidly evolving substrate for gene regulatory interactions.
Noncoding sequences in 3′ UTRs control post-transcriptional gene regulation through their interactions with RNA-binding proteins (RBPs). Some RBP binding sites are deeply conserved, and 3′ UTRs as a whole are more conserved than other noncoding sequences in vertebrate genomes (Siepel et al. 2005), suggesting the presence of selective pressure that drives conservation of functional sequences. However, 3′ UTR sequence conservation varies widely between genes and within different regions of the same gene. Phylogenetic analyses have suggested that conservation and nucleotide composition are related, with AU-rich 3′ UTRs exhibiting greater conservation than GC-rich 3′ UTRs (Duret et al. 1993; Shabalina et al. 2003). The reason for this association remains unclear, as only a small fraction of UTR sequence space has been functionally annotated and information about RBP occupancy is largely limited to interrogation by biochemical purification of individual RBPs (Yang et al. 2015).
Previous work annotating the functional activity of 3′ UTRs with massively parallel reporter assays has focused on known cis-regulatory elements defined by known binding sites of microRNAs and RNA binding proteins (Zhao et al. 2014; Slutskin et al. 2018). Although these studies are useful for elucidating modes of regulation of known trans-acting factors, they have not addressed the relationship between global patterns of UTR conservation, nucleotide content, and functional activity. GC-rich, structured RNA motifs have been previously identified as contributing to rapid turnover of mRNAs in a human cell line (Goodarzi et al. 2012). Additionally, a recent in vivo massively parallel reporter assay in zebrafish embryos identified GC-rich elements as having strong destabilizing activity (Rabani et al. 2017).
We recently developed a methodology to identify global RBP occupancy profiles in the transcriptome of primary mouse T cells. This technique yielded a map of tens of thousands of RBP-bound sites derived from ubiquitously expressed genes as well as tightly regulated, immune cell–specific transcripts. Here, we systematically explored the relationships between post-transcriptional functional activity, sequence content, structure, and the evolutionary context of these sequences by generating a functional annotation of 3′ UTRs (fast-UTR) massively parallel reporter assay library (Zhao et al. 2014) containing more than 25,000 of these RBP binding sites and thousands of controls chosen on the basis of sequence conservation.
Results
Relationship between evolutionary conservation, nucleotide composition, and heterologous reporter activity
Using our GCLiPP technique for global identification of putative cis-regulatory elements in the transcriptome (Litterman et al. 2018), we identified approximately 27,000 protein occupied sites (“peaks” of GCLiPP read density) in the 3′ UTRs of mRNAs expressed in primary mouse T cells. We synthesized a massively parallel reporter library based on the fast-UTR system (Zhao et al. 2014) in a murine stem cell virus retroviral vector and transduced this library into in vitro differentiated mouse Th2 cells and CD8 T cells. We harvested transduced cells, prepared RNA and DNA, and inferred the effect of each insert on mRNA abundance from the relative ratios of sequenced amplicons from reverse transcribed RNA and genomic DNA templates (Fig. 1A; Supplemental Table 1).
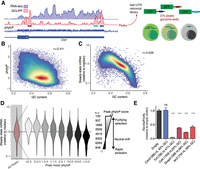
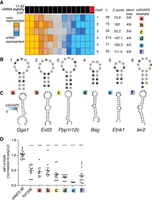
GC-rich 3′ UTR sequences are rapidly evolving and destabilize reporter mRNAs. (A) Schematic diagram of fast-UTR assay. Approximately 27,000 70-nt sequences corresponding to RBP-occupied regions of mouse T cell 3′ UTRs were synthesized and cloned into the 3′ UTR of a murine stem cell virus based GFP reporter. The library was transduced into primary T cells, library inserts amplified from cDNA, and genomic DNA, and gene expression quantified for each insert by calculating a median normalized RNA/DNA ratio. (B) Relationship between GC content and conservation for RBP-occupied sequences. (r) Pearson correlation coefficient. (C) Relationship between GC content and steady-state mRNA abundance in fast-UTR reporter assay for RBP-occupied sequences. (D) Steady-state mRNA abundance in fast-UTR of RBP-occupied sequences, binned on placental mammal conservation. (E) Dual-luciferase assay showing Renilla luciferase activity relative to Firefly luciferase activity, in Th2 cells transfected with plasmid with indicated 3′ UTR downstream from Renilla luciferase gene and control Firefly luciferase gene. A representative experiment using Th2 cell cultures from four mice is shown. Mean and standard error of the mean are indicated by bar graph and error bars, respectively. (***) P < 0.0001 in unpaired t-test relative to empty vector.
Consistent with the poor conservation of GC-rich sequences within 3′ UTRs (Shabalina et al. 2003), GC content in GCLiPP peaks negatively correlated with evolutionary conservation among placental mammals (ρ = −0.411, P ≈ 0) (Fig. 1B). A consistent pattern in the data set was the strong negative correlation between insert GC content and fast-UTR mRNA stability (ρ = −0.658, P ≈ 0) (Fig. 1C). We observed this pattern in all four experimental conditions and saw a strong correlation between all samples except for one outlier (Supplemental Fig. S1). For the resting Th2 cell sample, we inspected inserts containing seed binding sequences for highly expressed miRNAs and found that, as expected, they were destabilizing compared with inserts containing scrambled variants of the same seed sequence (Supplemental Fig. S2). Further analysis focused on this robust data set.
We observed strong anti-correlations between GC content and reporter mRNA abundance for several unrelated classes of sequences: approximately 27,000 mouse 3′ UTR-derived sequences that were bound by RBPs (GCLiPP peaks), approximately 5000 highly conserved regions of mouse 3′ UTRs that were not bound by RBPs, approximately 5000 regions of mouse 3′ UTRs that were selected without regard to their conservation, approximately 3000 randomly generated sequences with all dinucleotides except for CpG represented equally, approximately 2000 randomly generated sequences with dinucleotide frequencies matching mouse 3′ UTRs, and approximately 2000 randomly generated sequences with dinucleotide frequencies matching the mouse genome (Supplemental Fig. S3). There was a corresponding positive correlation between fast-UTR mRNA stability and evolutionary conservation (ρ = 0.260, P ≈ 0), with stepwise decreases in stability observed for inserts binned from the most strictly conserved (largest phyloP) to the most rapidly evolving (phylo P < 0) sequences (Fig. 1D).
Validation of the relationship between 3′ UTR GC content and effect on gene expression
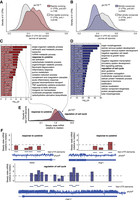
The association between nucleotide composition and effect on gene expression observed for isolated GCLiPP peaks holds for longer sequences. GC-rich full-length 3′ UTRs (Cd4, Dusp2, Ier2) reduced reporter luciferase activity (with the known decay elements in the Tnf 3′ UTR functioning as a positive control), whereas a GC-poor 3′ UTR of similar length (Cnn3) had no effect (Fig. 1E). Protein production was similarly affected in previous experiments with a lentiviral fast-UTR library of 160-nt human 3′ UTR segments downstream from EGFP (Zhao et al. 2014). We reanalyzed this published data set of samples sorted for high and low EGFP fluorescence and found that 3′ UTR inserts enriched in FACS-sorted BEAS-2B cells with low EGFP fluorescence had significantly higher GC content than inserts enriched in cells with high EGFP fluorescence (P < 10−28, Welch's two-sample t-test) (Fig. 2A). Inserts that resulted in low protein production exhibited concordantly lower reporter mRNA half-life in BEAS-2B cells (Fig. 2B) and had lower steady-state mRNA abundance in three other human cell lines (Fig. 2C). In all of these prior experiments, 3′ UTR GC content strongly correlated with reduced reporter gene expression (Fig. 2D–G). Therefore, we conclude that the relationship between 3′ UTR GC content and gene expression that we observed in primary mouse T cells using biochemically defined minimal RBP binding sites is reproducible and extensible to other contexts. The robustness of this conclusion is supported by multiple concordant measurements of gene expression (low steady-state mRNA, low mRNA half-life, and low protein abundance). The concordance observed between multiple different cell types and lengths of sequence, as well as similar observations by others in completely different experimental systems from fish (Rabani et al. 2017) to bacteria (Goodman et al. 2013) suggest that this is a generalizable principle of post-transcriptional gene regulation.
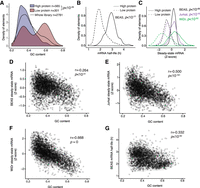
Inverse relationship of 3′ UTR GC content and gene expression is reproducible across several experimental modalities and cell types. (A) GC content of 3′ UTR inserts of fast-UTR library transduced BEAS-2B cells FACS-sorted for high or low GFP fluorescence. (B) mRNA half-life of inserts of high or low protein expressing 3′ UTR inserts from A in BEAS-2B cells. (C) Steady-state mRNA abundance of inserts of high or low protein expressing 3′ UTR inserts from A in three human cell lines. For A–C, P-values represent Welch's unequal variance t-test between high and low protein expressing inserts. (D–G) Correlation between 3′ UTR insert GC content and steady-state mRNA abundance (D–F) or mRNA half-life (G) for fast-UTR assays in indicated cell lines. (r) Pearson correlation coefficient, P-value tests null hypothesis that correlation is equal to 0.
Rapidly evolving peaks with discrepant GC content between mouse and human have different regulatory effects
To understand the effects on regulatory activity of rapid, lineage-specific evolution, we included in our library 1172 sequences derived from the human genome at sequences homologous to rapidly evolving (average phyloP across sequence <0) RBP binding sites from the mouse genome. We generated matched fast-UTR steady-state mRNA measurements for 1163 of these homologous regions and compared their regulatory activity. Matched sets of human and mouse 3′ UTR sequences varied greatly in the concordance of their GC content. We found examples in which the GC content in the human homologous sequence was markedly higher than, similar to, or lower than the mouse sequence, and we noted marked differences in regulatory activity for the discordant sequences (Fig. 3A). Across rapidly evolving sequences there was only a modest correlation between the mouse and homologous human sequences in their effect on steady-state mRNA abundance (ρ = 0.188, P < 10−9) (Fig. 3B). However, the difference in destabilizing activity between mouse and human sequences was strongly related to the difference in GC content (ρ = −0.408, P < 10−43) (see individual examples in Fig. 3A,C). These data indicate that acquisition of GC-rich sequences within protein-bound regions of 3′ UTRs confers destabilizing functional activity.
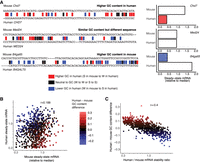
Changes in GC content between rapidly evolving mouse and human 3′ UTR sequences determine mRNA stability in fast-UTR reporter assay. (A) Example alignments (left) of rapidly evolving mouse GCLiPP peaks and human syntenic regions showing higher (Chd7), similar (Med24), or lower (B4galt5) GC content in the mouse sequence, with individual sequence fast-UTR measurements shown to the right. Correlation between steady-state mRNA abundance for rapidly evolving mouse GCLiPP peaks and corresponding human syntenic regions in mouse T cell fast-UTR assay (B) and difference in GC content between rapidly evolving mouse GCLiPP peaks and syntenic human regions (C) and ratio of fast-UTR steady-state mRNA abundance for the same. (r) Pearson correlation coefficient.
In vivo RNA secondary structures are rapidly evolving and destabilize reporter mRNAs
RNA folding influences global patterns of RBP occupancy and functional activity. High GC content thermodynamically favors RNA folding, and it was also strongly associated with low steady-state mRNA abundance in fast-UTR reporter systems. Therefore, we hypothesized that prominent RNA secondary structure may be globally associated with mRNA destabilizing activity. To examine in vivo RNA structure of the mouse 3′ UTR sequences in our library, we examined icSHAPE sequencing data from mouse embryonic stem cells (Spitale et al. 2015). icSHAPE biochemically tags flexible (non-base-paired) RNA residues and identifies them by sequencing with nucleotide resolution, so highly structured elements show icSHAPE profiles in which maximally tagged and nontagged nucleotides are directly apposed. Therefore, we examined the Gini coefficient of icSHAPE tag density (Spitale et al. 2015) for elements in our library that also occurred in the icSHAPE data set. We stratified our library elements by Gini coefficient of icSHAPE tag density to identify highly structured (top quintile) and relatively unstructured (bottom quintile) elements (Fig. 4A). RNAfold predictions for top quintile elements supported the expectation that elements with high icSHAPE Gini coefficient would adopt highly structured conformations with low folding energies and many base-paired nucleotides. Fast-UTR reporter steady-state mRNA abundance was significantly lower for highly structured top quintile elements compared with bottom quintile elements (P < 10−99) (Fig. 4B), consistent with a general association between secondary structure and mRNA destabilizing activity.
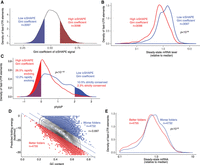
In vivo–folded structures are enriched for gene regulatory activity and are rapidly evolving. (A) RBP-occupied sequences in fast-UTR library with corresponding icSHAPE data were stratified quintiles of icSHAPE Gini coefficient. Strongly structured sequences (red, top quintile icSHAPE Gini coefficient) or nonstructured sequences (blue, bottom quintile icSHAPE Gini coefficient) were identified. (B) Steady-state mRNA abundance in fast-UTR assay for sequences of classes depicted in A. P-value from Welch's two-sample t-test. (C) Sequence conservation across placental mammals for sequences of classes depicted in A. P-value from Welch's two-sample t-test. Shading depicts fraction of sequences in each class (structured or nonstructured) corresponding to rapid evolution (mean phylo P < 0) or strict conservation (mean phylo P > 2). (D) Correlation between GC content and predicted folding energy for RBP-occupied sequences included in fast-UTR library. Plot shows linear regression and top/bottom outliers (∼15% of data points furthest from regression line). (r) Pearson correlation coefficient. (E) Steady-state mRNA abundance in mouse T cell fast-UTR assay for outliers of folding that are better or worse than regression. P-value represents Welch's unequal variance t-test.
Highly structured elements in the top quintile of icSHAPE Gini coefficient exhibited significantly less interspecies sequence conservation compared with the relatively unstructured bottom quintile elements (P < 10−132) (Fig. 4C, cf. red and blue histograms). Only 2.3% of highly structured elements were strictly conserved (phylo P > 2) compared to 10.5% of relatively unstructured elements, whereas 26.5% were rapidly evolving (phylo P < 0) compared to 12.2% of relatively unstructured elements (Fig. 4C, cf. shaded areas of each histogram). These data suggest that rapidly evolving sequence elements are more likely to be highly structured in vivo and conversely, that highly conserved 3′ UTR sequences are much less likely to be highly structured in vivo. Finally, we examined whether RNA secondary structures had predictive power for regulatory activity in our massively parallel reporter assay independent of GC content. We ran a linear regression of predicted folding energy versus GC content and identified sequences that were predicted to be “better” (above trend) or “worse” (below trend) folders than would be predicted from their GC content alone (Fig. 4D). Although the better and worse folders had similar GC content, the better folders had significantly lower steady-state mRNA abundance in fast-UTR (Fig. 4E).
We identified enriched short structural motifs associated with fast-UTR destabilizing activity using TEISER (Fig. 5A,B; Goodarzi et al. 2012). icSHAPE profiles were concordant with the predicted structure for most individual examples of these motifs. Maximal or near maximal icSHAPE tagging occurred at the predicted bulge, loop, or linear nucleotides, and minimal tagging was observed at predicted folded nucleotides (Fig. 5C). We confirmed the inhibitory effect of these motifs in T cells transfected with in vitro–transcribed reporter mRNAs linked to short 3′ UTRs containing the exemplary in vivo–folded sequences (Fig. 5D). Thus, our massively parallel 3′ UTR reporter assay revealed specific structural motifs associated with gene regulation and a global relationship between 3′ UTR structure and mRNA stability.
TEISER identifies in vivo–folded 3′ UTR structural motifs that inhibit gene expression. (A) TEISER analysis identifies structural motifs enriched in destabilizing sequences. Columns show enrichment of motifs in deciles of GCLiPP peaks arranged by fast-UTR steady-state mRNA abundance; rows represent individual motifs. Generic motif structures (B) and a predicted structure (C) for an example of each motif is depicted with icSHAPE signal indicated by color. (D) TEISER identified motifs’ lower gene expression. Kikume fluorescent protein synthesis in primary mouse T cells transfected with in vitro–transcribed mRNAs with the indicated sequence inserted downstream from the stop codon. Data represent transfections of a single construct into the T cells from a single mouse pooled from 1–4 experiments using three mice each, with mean and standard error of the mean indicated by line and error bars, respectively. (***) P < 0.0001 in unpaired t-test relative to poly(U).
Selective pressures shape 3′ UTRs differently in distinct classes of genes
Because of the relationships we observed between nucleotide composition and regulatory activity in 3′ UTRs, we sought to extend our observations to understand how nucleotide composition varies in 3′ UTRs throughout vertebrate evolution and within mammalian genomes. As such, we investigated whether GC content and deep phylogenetic conservation as measured by phyloP are intrinsically related in regulatory elements genome-wide, or whether this pattern is restricted to the transcriptome. GC content and phyloP scores were strongly negatively correlated for RBP-occupied sites in 3′ UTRs (Supplemental Fig. S4A), but not for a control set of EP300-bound (Vahedi et al. 2012) transcriptional enhancers (Supplemental Fig. S4B). The total amount of rapidly evolving sequence, as measured by the absolute value of the sum of nucleotides with phylo P < 0 also strongly correlated with GC content in 3′ UTRs (Supplemental Fig. S4C). This pattern was observed, but to a lesser extent, for enhancers (Supplemental Fig. S4D). This observation is potentially caused by GC-biased gene conversion, which can mimic positive selection for advantageous novel alleles (Ratnakumar et al. 2010; Capra et al. 2013).
We examined the relationship between GC content and interspecies conservation for full-length 3′ UTRs. We aligned 3′ UTRs from nine vertebrate species with well-annotated genomes and scored the alignment for all genes with at least four species in which a single canonical 3′ UTR could be unambiguously assigned. Overall, rapidly evolving 3′ UTRs have significantly higher mean GC content across the species we examined (Fig. 6A; Supplemental Table 2). Conversely, 3′ UTRs that exhibit strict conservation have lower GC content than other 3′ UTRs (Fig. 6B). When coding sequences of genes with strictly conserved 3′ UTRs are examined, the 3′ UTRs are more conserved relative to their coding sequence than for all other genes (Supplemental Fig. S5). Thus, across the vertebrate lineage, 3′ UTRs that face different regimes of selection systematically vary in nucleotide composition, with evidence of purifying selection associated with GC-poor UTRs and lineage-specific, accelerated evolution associated with GC-rich UTRs.
Genes with strictly conserved, AT-rich 3′ UTRs and rapidly evolving, GC-rich 3′ UTRs represent different biological categories. (A) Mean GC content of 3′ UTRs across nine vertebrate species among genes that were found to be rapidly evolving in a multiple sequence alignment versus other genes; (B) the same data as A comparing genes that were strictly conserved in a multiple sequence alignment versus other genes. P-values represent Welch's unequal variance t-test between genes that exhibit strong evidence of conservation/rapid evolution and those that do not. Enriched Gene Ontology categories for genes with rapidly evolving 3′ UTRs (C) or strictly conserved 3′ UTRs (D). P-values are for enrichment of the indicated GO category computed by Metascape. (E) Steady-state mRNA of fast-UTR reporters derived from genes enriched in “response to cytokine” or “regulation of cell cycle” categories with rapidly evolving or strictly conserved 3′ UTRs, respectively. P-value represents Welch's two-sample t-test. (F) Steady-state mRNA of fast-UTR reporters for indicated RBP-occupied regions (labeled “fast-UTR elements”) with conservation across 60 placental mammal species (phyloP) displayed at each nucleotide position.
Furthermore, the genes selected under these different regimes were enriched in different biological categories. Rapidly evolving 3′ UTRs were overrepresented among genes related to inflammation and metabolism (Fig. 6C; Supplemental Table 3), whereas strictly conserved 3′ UTRs exhibited were enriched in Gene Ontology categories involving body plan development and organ morphogenesis (Fig. 6D; Supplemental Table 4). We examined steady-state reporter mRNA abundance for biological categories of genes well represented among elements in our fast-UTR library. As expected from GC content, the steady-state reporter mRNA abundance for sequences from the rapidly evolving response to cytokine gene set were lower than those from strictly conserved regulation of cell cycle genes (Fig. 6E). 3′ UTRs often contain multiple elements with similar sequence conservation that correspond with regulatory activity in fast-UTR. For example, the mouse cytokine response genes Ikbke and Ifngr1 harbor multiple destabilizing cis-regulatory elements with poor interspecies sequence conservation and high GC content (Fig. 6F, top). In contrast, we observed high steady-state reporter mRNA abundance for multiple GC-poor elements from the deeply conserved 3′ UTR of the regulation of cell cycle gene Cdk17 (Fig. 6F).
Given this relationship between UTR GC content, conservation, and biological category, we examined whether UTR GC content was related to expression breadth. That is, are ubiquitously expressed genes more likely to have low 3′ UTR GC content? We examined the GC content of the longest 3′ UTR isoform of all genes in the human genome and compared these with the coefficient of variation of gene expression across more than 100 tissues measured by the GTEx Consortium (2017). There was a modest but statistically significant trend where genes with more variable expression across tissues tended to have higher GC content in their 3′ UTR (r = 0.07, Supplemental Fig. S6).
Cell-essential genes are depleted of GC-rich 3′ UTR sequences
We were intrigued by the association we observed between activity in heterologous gene expression reporter assays and the nucleotide composition of strictly conserved 3′ UTRs. We hypothesized that the strict conservation observed in GC-poor, unstructured 3′ UTRs might be related to purifying selection for optimal gene expression and protein production. One prediction of this hypothesis is that GC-rich sequences should be depleted from the 3′ UTRs of cell-essential genes, because the average abundance of proteins encoded by these genes are greater than nonessential genes (Taniguchi et al. 2010). Indeed, the 3′ UTR of genes that were found to be cell essential in viability screen of a haploid human cell line (Blomen et al. 2015) exhibited significantly lower GC content than similar nonessential genes (Fig. 7; Supplemental Table 5). This observation held for genes that had strictly conserved 3′ UTRs, rapidly evolving 3′ UTRs, or neither strict conservation nor rapidly evolving sequence. Thus, low 3′ UTR GC content is independently associated with cell essentiality, suggesting that selection for robust protein expression drives the evolution of unstructured sequences in the 3′ UTRs of vertebrate genes.
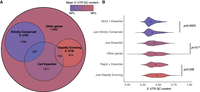
Cell-essential genes have 3′ UTRs with lower than average GC content. (A) Venn diagram depicts mean overlap of cell-essential genes with classes of genes determined to have a strictly conserved or rapidly evolving 3′ UTR as defined in Figure 6. The color of each region reflects mean GC content of 3′ UTRs therein. (B) Identically color-coded violin plot shows the distribution of GC content of 3′ UTRs for the indicated gene groups depicted in the Venn diagram.
Discussion
This study presents data suggesting that effects of untranslated region nucleotide composition affect mRNA abundance and shapes transcript sequences throughout vertebrate genomes. Across multiple experiments using different experimental modalities in primary mouse cells and human cell lines, GC-rich 3′ UTR sequences were associated with lower steady-state mRNA expression, lower mRNA half-life, and lower protein expression. These GC-rich sequences are more likely to be folded, as determined by theoretical local folding energies as well as in vivo measurements of RNA conformation. Across vertebrate 3′ UTRs, there is a tendency toward purifying selection of GC-poor sequences in 3′ UTRs, whereas GC-rich 3′ UTRs tend to exhibit divergent, lineage-specific sequences. Taken together, these results paint a global picture in which purifying selection winnows away 3′ UTR sequences with high local GC content in certain classes of genes. These GC-rich regions are more likely to be folded in vivo and reduce the amount of protein produced from a given amount of transcript.
When GC-rich sequences arise in 3′ UTRs, they tend to exhibit accelerated evolution. That is, they become fixed in the lineage at a rate greater than would be predicted by neutral drift. GC-biased gene conversion may contribute to this phenomenon, favoring the creation of novel post-transcriptional regulatory elements, but this process affects only a small portion of vertebrate genomes—approximately 0.3% of the human genome (Capra et al. 2013). Only 13 of the 1198 rapidly evolving vertebrate 3′ UTRs that we identified in this study overlapped with regions of the human genome undergoing GC-biased gene conversion. Given the genome-wide scale of the evolutionary trends we observed, we conclude that more pervasive selection for the biological outcomes of gene expression drive the observed patterns of nucleotide composition in untranslated regions of transcripts.
Our massively parallel reporter data were generated using sequences that are occupied by RBPs in primary mouse T cells. However, the relationship between GC content and steady-state mRNA abundance also held in randomly generated controls in the same library, as well as in other massively parallel reporter assays that were not focused on biochemically characterized RBP binding sites (Zhao et al. 2014). In addition, we also found the same relationship in previously published measurements of mRNA half-life using a tetracycline repressible vector, FACS-sorting measurement of protein production, and in both plasmid-based luciferase assays and in vitro–transcribed mRNA-based Kikume reporter assays described in the present work.
Our results leave unresolved the specific mechanism of regulation of gene expression by differences in 3′ UTR nucleotide composition. 3′ UTR regulatory sequences can direct both translational repression and transcript destabilization. Either or both of these mechanistically linked modes of post-transcriptional repression might be driven by any highly structured mRNA sequence, and this cis-regulatory activity may or may not require a trans-regulatory binding event with specific RBPs. Indeed, increased gene expression also correlates with lower GC content in the N-terminal region of protein coding sequences in E. coli, and this pattern is driven by mRNA secondary structures (Goodman et al. 2013). Because the relationship between GC content, mRNA structure, and gene expression appears to exist across regions of transcripts and in extremely distantly related species, it may be an inherent aspect of universal biological processes such as transcription and translation. However, these tendencies may also be explained or at least amplified by specific gene regulatory RNA binding proteins.
There are several well-described examples of RBPs that bind to GC-rich and/or locally folded structures and lead to transcript degradation, including RC3H1 (also known as Roquin) (Leppek et al. 2013), ZC3H12A (also known as MCPIP1) (Uehata et al. 2013), UPF1 (Imamachi et al. 2017), and STAU1 (Staufen) (Sugimoto et al. 2015). Although RC3H1 and ZC3H12A have been described to bind to stereotypic hairpin structures that exhibit sequence conservation, their binding specificity throughout the transcriptome has not yet been defined. UPF1 directs mRNA decay through binding to CUG motifs within GC-rich regions of target 3′ UTRs (Imamachi et al. 2017). STAU1 binds promiscuously to tightly folded sequences in 3′ UTRs of transcripts throughout the genome, typified by runs of guanines base-paired with pyrimidine rich tracts. There may be other RBPs like STAU1 that use promiscuous binding to dsRNA to mediate transcript degradation (Park and Maquat 2013). However, other RBP interactions with locally folded structures are associated with mRNA stabilization, such as iron regulatory element binding proteins that stabilize and sequester mRNAs involved in iron metabolism. The lack of known binding partners for active structural motifs that we identified by functional analysis of GCLiPP peaks hints at the existence of a broad regulatory interactome. Future work should leverage these data to discover and classify gene regulatory interactions between trans-acting RBPs and cis-regulatory sequences in their endogenous context. Such efforts may also allow interrogation of functional interaction between cis-regulatory elements in the same transcript, overcoming a limitation of massively parallel reporter assays that interrogate cis-regulatory elements in isolation.
The general lack of conservation of mRNA destabilizing regions suggests that the major selective pressure on most 3′ UTRs has not been to retain regulatory elements that induce transcript degradation, but rather to conserve sequences associated with mRNA stability and consequently greater protein production. Highly conserved strongly destabilizing elements such as canonical AU-rich element nonamers (Zubiaga et al. 1995), the Tnf constitutive decay element and other conserved RC3H1 binding loops (Leppek et al. 2013), and destabilizing UGU-containing motifs bound by CUG binding proteins (Beisang et al. 2012) are exemplary counterexamples to this general pattern in 3′ UTR evolution (Siepel et al. 2005). These examples are likely driven by selection for stringent controls on genes whose inappropriate overexpression can be deleterious, such as inflammatory mediators and proto-oncogenes.
Among RBP-occupied regions assayed in our massively parallel reporter assay, the most strongly destabilizing sequences tended to be very GC rich and rapidly evolving, often exhibiting highly divergent sequences between mouse and human, two vertebrates that are only separated by ∼75 million years from their last common ancestor. For these rapidly evolving sites, species-specific acquisition of high GC content is associated with acquisition of destabilizing activity. Therefore, acquisition or loss of high local GC content in 3′ UTRs may be a major mechanism for the diversification of gene expression across species. The GC content of synonymous wobble bases in coding sequences correlates with the GC content of 3′ UTRs of the same gene (Mignone et al. 2002), suggesting that selection on finely tuned gene expression may be a strong pressure driving mRNA sequence variation in general.
The classes of genes that exhibit these patterns of selection are not random, as genes involved in organismal development exhibited evidence of purifying selection for GC-poor 3′ UTRs, whereas genes involved in metabolism and immune response tended to vary in 3′ UTR sequence. Thus, it appears that there are specific classes of genes that are functionally selected to create a large amount of protein per transcript, and that these genes tend to be involved in core developmental processes. Consistent with this idea, cell-essential genes exhibit lower 3′ UTR GC content than nonessential genes independently of their sequence conservation. Other classes of genes are post-transcriptionally constrained by cis-regulatory elements whose sequences vary between species. These genes may have evolved tailored expression programs in response to evolutionary pressure to contain pathogens or metabolize xenobiotics. This enrichment for rapidly evolving 3′ UTRs with mRNA destabilizing activity suggests that species-specific post-transcriptional regulation may occur frequently in immune genes. Dissecting the cis-regulatory activity of 3′ UTRs from this class of genes may yield further insights into the evolution and function of the noncoding transcriptome.
Methods
Cells
Primary CD4+ mouse T cells were isolated from C57BL/6J peripheral lymph nodes and spleen using positive selection Dynabeads, according to the manufacturer's instructions (Invitrogen). Cells from three mice were plated at 107 cells per 10 cm dish in three cultures. Cells were stimulated with immobilized biotinylated anti-CD3 (clone 2C11, 0.25 µg/mL, Bio X Cell) and anti-CD28 (clone 37.51, 1 µg/mL, Bio X Cell) bound to Corning 10-cm cell culture dishes coated with Neutravidin (Thermo Fisher Scientific) at 10 µg/mL in PBS for 3 h at 37°C. Cells were left on stimulation for 3 d before being taken off stimulation and split into noncoated dishes in T cell medium supplemented with recombinant human IL2 (20 units/mL). Th2 cells were polarized in medium containing 100 units/mL mouse IL4 and anti-IFNγ (10 µg/mL) as described previously (Steiner et al. 2011). For restimulation, cells were treated with PMA and Ionomycin (20 nM and 1 µM, respectively) for 4 h before harvest.
Fast-UTR vector assembly, library construction, and assay
A multiple cloning site consisting of MluI, I-SceI, and PacI was inserted into the 3′ UTR of the GFP gene in a previously described T cell retroviral microRNA sensor plasmid (Steiner et al. 2011). A DNA oligonucleotide library consisting of RBP-occupied sequences and control sequences was synthesized by CustomArray. Five sets of control sequences were included: conserved regions that lacked GCLiPP peaks (∼5000 sequences), nonconserved regions that lacked GCLiPP peaks (∼5000 sequences), randomly generated sequences containing a background dinucleotide frequency that was essentially random (∼3000 sequences, all dinucleotides except for CpG represented equally, CpG represented at approximately the same frequency as the mouse genome), randomly generated sequences using the dinucleotide frequency of the mouse genome (∼2000 sequences), and randomly generated sequences using the dinucleotide frequency of mouse 3′ UTRs (∼2000 sequences). Additionally, we included 1173 human syntenic regions for the most rapidly evolving protein binding peaks in mouse 3′ UTRs. These sequences were determined by using the kentUtils liftOver program on a single nucleotide at the very center of the 70-nt peak, and taking the 70 nt adjacent to the lifted over nucleotide for mouse peaks where a lift Over could successfully be determined.
The library was amplified using Q5 polymerase and a real-time PCR cycler (Realplex 2S; Eppendorff) through the linear range, cleaned up with a PCR cleanup kit (Qiagen), cut with MluI and PacI, and separated on a 10% TBE polyacrylamide gel to isolate cleaved PCR fragments. The vector fragment was cut with MluI, I-SceI, and PacI, separated on a 1% agarose gel and subjected to gel purification (Qiagen). Insert and vector DNA were quantified and ligated at a ∼10:1 molar insert:vector ratio using a quick T4 ligase kit (New England Biolabs). The ligation mixture was purified by PCR cleanup kit and electroporated into TG1 electrocompetent bacteria (Lucigen). Colonies were plated on bioassay plates, and plasmid was prepared from pooled colonies scraped from bioassay plates into LB media. Ecotropic retrovirus was made by transient transfection of plasmid into Plat-E packaging cells by calcium phosphate method. Plat-E cells were grown in complete DMEM supplemented with 5% FBS. After transfection, packaging cells were left with DNA overnight, then aspirated and incubated with fresh collection media containing 10% fetal bovine serum and 1× ViralBoost reagent (ALStem). Virus containing supernatant was collected, mixed with 8 µg/mL polybrene, and transferred to day 2 cultured mouse T cells for 6 h. Untitered supernatant from producer cells was used. Cells were transduced at an MOI < 1 with 10%–20% of cells transduced as assessed by expression of human CD25.
Transduced cells were grown for 3 additional days, washed thrice with PBS, and then collected in TRIzol reagent (Thermo Fisher Scientific). RNA was collected according to the manufacturer's protocol, but after the first aqueous phase was removed, the same volume of back-extraction buffer (4 M Guanidine Thiocyanate, 50 mM Sodium Citrate, 1 M Tris base) was added and re-separated, and DNA was precipitated from the second aqueous phase. RNA was reverse transcribed using a SuperScript III RT kit (Invitrogen), and both cDNA and genomic DNA were used as a template for PCR amplification of fast-UTR inserts. PCR was performed as a qPCR using Q5 polymerase (NEB). Samples were harvested at the first cycle after the linear range of amplification (22–25 cycles). For genomic DNA PCR, samples were prepared at 4 mL scale with 10% volume of 1 µg/µL DNA (400 µg of genomic DNA total). For cDNA PCR, samples were prepared at 2.5 mL scale with 10% volume of cDNA prepared with the maximum RNA input recommended by the SuperScript III protocol (cDNA prepared from 62.5 µg of total RNA).
Amplicons were separated on a 2% agarose gel for size selection and gel extraction. Purified DNA was analyzed on an Agilent 2100 Bioanalyzer and sequenced on a HiSeq 4000, run with 50% PhiX spike-in to allow clustering of nondiverse 5′ (vector) ends. The oligos for sequencing library preparation were as follows: fast-UTR amplification forward primer: 5′-CAAGCAGAAGACGGCATACGAGATNNNNNNGTGACTGGAGTTCAGACGTGTGCTCTTCCGATCTGCTAGACGCGTAGGTTCAGA-3′ (NNNNNN is a sample barcode for demultiplexing), fast-UTR reverse primer: 5′-AATGATACGGCGACCACCGAGATCTACACTCTTTCCCTACACGACGCTCTTCCGATCT-3′.
Fast-UTR data analysis and TEISER analysis
Sequencing reads trimmed of vector sequences were aligned to the oligonucleotide library using Bowtie 2 (Langmead and Salzberg 2012). Each fast-UTR insert was amplified from the oligonucleotide library with a hexanucleotide random barcode inserted in the 3′ amplification primer. The sequencing was run as single-end 50-nt reads so there was no merging of reads. Reads were trimmed of barcodes using FASTX Trimmer (http://hannonlab.cshl.edu/fastx_toolkit/). Bowtie 2 was run with default parameters using a custom genome consisting of the FASTA file used to synthesize the DNA oligo library. Reads were tabulated from a SAM alignment filing using a custom Perl script (Supplemental File S1).
A ratio of RNA reads to genomic DNA reads was computed for each barcoded insert, and a weighted average of ratios (weighted by the number of genomic DNA reads, considered to be a proxy for the amount of expansion of each independently transduced clone). This weighted ratio for each insert was divided by the ratio for the median insert and this median normalized RNA/DNA ratio (steady-state mRNA abundance) was used for analysis of insert stability (values <1 are less stable than the median insert, >1 more stable). Each barcoded insert needed to be detected in at least two reads in the genomic DNA to be considered valid. Barcoded data were collapsed into a single RNA-to-DNA ratio, but only for inserts in which at least two independent valid barcodes were detected in the genomic DNA. Bowtie 2 was run with the default parameters which does allow mismatches owing to sequencing mistakes. We were not able to exclude imperfect matches throughout the sequence because our sequencing did not read completely through the insert (50 nt reads versus 70 nt insert). Our library was diverse in the sequenced region of the insert (e.g., because there were no mutational variant sequences included), but we did not correct for single nucleotide synthesis/sequencing errors. We sequenced >95% of the inserts in our library and noted that the sequences that failed were often very high in AT content.
All statistical analyses of fast-UTR sequences were performed with R programming language (R Core Team 2018). TEISER structural motif discovery was performed on GCLiPP peak sequences ranked by their steady-state mRNA abundance as previously described (Goodarzi et al. 2012).
Reporter assays
For luciferase assays, 3′ UTRs were cloned into the dual-luciferase reporter plasmid psiCHECK-2 (Promega) downstream from the Renilla luciferase stop codon into the XhoI and NotI sites. Cultures of Th2 cells from three or four mice were grown in vitro for 4 d and 400,000 cells were transfected in triplicate (technical replicates) with 1 µg of plasmid DNA. Twenty-four hours later, Firefly and Renilla luciferase activity were measured with the Dual-Luciferase Reporter Assay System (Promega) according to manufacturer's instructions. The mean of technical replicates was used as the ratio of Renilla to Firefly luciferase activity for each culture. Sample size necessary to observe significant differences in protein production was estimated based on previous reporter assays evaluating effects of microRNAs.
For protein production assays, the Kikume Green-Red coding sequence was PCR amplified from the pCAG-KikGR plasmid (AddGene) with primers designed to add a T7 in vitro transcription signal to the 5′ end of the coding sequence and a sequence of interest (flanked by 6 Us on both the 5′ and 3′ sides) to the 3′ end (Nowotschin and Hadjantonakis 2009). The control poly(U) 32 and Tnf constitutive decay element sequences were from Zubiaga et al. (1995) and Leppek et al. (2013), respectively. KikGR PCR products were cleaned up and used as templates for in vitro transcription using the HiScribe T7 ARCA mRNA Kit with tailing according to the manufacturer's instructions (New England Biolabs). mRNA integrity and poly(A) tailing was assessed by agarose gel electrophoresis. Cultures of CD8 cells from three or four mice were grown in vitro for 3 d and 2 × 10⁶ cells were transfected with 2 µg of mRNA for each construct. To measure protein production in a specific time frame, Kikume protein was photoconverted from green to red after 4 h by exposure to violet flashlight for 10 min, then cultured for another 4 h before analysis by flow cytometry. Transfected cells were run on an LSRII with a yellow-green laser (BD Biosciences) gated on KikG+ cells, and the mean fluorescence intensity of KikR (produced before photoconversion) was determined using Cytobank software (http://www.cytobank.org).
icSHAPE and Phylogenetic analyses
Predicted RNA folding energies were computed using the ViennaRNA rnafold program (http://www.tbi.univie.ac.at/RNA/) (Lorenz et al. 2011) and visualized using forna (http://rna.tbi.univie.ac.at/forna/) (Kerpedjiev et al. 2015). For icSHAPE, we used a published bigWig file of locally normalized icSHAPE signal intensity generated in mouse ES cells (Spitale et al. 2015). To measure conservation of loci in the mouse genome in placental mammals, we used the placental mammal phyloP bigWig file from the UCSC Genome Browser (http://hgdownload.cse.ucsc.edu/goldenpath/mm10/phyloP60way/). We computed mean phyloP and icSHAPE scores across given GCLiPP peaks and called EP300 enhancer peaks (Vahedi et al. 2012) by using custom Perl scripts (Supplemental Files S2, S3, respectively) calling the kentUtils bigWigSummary program.
To examine conservation across vertebrate 3′ UTRs, we downloaded genomes and 3′ UTR annotations for nine vertebrate species (Bos taurus, Canis familiaris, Danio rerio, Gallus gallus, Homo sapiens, Macaca mulatta, Mus musculus, Rattus norvegicus, Xenopus tropicalis) from the UCSC Genome Browser (https://genome.ucsc.edu/). To avoid aligning nonsyntenic sequences we only used 3′ UTRs for which a single annotated 3′ UTR existed. For genes with so annotated 3′ UTRs from four or more species, we performed multiple sequence alignments with Clustal Omega (https://www.ebi.ac.uk/Tools/msa/clustalo/) and computed P-values for conservation or acceleration of those multiple sequence alignments using a standard vertebrate phylogenetic model (vertebrate.mod available at http://hgdownload.cse.ucsc.edu/goldenPath/hg19/phyloP46way/) using the phyloP program (http://compgen.cshl.edu/phast/help-pages/phyloP.txt). 3′ UTR phyloP scores would not be altered by using GRCh38. We used a custom Perl script (Supplemental File S4) to score the GC content of the individual aligned sequences and analyzed the collated data in R. 3′ UTRs were then classified on the basis of whether they exhibited strong evidence (P < 0.001) or weak evidence (P > 0.1) of strict conservation or accelerated evolution. The genes in each of these categories were analyzed for enrichment of genes from biological categories using the Metascape online interface (http://metascape.org) using the default settings. The variability of gene expression across tissues was determined by calculating the coefficient of variation of transcript levels in RNA-seq across about 100 tissue samples reported by the GTEx Consortium (2017) and was downloaded from the UCSC Genome Browser. The GC content of each gene in the GTEx data set was determined by using the BioMart package from BioConductor (Durinck et al. 2009).
Data access
All sequencing data reported in this study have been submitted to the NCBI BioProject database (BioProject; https://www.ncbi.nlm.nih.gov/bioproject/) under accession number PRJNA516474. The custom Perl script used to score aligned fast-UTR reads is included as Supplemental_File_S1.pl. The custom Perl scripts used to calculate mean phyloP scores and to extract icSHAPE scores are included as Supplemental_File_S2.pl and Supplemental_ File_S3.pl, respectively. The Perl script used to score the GC content of aligned sequences is included as Supplemental_File_S4.pl.
Acknowledgments
We thank Matija Peterlin and Alex Marson for critical reading of the manuscript. A.J.L. was supported by a Cancer Research Institute Irvington Fellowship and the UCSF Immunology T32 training grant T32AI007334 (NIH: NIAID). This work was supported by the U.S. National Institutes of Health (NHLBI: HL107202, HL109102; NIAID: AI128047; NHLBI: HL124285; NIGMS: GM110251), the Sandler Asthma Basic Research Center, and a Scholar Award (K.M.A.) from The Leukemia and Lymphoma Society.
Footnotes
-
[Supplemental material is available for this article.]
-
Article published online before print. Article, supplemental material, and publication date are at http://www.genome.org/cgi/doi/10.1101/gr.242552.118.
- Received August 1, 2018.
- Accepted May 2, 2019.
This article is distributed exclusively by Cold Spring Harbor Laboratory Press for the first six months after the full-issue publication date (see http://genome.cshlp.org/site/misc/terms.xhtml). After six months, it is available under a Creative Commons License (Attribution-NonCommercial 4.0 International), as described at http://creativecommons.org/licenses/by-nc/4.0/.


