
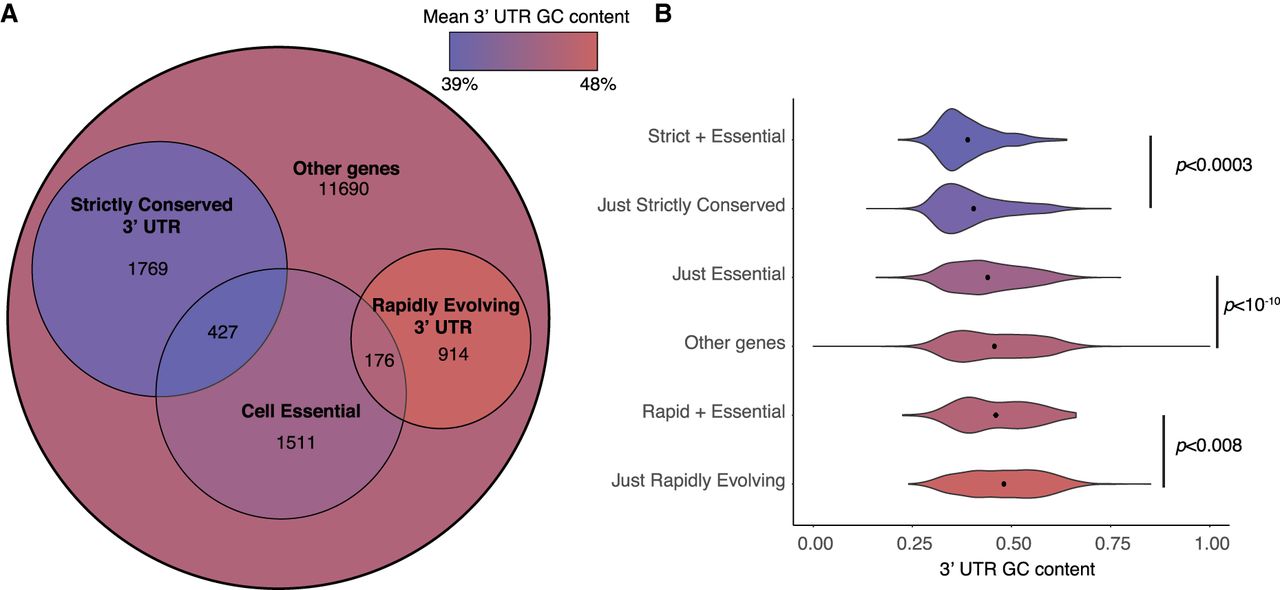
Figure 7.
Cell-essential genes have 3′ UTRs with lower than average GC content. (A) Venn diagram depicts mean overlap of cell-essential genes with classes of genes determined to have a strictly conserved or rapidly evolving 3′ UTR as defined in Figure 6. The color of each region reflects mean GC content of 3′ UTRs therein. (B) Identically color-coded violin plot shows the distribution of GC content of 3′ UTRs for the indicated gene groups depicted in the Venn diagram.


