
LTRs activated by Epstein-Barr virus–induced transformation of B cells alter the transcriptome
Abstract
Endogenous retroviruses (ERVs) are ancient viral elements that have accumulated in the genome through retrotransposition events. Although they have lost their ability to transpose, many of the long terminal repeats (LTRs) that originally flanked full-length ERVs maintain the ability to regulate transcription. While these elements are typically repressed in somatic cells, they can function as transcriptional enhancers and promoters when this repression is lost. Epstein-Barr virus (EBV), which transforms primary B cells into continuously proliferating cells, is a tumor virus associated with lymphomas. We report here that transformation of primary B cells by EBV leads to genome-wide activation of LTR enhancers and promoters. The activation of LTRs coincides with local DNA hypomethylation and binding by transcription factors such as RUNX3, EBF1, and EBNA2. The set of activated LTRs is unique to transformed B cells compared with other cell lines known to have activated LTRs. Furthermore, we found that LTR activation impacts the B cell transcriptome by up-regulating transcripts driven by cryptic LTR promoters. These transcripts include genes important to oncogenesis of Hodgkin lymphoma and other cancers, such as HUWE1/HECTH9. These data suggest that the activation of LTRs by EBV-induced transformation is important to the pathology of EBV-associated cancers. Altogether, our results indicate that EBV-induced transformation of B cells alters endogenous retroviral element activity, thereby impacting host gene regulatory networks and oncogenic potential.
Endogenous retroviruses (ERVs) make up ∼8% of the human genome (Lander et al. 2001). A complete ERV element contains two long terminal repeats (LTRs), containing the regulatory elements responsible for transcription, flanking the Gag-, Pol-, and Env-coding sequences needed for transposition activity (Mager and Stoye 2015). In the human genome, the vast majority of ERVs are solitary LTRs, and many of these still maintain the ability to regulate transcription under certain conditions. A subset of these LTRs has been co-opted as regulatory elements for other genes (Maksakova et al. 2008; Rowe and Trono 2011; Leung and Lorincz 2012; Thompson et al. 2016).
There are many examples in which LTR-driven transcripts play a role in pluripotent cells. In the early embryo of both humans and mice, specific ERV groups are active and drive expression of many transcripts (Evsikov et al. 2004; Peaston et al. 2004; Macfarlan et al. 2012; Maksakova et al. 2013; Göke et al. 2015). Likewise, both embryonic stem cells and induced pluripotent stem cells express LTR-driven transcripts important for pluripotency (Leung and Lorincz 2012; Fort et al. 2014; Lock et al. 2014; Lu et al. 2014; Ohnuki et al. 2014; Hashimoto et al. 2015; Babaian et al. 2016; Klawitter et al. 2016). In pathways other than development, LTR-driven transcripts have also been found to be expressed in autoimmune diseases and several types of cancer, including lymphoma, hepatocellular carcinoma, and prostate cancer (Lamprecht et al. 2010; Prensner et al. 2013; Lock et al. 2014; Hashimoto et al. 2015; Babaian et al. 2016; Chuong et al. 2016). While this work has led to an appreciation of the degree of aberrant LTR activation in normal and disease cells, the mechanisms that lead to LTR activation have remained unclear.
Epstein-Barr virus (EBV) was originally discovered in cells derived from a Burkitt's lymphoma biopsy. EBV can readily infect primary B lymphocytes (B cells) in vitro and transform them into continuously proliferating lymphoblastoid cell lines (LCLs), leading to the classification of EBV as a tumor virus (Epstein et al. 1964; Pope et al. 1973). In addition to lymphomas, EBV has been associated with many other cancer types, including nasopharyngeal carcinoma, gastric adenocarcinoma, and lymphoepithelioma-like carcinomas (Hsu and Glaser 2000). In memory B cells, EBV can remain quiescent in a latent state using one of four latency programs, all of which are characterized by distinct expression of EBV-encoded genes, including transcription factor genes (Thorley-Lawson 2001). Transformation of primary B cells leads to genome-wide transcriptional changes, including decreased transcription of apoptotic genes and increased transcription of proliferative genes (Allday 2013; Price and Luftig 2014; Price et al. 2017). EBV-induced transformation of primary B cells also leads to extensive DNA hypomethylation across the genome, similar to what is observed in cancer cells (Hernando et al. 2013; Hansen et al. 2014). It has furthermore been found that EBV infection in primary B cells transactivates a human ERV locus, ERVK-18 (also known as HERV-K18), leading to the expression of a superantigen important for T-cell response (Sutkowski et al. 1996). Based up on this, we set out to determine if EBV-induced transformation of B cells leads to activation of LTRs.
To evaluate the impact of EBV-induced transformation of primary B cells on LTRs across the genome, we examined H3K4me3, a chromatin modification associated with regulatory activity, in donor-matched primary B cells and LCLs. Furthermore, we examined the dynamics of DNA methylation, the binding of transcription factors (TFs), and the transcriptional changes of LTRs in B cells and LCLs.
Results
H3K4me3 profiling reveals widespread enrichment at LTRs in LCLs
To explore the potential impact of EBV-induced transformation on the chromatin environment of B cells, we generated H3K4me3 profiles from three donor primary B cells and matched LCLs derived from the same donor B cells (Fig. 1A; Supplemental Fig. S1A). We identified a union set of 105,967 peaks (sites) of H3K4me3, a chromatin modification associated with enhancers and promoters, from B cells and LCLs. To identify genes that are differentially enriched for H3K4me3, we performed DESeq2 analysis (Methods; Supplemental Methods) on read counts found in the 2-kb region surrounding the promoter (i.e., ±1 kb) of genes (hg19 RefSeq annotation) that overlap a H3K4me3 site, and found 9654 sites as variable across the two groups (adjusted P < 0.01) with 5853 increased and 3801 decreased (Fig. 1B, top). Up-regulated sites were enriched at promoters of genes with the top KEGG term of “pathways in cancer” (Supplemental Fig. S1B). Genes found in this KEGG term included many genes known to be up-regulated by EBV, including FAS, IKBKB, and TRAF1 (Supplemental Fig. S1C; Hernando et al. 2013). These data demonstrate that the H3K4me3 profiles of primary B cells and LCLs capture known transcriptional changes at genes related to the transformation of B cells to LCLs.
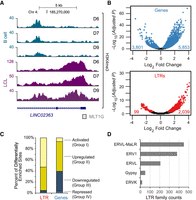
EBV-induced transformation of B cells activates LTRs. (A) Genome browser tracks of H3K4me3 profiles at LINC02363, a long noncoding gene, with the MLT1G LTR at the transcriptional start site (TSS). (B) Volcano plots of normalized H3K4me3 read counts in LCLs relative to B cells at TSSs of genes (top) and at LTRs (bottom). (C) Percentage of differentially enriched H3K4me3 LTRs and genes classified as “activated,” “up-regulated,” “down-regulated,” and “repressed.” (D) Enumeration of the LTR families that are activated in LCLs (Group I).
We next examined the possibility that EBV-induced transformation influences transcriptional activity, as measured by increase in H3K4me3 enrichment, of LTR promoters and enhancers across the genome. Taking all LTR sites (RepeatMasker) (Smit et al. 2013–2015) found in the human genome, we performed DESeq2 analysis with read counts mapping to LTR sites that overlap a H3K4me3 site. Of the 2138 differentially enriched LTR sites (adjusted P < 0.05) discovered by this analysis, the vast majority (2039) display an increase in H3K4me3 enrichment in LCLs compared with B cells (Fig. 1B, bottom). These LTRs sites can be found at the transcriptional start sites (TSSs) of both long noncoding RNAs (e.g., LINC02363) (Fig. 1A) and protein-coding genes (Supplemental Fig. S2). In comparison to TSSs of genes, which show roughly equivalent degrees of increase and decrease in H3K4me3 enrichment in LCLs compared with B cells (Fig. 1B, top), LTRs have a marked increase in H3K4me3 in the LCLs (Fig. 1B, bottom). We next distinguished the LTRs and genes that are Group I, “activated” by complete gain of H3K4me3 (i.e., not enriched for H3K4me3 in B cells); Group II, “up-regulated” by increase in H3K4me3 (i.e., enriched with H3K4me3 in B cells); Group III, “down-regulated” (i.e., decrease in H3K4me3, but still enriched in LCLs; and Group IV, “repressed” (i.e., no H3K4me3 enrichment in LCLs) (Fig. 1C). With this classification, 1134 LTRs are found in Group I and from hereon will be referred to as “activated LTRs.” These data indicate a widespread activation of LTR promoters after EBV-induced transformation. ERVK-18, an ERV1 element known to be induced by EBV infection, is found in the activated group as expected (Supplemental Fig. S3). Examining the specific subfamilies of LTR that are activated by EBV transformation revealed that the majority of the activated LTRs belong to either the ERV1 or ERVL-MaLR/ERVL families of LTRs (Fig. 1D). While there is great variety in the subfamilies of LTRs (241 subfamilies) (Supplemental Table S1), we found a dramatic activation of MLT subfamily members than expected by chance (e.g., MLT1D [P = 0.013], MLT1K [P = 0.008], and MLT1F1 [P = 0.002]), and MER41 subfamily members (e.g., MER41A [P < 0.001], and MER41B [P = 0.011]) (Supplemental Table S1). These data indicate that specific subfamilies of LTRs may be more susceptible to activation. To assess if there are any DNA rearrangements at LTRs that may lead to activation of these LTRs, we performed PCR analysis of genomic DNA and confirmed that there is no obvious rearrangements in the two assayed LTRs (Supplemental Fig. S4).
Cryptic LTR promoter and enhancer activation coincides with loss of DNA methylation and binding of transcription factors
LTRs can be silenced through repressive histone modifications (Rowe and Trono 2011; Leung and Lorincz 2012; Liu et al. 2014), corepressors (Jacobs et al. 2014; Wolf et al. 2015), and DNA methylation (Wolf and Goff 2008). EBV transformation of B cells has been shown to induce large-scale loss of DNA methylation, akin to the loss of DNA methylation in cancer cells (Hernando et al. 2013; Hansen et al. 2014). We therefore examined the DNA methylation profiles of activated LTRs after EBV transformation. Utilizing whole-genome bisulfite sequencing data from primary B cells and matched LCLs (GSE49627) (Hansen et al. 2014), we examined DNA methylation and H3K4me3 (this paper) at the activated LTRs. Comparing the average CpG methylation level change at LTRs in three donor B cells with the three LCLs revealed that activated LTRs are generally hypomethylated upon EBV treatment and have corresponding increases in H3K4me3 (Fig. 2A, representative example Fig. 2B). In contrast to the large-scale hypomethylated blocks previously reported in EBV-induced B cell immortalization (Hansen et al. 2014), the DNA methylation changes we observed were more local changes, specific to the LTR elements (Fig. 2B; Supplemental Fig. S5). These data support the idea that hypomethylation is concurrent with LTR activation. We next addressed whether loss of DNA methylation itself is sufficient to activate LTRs. Examining DNA methylation at all LTRs, regardless of activation status, indicated that hypomethylation does not necessarily result in gain of H3K4me3 modifications after EBV-induced transformation (Fig. 2C), suggesting that loss of DNA methylation is not sufficient to activate LTRs in B cells and that additional regulatory factors are required.
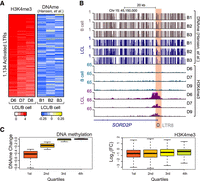
Activated LTRs are hypomethylated in LCLs. (A, left) Heatmap of H3K4me3 in three B cell donors and three matched LCLs at activated LTRs; (right) heatmap of DNA methylation changes in matched B cells and LCLs at activated LTRs. (B) Genome browser tracks of DNA methylation and H3K4me3 profiles in B cells and LCLs at a SORD2P locus driven by an LTR8. (C) Boxplot of DNA methylation changes (left) and H3K4me3 change (right) between B cells and LCLs stratified into quartiles based on DNA methylation change.
To gain a better understanding of the regulatory factors involved in activating LTRs, we next examined transcription factor binding at activated LTRs in GM12878 cells using ChIP-seq data for TFs generated from ENCODE (Dunham et al. 2012), along with EBNA2 (GSE29498), RPBJ (GSE29498), and NF-κB subunits (GSE55105) (Zhao et al. 2011, 2014). Overall, we found that there are 36 transcription factors bound to at least 25% of the activated LTR sites (Fig. 3A). A number of these transcription factors are up-regulated in LCLs, including RUNX3, EBF1, and EBNA2 (Supplemental Fig. S6), as expected based upon existing literature (Spender et al. 2002; Tempera et al. 2016). RUNX3, a transcription factor expressed throughout the hematopoietic system that is specifically up-regulated by EBV during LCL development and promotes cell proliferation (Spender et al. 2002; Brady et al. 2009), is bound at ∼67% of LTRs activated by EBV-induced transformation. EBF1, which is important for B cell lineage development (Boller and Grosschedl 2014), is also among the most enriched transcription factors at activated LTRs. IKAROS/IKZF1, which binds to ∼25% of activated LTRs, plays key roles in the latent-lytic switch of EBV in B cells, indicating that perhaps LTR activation is influenced by EBV-induced pathways (Iempridee et al. 2014). EBNA2, a TF encoded in the EBV genome, is bound to ∼30% of the EBV-activated LTRs (Fig. 3A), Given that many transcription factors bind to common regulatory regions (Wang et al. 2013), we examined the co-occupancy of transcription factors bound at activated LTRs by performing hierarchical clustering of pairwise correlations of binding patterns (Methods). This analysis revealed clusters that appear to co-occupy LTRs together (Fig. 3B). EBNA2 cobinds with RBPJ, as has been previously demonstrated (Zhao et al. 2011). Other clusters include a RUNX3 cluster with many of the factors binding the largest fraction of activated LTRs, a general TF/chromatin cluster with EP300/CHD2, and an NF-κB cluster with RELA, RELB, REL (also known as c-Rel), and NFKB2 (also known as p52) (Fig. 3B). We next asked whether a particular subfamily is more likely to be bound by the top 10 transcription factors. Overall, the LTR subfamily bound by these transcription factors is diverse (Supplemental Fig. S7; Supplemental Table S2). We next examined the number of EBV-activated LTRs that give rise to transcripts using cap-analysis of gene expression (CAGE) data from GM12878 cells (ENCODE) (Hoffman et al. 2013). In total, ∼31% of EBV-activated LTRs overlap CAGE-enriched sites, indicating this subset of LTRs can initiate transcription (Fig. 3C). Those without CAGE evidence are likely either transcribing weakly or serving as regulatory regions for other genes.
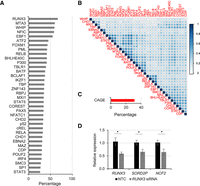
Activated LTRs are binding sites for many transcription factors in GM12878 cells and can promote transcription. (A) Bar graphs of the percentage of activated LTRs bound by each transcription factor. (B) Correlation plots (Pearson's) of transcription factor co-occupancy at EBV-activated LTRs. Hierarchical clustering was performed to identify transcription factors that co-occur. (C) Percentage of activated LTRs with CAGE sequences in GM12878 cells, indicating promoter activity. (D) RT-qPCR of RUNX3, SORD2P, and NCF2 transcripts after siRNA knockdown of RUNX3 transcripts. (*) P < 0.05.
To determine if RUNX3 binding at LTRs is necessary to drive transcription of LTR-driven transcripts, we performed siRNA knockdown of RUNX3 and examined the expression of several genes driven by cryptic LTR promoters (Fig. 3D). Upon RUNX3 knockdown, the genes we examined were reduced in expression, consistent with RUNX3 binding at cryptic LTR promoters contributing to the expression of these genes.
LTRs activated by EBV are mostly unique to LCLs
Given that LTRs were previously shown to be active in other cells lines, including H1 (embryonic stem cell) and K562 (immortalized myelogenous leukemia) cells (Djebali et al. 2012; Fort et al. 2014), we next addressed whether the LTRs activated by EBV-induced transformation are unique to LCLs or are generally active in cell lines. By using H3K4me3 profiles generated by ENCODE from GM12878, H1, Hela S3, HUVEC, HepG2, and K562 cells (Dunham et al. 2012), we assessed the enrichment of H3K4me3 across these cell lines at activated LTRs. By using hierarchical clustering of the H3K4me3 profiles generated from two different sequencing centers within the ENCODE project, we found that the profiles from the same cell lines cluster together and that the vast majority of the activated LTRs are not enriched for H3K4me3 in other cells (Fig. 4A). These data suggest that the activation of LTRs by EBV-induced transformation occurs at a subset of loci that are unique from those activated in other cells. Indeed, analysis of H3K4me3 enrichment at all LTRs across the six cells revealed that each cell line has a distinct profile of active LTRs (Supplemental Fig. S8). We further profiled H3K4me3 profiles in different normal tissue types from RoadMap data (Roadmap Epigenomics Consortium et al. 2015) and found that the enrichment at the activated LTRs is low compared with LCLs (Supplemental Fig. S9). These data agree with previous reports that LTR expression and activity is cell-type specific (Faulkner et al. 2009; Jacques et al. 2013; Xie et al. 2013).
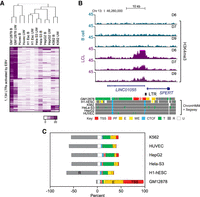
Transcriptional activity of activated LTRs is mostly specific to transformed B cells. (A) Hierarchical clustering of H3K4me3 read counts across cell lines from ENCODE data. (B) Broad; (UW) University of Washington; replicates from different sequencing centers. (B) Genome browser track of H3K4me3 profile in B cells and LCLs, and of ChromHMM + Segway combined data at the LINC01055-SPERT1 locus. (TSS) Predicted promoter region including TSS; (PF) predicted promoter flanking region; (WE) predicted weak enhancer or open chromatin cis regulatory element; (CTCF) CTCF enriched element; (T) predicted transcribed region; (R) predicted repressed or low activity region; and (U) unclassified. (C) ChromHMM + Segway combined classification of all activated LTRs shown as a frequency of total for each ENCODE cell line (color schemes as in B).
We furthermore examined whether these activated LTRs in GM12878 cells are classified as transcriptionally active regulatory regions. At specific loci, such as at LINC01055 (Fig. 4B), the LTR marked by H3K4me3 is classified by combined analysis from Segway and ChromHMM (Ernst and Kellis 2010, 2012; Hoffman et al. 2012, 2013) as a TSS. By examining the functional classification from Segway and ChromHMM of activated LTRs across the genome, we found that the majority of the activated LTRs are classified as promoters or enhancers (>80%). In contrast, these same regions are mostly classified as repressed regions in other cell lines (Fig. 4C).
EBV-induced activation of LTRs is sufficient to drive lymphoma- and cancer-related transcripts
Activation of cryptic LTR promoters has been demonstrated to promote expression of TE-driven transcripts (Babaian and Mager 2016; Elbarbary et al. 2016). To assess the potential impact of LTR activation, we examined whether activated LTRs can lead to expression of cryptic transcripts. A THE1B LTR drives the expression of a noncanonical isoform of CSF1R, leading to lineage inappropriate expression of the gene in lymphoma cells (Lamprecht et al. 2010), and a LOR1a LTR drives the expression of IRF5, which is a key regulator in the development of lymphomas (Babaian et al. 2016). By RT-qPCR analysis of RNA isolated from B cells and LCLs, we found that the noncanonical transcript is indeed expressed in LCLs but not in B cells (Supplemental Fig. S10). The canonical CSF1R transcript, however, is expressed in both LCLs and primary B cells, which was previously observed (Baker et al. 1993). Similarly, in addition to the canonical transcript, LCLs express the noncanonical IRF5 isoform driven by the LOR1a LTR (Supplemental Fig. S10). These data indicate that EBV-induced transformation of B cells is sufficient to activate LTRs driving transcripts known to be important in the development of lymphomas. We further examined the presence of additional LTR-driven transcripts. By using StringTie reference guided transcript assembly with RefSeq gene annotations, we found that there are 31 LTR-driven transcripts with five previously unannotated that are up-regulated in the LCLs (Supplemental Table S3; Supplemental Fig. S11).
Of the LTR-driven cryptic transcripts identified in our data set, an additional transcript is related to cancer. The HUWE1/HECTH9 locus has a cryptic/noncanonical isoform originating from an MLT1L LTR upstream of the canonical isoform (Fig. 5A; Supplemental Fig. S12). HUWE1 is involved in the transcriptional activity of MYC and has been found to be essential to cell proliferation in cancer cells (Adhikary et al. 2005). From our RNA-seq data set, expression of this cryptic HUWE1 transcript is clearly up-regulated in LCLs (Fig. 5B). To confirm the presence of this transcript, we performed RT-PCR specific to the isoform using primers unique to MLT1L and downstream exon 2 of HUWE1 transcript. This analysis confirmed that the cryptic HUWE1 transcript is expressed in the LCLs but not the B cells (Fig. 5C,D). Altogether, these data suggest that EBV-transformed LCLs specifically activate MLT1L at the HUWE1/HECTH9 locus to express a cryptic isoform.
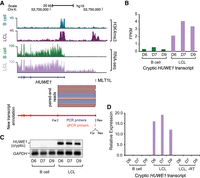
Activated LTRs can drive transcription of cryptic transcripts relevant to cancer. (A) Genome browser tracks for H3K4me3 and RNA-seq profile for B cells and LCLs at HUWE1/HECTH9 locus. Shown in red is the cryptic transcript assembled with the supporting paired-end reads from RNA-seq data set. TSS of alternative cryptic transcript overlaps MLT1L. Below transcript annotation are the PCR primers used for RT-PCR (blue) and qPCR (orange). (For) Forward primer; (Rev) reverse primer. (B) Fragments per kilobase per million reads (FPKM) in each RNA data set. (C) RT-PCR analysis of cryptic HUWE1 transcripts in B cells and matched LCLs. (D) RT-qPCR analysis of cryptic HUWE1 expression in B cells and LCLs. (-RT) no reverse transcriptase.
Discussion
Our results demonstrate that activation of LTRs by EBV-induced transformation occurs pervasively across the genome from various subfamilies of ERVs. The activation of LTRs involves both DNA hypomethylation and transcription factor binding. The transcriptional activity of activated LTRs is unique to transformed B cells compared with other cell types that are known to have active LTRs. Furthermore, we have shown that EBV-induced transformation of B cells leads to expression of many cryptic transcripts, including several that are relevant to lymphoma biology, as well as other cancers types.
Viruses have previously been implicated in the widespread activation of LTRs and long interspersed nuclear elements (LINEs) in hepatocarcinomas, for which tumors with viral etiology have a higher level of LTR and LINE activation (Shukla et al. 2013; Hashimoto et al. 2015; Schauer et al. 2018). Taken together with our data, this suggests that LTR activation is related to the host's response to viruses. The most obvious pathways responsible for LTR activation are those related to immune response to viruses. ERVs have previously been demonstrated to be evolutionarily co-opted by innate immune pathways (Chuong et al. 2016). Our current analysis of transcription factors bound to LTRs in GM12878 cells does find that NF-kB subunits can bind to ∼40% of LTRs, suggesting these LTRs have an important role in regulating immune pathways. It has furthermore been demonstrated that the noncanonical isoform of CSF1R is regulated by an NF-κB binding site at the THE1B element (Lamprecht et al. 2010). Further analysis of the dynamics of transcription factor occupancy and signaling at LTRs across EBV infection time points will be necessary to fully elucidate this issue.
The most common transcription factor found at EBV-activated LTRs is RUNX3, which was bound to ∼67% of activated LTRs. This transcription factor is highly up-regulated by EBV-encoded transcription factors (Spender et al. 2002; Brady et al. 2009). Previously, RUNX3 has been reported to be involved in LINE-1 transcription (Yang et al. 2003). To our knowledge, this is the first report of RUNX3 involved in LTR activation. A recent report indicated that RUNX3 binding can induce site-specific DNA hypomethylation (Suzuki et al. 2017). Taken together with our finding that RUNX3 binds to >50% of all activated LTRs, this suggests EBV-induced RUNX3 binding is important in the hypomethylation of activated LTRs.
EBV-induced transformation of B cells leads to global loss of DNA methylation, similar to what is observed in cancer cells (Hansen et al. 2014). Our results indicate that LTR loci become hypomethylated upon EBV-induced transformation and that a subset of these hypomethylated LTRs can then be transcriptionally activated. We found that DNA hypomethylation is insufficient to transcriptionally activate LTR loci. We furthermore found that many of these activated LTRs are bound by specific transcription factors, indicating that there may be both the need to derepress as well as activate by transcription factor binding. This derepression/activation model has been proposed previously by others (Lamprecht et al. 2010; Babaian and Mager 2016). This model suggests that while DNA hypomethylation can be achieved in different cells, the LTRs that are activated will be unique based upon the transcription factors that are present within the cell. In line with this model and previous data describing cell-type–specific binding of transcription factors at transposons (Xie et al. 2013), our data show that LTR activation is a cell-type–specific behavior.
With the previous observation that a ERVK locus is expressed during EBV infection to promote superantigen expression (Sutkowski et al. 1996, 2001), our finding that there is extensive LTR activation by EBV-induced transformation suggests that LTR activation may be an intrinsic process that the host cell has co-opted. The additional finding that these LTRs can lead to activation of CSF1R and IRF5, two genes important for lymphoma cell survival and proliferation, suggests that activation of LTRs can also have a benefit for the virus in promoting survival of the infected cell. The activation of these two genes important for oncogenesis, however, may lead to negative consequences for the host in the long run.
EBV has long been associated with increased risk of lymphoma (Young et al. 2016). Transcriptomes of lymphoma cells include many LTR-driven cryptic transcripts (Lock et al. 2014; Babaian et al. 2016). Analysis of our transcriptome and chromatin profiles reveals many additional LTR-driven transcripts, including a cryptic isoform of HUWE1/HECTH9. This E3 ubiquitin ligase has previously been shown to be important in regulating the transcriptional activity of MYC and, as such, may have an important role in LCL development as well as in the development of lymphomas related to EBV (Adhikary et al. 2005).
Based on our results, it is important to examine whether the subset of lymphomas that express LTR-driven transcripts, including Hodgkin lymphoma and diffuse large B cell lymphoma (DLBCL) (Lamprecht et al. 2010; Lock et al. 2014), have all been infected by EBV. We preliminarily addressed this by examining cell lines that express the noncanonical isoform of IRF5 (Babaian et al. 2016). We found that this isoform is expressed in both EBV-positive and EBV-negative B cell lymphoma cell lines tested by Babaian and colleagues (Babaian et al. 2016), indicating it is not unique to EBV transformation. We furthermore examined our RNA-sequencing profiles to determine if the cryptic transcripts identified in DLBCL are also expressed in the LCLs. CSF1R and IRF5 were the only common transcripts, indicating that while LTR activation leading to cryptic transcripts occurs in both DLBCL and LCLs, the subset of cryptic transcripts is distinct in each cell type. This suggests that LTR activation does not solely rely upon viral-induced transformation, and that perhaps in the context of lymphoma development, activation of specific cryptic transcripts can occur through other means (other than viral-induced transformation).
Methods
Detailed methods are provided in the Supplemental Material.
Collection of B cells and growth of LCLs
Blood samples from de-identified healthy donors were obtained following institutional guidelines at the City of Hope (IRB no. 17022). B cell population was isolated using Dynabeads CD19 pan B magnetic beads (Invitrogen). Isolated B cells were collected for chromatin immunoprecipitation, DNA isolation, and RNA isolation. LCLs were derived from B cells isolated from primary B cells (from de-identified donors labeled D6, D7, and D9) using EBV collected from a B95-8 strain-containing marmoset cell line (Hui-Yuen et al. 2011). Briefly, B cells were incubated with EBV-containing supernatant, grown for >6 wk, frozen, and regrown to establish continual proliferating cell lines.
ChIP-seq, RNA-seq
Standard ChIP-seq and RNA-seq methods were used, as we have previously reported (Leung et al. 2014; Du et al. 2016). Details of sample preparation, sequencing, data processing, and downstream analysis are included in the Supplemental Materials including custom code (Supplemental_Code.tar.gz). All data were aligned to hg19 for comparison with existing data (Wang et al. 2013; Hansen et al. 2014). A comparison of LTR content in hg19 and hg38 is included in the Supplemental Material.
Transfections and knockdown of RUNX3
siRNA knockdown of RUNX3 transcripts was performed with 1 million lymphoblastoid cells (D7 LCL) according to the manufacturer's protocol (Amaxa) using 50 nM pool of siRNA targeting RUNX3 (Thermo Fisher Scientific, catalog no. AM16708; ID 107390 and 115509) or 50 nM of control siRNA (nontargeting control, Thermo Fisher Scientific). Cells were recovered after transfections and grown for 2 d before collection of RNA analysis. Total RNA was extracted; cDNA was prepared as described above and used for qPCR analysis.
Data access
All new sequencing data generated in this study have been submitted to the NCBI Gene Expression Omnibus (GEO; https://www.ncbi.nlm.nih.gov/geo/) under accession no. GSE106851.
Acknowledgments
This work was supported by the National Institutes of Health, grants K01DK104993 (A.L.) and R01DK112041 and R01CA220693 (D.E.S.). Research reported in this publication included work performed in the Pathology and Integrative Genomics Cores supported by the National Cancer Institute of the National Institutes of Health under award no. P30CA33572. We thank Drs. Sandrine Lacoste and Timothy O'Connor for their helpful assistance with EBV transformation and Drs. Joo Song and John Chan for sharing critical reagents with us.
Footnotes
-
[Supplemental material is available for this article.]
-
Article published online before print. Article, supplemental material, and publication date are at http://www.genome.org/cgi/doi/10.1101/gr.233585.117.
- Received December 12, 2017.
- Accepted October 24, 2018.
This article is distributed exclusively by Cold Spring Harbor Laboratory Press for the first six months after the full-issue publication date (see http://genome.cshlp.org/site/misc/terms.xhtml). After six months, it is available under a Creative Commons License (Attribution-NonCommercial 4.0 International), as described at http://creativecommons.org/licenses/by-nc/4.0/.


