
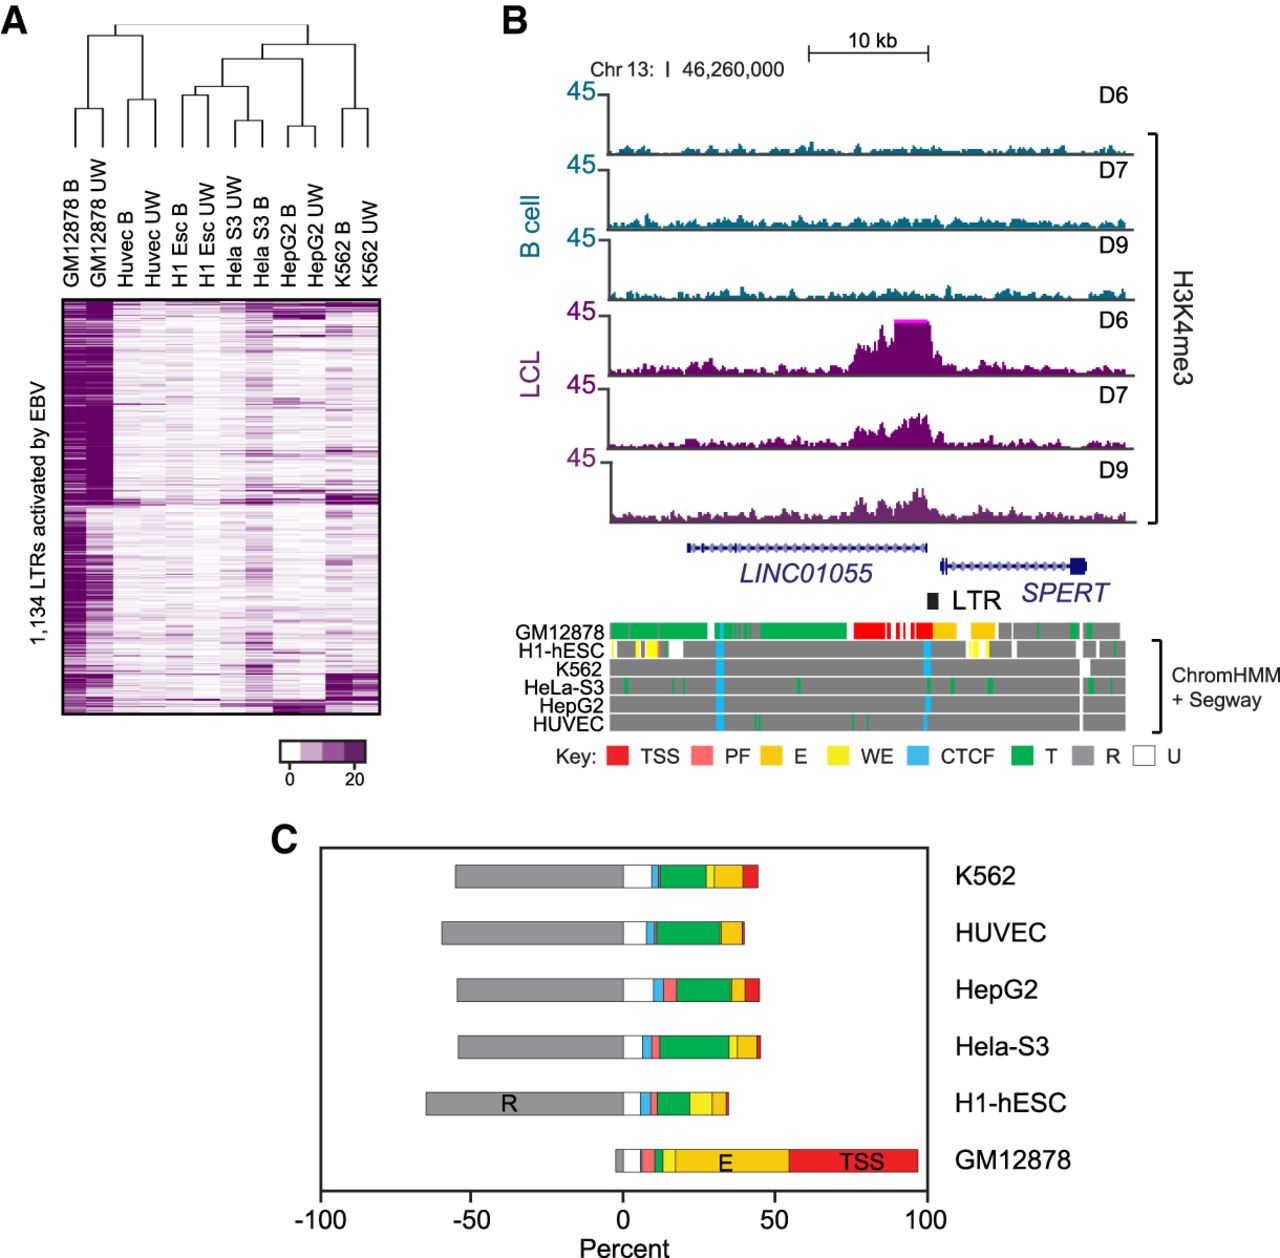
Transcriptional activity of activated LTRs is mostly specific to transformed B cells. (A) Hierarchical clustering of H3K4me3 read counts across cell lines from ENCODE data. (B) Broad; (UW) University of Washington; replicates from different sequencing centers. (B) Genome browser track of H3K4me3 profile in B cells and LCLs, and of ChromHMM + Segway combined data at the LINC01055-SPERT1 locus. (TSS) Predicted promoter region including TSS; (PF) predicted promoter flanking region; (WE) predicted weak enhancer or open chromatin cis regulatory element; (CTCF) CTCF enriched element; (T) predicted transcribed region; (R) predicted repressed or low activity region; and (U) unclassified. (C) ChromHMM + Segway combined classification of all activated LTRs shown as a frequency of total for each ENCODE cell line (color schemes as in B).


