
DDX54 regulates transcriptome dynamics during DNA damage response
- Miha Milek1,
- Koshi Imami1,
- Neelanjan Mukherjee1,
- Francesca De Bortoli2,
- Ulrike Zinnall1,
- Orsalia Hazapis1,
- Christian Trahan3,4,
- Marlene Oeffinger3,4,5,
- Florian Heyd2,
- Uwe Ohler1,6,7,
- Matthias Selbach1,8 and
- Markus Landthaler1,9
- 1Max Delbrück Center for Molecular Medicine in the Helmholtz Association, Berlin Institute for Medical Systems Biology, 13125 Berlin, Germany;
- 2Department of Biology, Chemistry, Pharmacy, Freie Universität Berlin, Institute of Chemistry and Biochemistry, Laboratory of RNA Biochemistry, 14195 Berlin, Germany;
- 3Institut de Recherches Cliniques de Montréal, H2W 1R7 Montréal, Quebec, Canada;
- 4Département de Biochimie, Faculté de Médecine, Université de Montréal, H3A 1A3 Montréal, Quebec, Canada;
- 5Faculty of Medicine, Division of Experimental Medicine, McGill University, H3T 1J4 Montréal, Quebec, Canada;
- 6Institute of Biology, Humboldt-Universität zu Berlin, 10115 Berlin, Germany;
- 7Department of Computer Science, Humboldt-Universität zu Berlin, 10099 Berlin, Germany;
- 8Charite-Universitätsmedizin Berlin, 10115 Berlin, Germany;
- 9IRI Life Sciences, Institute of Biology, Humboldt-Universität zu Berlin, 10115 Berlin, Germany
Abstract
The cellular response to genotoxic stress is mediated by a well-characterized network of DNA surveillance pathways. The contribution of post-transcriptional gene regulatory networks to the DNA damage response (DDR) has not been extensively studied. Here, we systematically identified RNA-binding proteins differentially interacting with polyadenylated transcripts upon exposure of human breast carcinoma cells to ionizing radiation (IR). Interestingly, more than 260 proteins, including many nucleolar proteins, showed increased binding to poly(A)+ RNA in IR-exposed cells. The functional analysis of DDX54, a candidate genotoxic stress responsive RNA helicase, revealed that this protein is an immediate-to-early DDR regulator required for the splicing efficacy of its target IR-induced pre-mRNAs. Upon IR exposure, DDX54 acts by increased interaction with a well-defined class of pre-mRNAs that harbor introns with weak acceptor splice sites, as well as by protein–protein contacts within components of U2 snRNP and spliceosomal B complex, resulting in lower intron retention and higher processing rates of its target transcripts. Because DDX54 promotes survival after exposure to IR, its expression and/or mutation rate may impact DDR-related pathologies. Our work indicates the relevance of many uncharacterized RBPs potentially involved in the DDR.
The DNA damage response (DDR) is a collective term for signal transduction pathways that sense, signal, and repair different types of DNA lesions in eukaryotic cells (Harper and Elledge 2007; Jackson and Bartek 2009). Defects in these processes result in genome instability and may lead to neurological and immunological disorders, premature aging, and cancer progression (Ciccia and Elledge 2010). Immediate-to-early DDR relies on rapid post-translational modifications of DDR factors such as protein kinases, distinct components of repair machinery, and cell cycle regulators (Polo and Jackson 2011). On the cellular level, DDR impacts multiple layers of cell fate decisions from activation of specific DNA repair mechanisms, cell cycle progression/arrest, to apoptotic or senescent phenotypes (Zhou and Elledge 2000). Importantly, a significant fraction of these decisions are mediated by a transcriptional response, which is largely under the control of TP53, a transcription factor that regulates expression of cell cycle regulators such as cyclin-dependent inhibitor protein 1A (CDKN1A/p21), apoptotic proteins (e.g., BAX, BBC3/PUMA), and DNA repair components (Riley et al. 2008; Shkreta and Chabot 2015).
In addition to transcriptional responses, many aspects of RNA metabolism from pre-mRNA processing to mRNA surveillance and translation are altered during DDR (Blasius et al. 2014; Dutertre et al. 2014). The major trans-acting regulators of the RNA lifecycle are RNA-binding proteins (RBPs) whose emerging role has been recognized in many aspects of the DDR (for reviews, see Reinhardt et al. 2011; Lenzken et al. 2013; Dutertre et al. 2014; Naro et al. 2015; Shkreta and Chabot 2015; Kai 2016). Several recent large-scale proteomic studies have reported that RNA processing and translation factors are post-translationally modified by DDR signaling (Matsuoka et al. 2007; Bennetzen et al. 2010; Bensimon et al. 2010; Beli et al. 2012; Jungmichel et al. 2013), and many RBPs are essential for the DDR (Paulsen et al. 2009; Adamson et al. 2012; Boucas et al. 2015). Specifically, some RNA processing factors (EWSR1, THRAP3, RBMX, NONO, HRNPC, YBX1, RBM14) can be either recruited to DSBs, relocalized upon DNA damage and/or directly contribute to DNA repair (Paronetto et al. 2011; Rajesh et al. 2011; Adamson et al. 2012; Beli et al. 2012; Krietsch et al. 2012; Polo et al. 2012; Anantha et al. 2013; Chang et al. 2014; Shkreta and Chabot 2015; Simon et al. 2017), whereas others such as SRSF10 impact alternative splicing of transcripts coding for proteins involved in DNA repair, cell cycle control, and apoptosis (Shkreta et al. 2016). Notably, somatic mutations very often occur in genes encoding RNA splicing factors, thus leading to widespread misregulated splicing events in many tumor types (Sebestyén et al. 2016). DDR also results in rapid nucleolar segregation and/or disruption upon UV or IR exposure (Olson 2004; Boulon et al. 2010). This causes DNA damage–specific relocalization of many nucleolar RBPs including RNA helicases to the nucleoplasm (Andersen et al. 2002, 2005; Moore et al. 2011). However, the impact of relocalized nucleolar RBPs on DNA damage–induced gene expression has not been previously studied.
Results
Binding of a large subset of RBPs is increased upon genotoxic stress induction
In order to systematically identify novel genotoxic stress responsive RBPs, we applied a 4-thiouridine (4sU)-based mRNA interactome capture protocol to human breast adenocarcinoma MCF-7 cells that were exposed to ionizing radiation (Fig. 1A; Baltz et al. 2012; Castello et al. 2012). Pilot experiments indicated that 4sU treatment and UV crosslinking enabled effective enrichment of proteins in MCF-7 oligo(dT) eluates (Supplemental Fig. S1A). Exposure of MCF-7 cells to IR resulted in phosphorylation of histone variant H2AFX (γ-H2AFX), a hallmark of DSB formation (Fig. 1B; Supplemental Fig. S1B), and was not affected by the presence of 4sU and/or UV exposure. We thus used these conditions further for the quantification of the mRNA-bound proteome. For a better comparison between IR-treated and untreated cells, we prepared a calibrator “heavy” SILAC-labeled lysate, which was spiked in prior to the oligo(dT) purification (Fig. 1A). We observed that a higher amount of poly(A)+ RNA-bound proteins was recovered from IR-exposed cells (Fig. 1C; Supplemental Fig. S1C). Quantitative proteomics analysis identified a total of 724 proteins bound to poly(A)+ RNA (Supplemental Table S1) with high correlation of summed peptide intensities between biological replicates (Supplemental Fig. S1D). In addition, the overlap between the proteins identified in both biological replicates was high (Supplemental Fig. S1E), demonstrating reproducibility.
Increased binding of proteins to poly(A)+ RNA upon exposure to ionizing radiation. (A) Outline of oligo(dT) affinity purification using SILAC “heavy” spike-in normalization to detect differential binding of proteins to poly(A)+ RNA. (B) Western analysis of phosphorylated H2AFX upon 4sU treatment, UV, and/or IR exposure in total cell lysates. (C) Silver staining analysis after large-scale oligo(dT) purification. (D) Differential binding analysis of proteins detected in control versus IR-exposed cells with at least 2 unique peptides detected in at least 1 out of 4 MS runs. Mean iBAQ values versus log2-transformed fold changes obtained from normalized intensities are plotted. (E) Western analysis of proteins belonging to increased, decreased/unchanged groups, or non-RNA binders as negative control. (F) Differential expression analysis of protein-coding mRNAs in input oligo(dT) lysates (1 h post 10 Gy IR versus control). MA plot depicts mean normalized read counts versus log2-transformed fold changes. Significantly up-regulated mRNAs (adjusted P-value <0.1) are shown in red. (G) Box plots of expression levels in transcripts per million (TPM) are shown for unchanged and up-regulated mRNAs. (H) Density of log2-transformed fold changes in summed peptide intensities obtained from whole-proteome analysis of IR-exposed (10 Gy, 1 h) and control input lysates. Protein classes were defined based on D and RBP census (Gerstberger et al. 2014). Absolute numbers of whole proteome–quantified proteins are indicated in brackets. (I) Overlap in absolute numbers of proteins with increased binding in this study and two nucleolar proteome data sets. (J) Proteins with unchanged and increased mRNA binding and MCF-7 whole-proteome RBPs were classified according to their RNA target in the RBP census (Gerstberger et al. 2014). Non-RBP census proteins are depicted in yellow. (K) Proteins with unchanged and increased mRNA binding were matched with the nucleolar proteome data set. Nonoverlapping nucleolar proteins were classified as “other.” Box plots of log2-transformed fold changes in nucleolar protein abundance after different time periods post IR exposure (10 Gy) are shown.
In order to quantify the differences in poly(A)+ RNA binding, the measured “light” peptide intensities were normalized using “heavy” intensity (Supplemental Fig. S1F). The majority of proteins (n = 414) showed unchanged binding to poly(A)+ RNA (median 0.39), a very high number of proteins (n = 266) had increased binding (log2-fold change >1, likelihood >0.25, median 2.4), but we observed very few (n = 14) with decreased binding (Fig. 1D). For six previously known RBPs, we successfully confirmed increased or unchanged amounts in oligo(dT) eluates by Western analysis, as well as their unchanged abundance in total cell lysates (Fig. 1E; Supplemental Fig. S1G).
Because increased protein abundance in oligo(dT) eluates may result from the increased amount of poly(A)+ RNA and/or RBP molecule numbers rather than increased RBP binding to mRNA, we quantified mRNA and protein abundance in input lysates under the same conditions. One hour post IR exposure, the vast majority of mRNAs remained constant (Fig. 1F,G), and changes in protein abundance for proteins with increased levels in oligo(dT) eluates were small (Fig. 1H). Therefore, the differences in abundance of oligo(dT)-eluted proteins most likely resulted from differential binding to poly(A)+ RNA.
Many nucleolar proteins exhibit increased binding to polyadenylated transcripts
Although all proteins identified by mRNA interactome capture were highly enriched for RBPs involved in mRNA metabolic processes (Supplemental Fig. S1H), we also found that >45% of proteins with increased poly(A)+ RNA-binding upon IR exposure were previously determined as components of the nucleolar proteome (Fig. 1I; Andersen et al. 2005; Moore et al. 2011). Classification of RBPs according to consensus RNA targets (Gerstberger et al. 2014) revealed that in addition to mRNA-bound proteins, rRNA binders and ribosomal proteins most commonly showed increased binding to poly(A)+ RNA during early DDR (Fig. 1J). Nucleolar RBPs were overrepresented (Supplemental Fig. S1I), including 20 RNA helicases, among which some had previous implications in the DDR, namely DDX5/p68 (Nicol et al. 2013), DDX1 (Li et al. 2008), SLFN11 (Zoppoli et al. 2012; Tian et al. 2014), and DDX3X (Sun et al. 2013).
We thus hypothesized that increased binding of ribosomal proteins and rRNA binders to poly(A)+ RNA reflected the DNA damage–induced disruption of nucleoli (Rubbi and Milner 2003). It was previously shown that upon DNA damage induction or general transcriptional inhibition, nucleolar abundance of many nucleolar proteins is decreased, most likely due to their nucleoplasmic relocalization (Andersen et al. 2005; Moore et al. 2011). Integration of these published data sets with our results revealed that RBPs with increased binding to poly(A)+ RNA showed the highest reduction in nucleolar levels upon IR exposure (Fig. 1K) and actinomycin D treatment (Supplemental Fig. S1J). This suggested nucleoplasmic relocalization of these RBPs, which allowed their binding to poly(A)+ RNA.
In the increased binder class, additional RBPs with involvement in the DDR were identified, such as RBMX (Adamson et al. 2012), EWSR1 (Paronetto et al. 2011), FUS (Wang et al. 2013; Deng et al. 2014; Qiu et al. 2014), and members of the nonhomologous end joining pathway (NHEJ), namely PRKDC, XRCC5, and XRCC6 (Fig. 1J; Jeggo et al. 1995; Gu et al. 1997; Smith and Jackson 1999; Ferguson and Alt 2001). In addition, we identified proteins that were not previously identified as RNA-binding and likely represent a set of novel candidate RBPs. Interestingly, these include proteins with previous links to DNA repair such as RECQL4 (Singh et al. 2010), PARP14 (Nicolae et al. 2015), CHD4 (O'Shaughnessy and Hendrich 2013), and ASCC3 (Fig. 1J; Dango et al. 2011; Williamson et al. 2017). Our data set of 266 proteins with increased binding to poly(A)+ RNA upon genotoxic stress provides a catalog (Supplemental Table S1) of candidate trans-acting DDR factors and highlights the importance of RBPs in the DDR.
RNA binding characteristics of a genotoxic stress-responsive RNA helicase DDX54
We next focused on DDX54, a DEAD-box RNA helicase with ∼30-fold increased mRNA binding upon IR (Fig. 1D), which was previously implicated in nuclear receptor activation (Rajendran et al. 2003; Kanno et al. 2012). To assess direct effects of DDX54 on gene expression, we first determined its transcriptome-wide RNA-binding characteristics. We stably expressed FLAG/HA- and RFP-tagged DDX54 in MCF-7 Flp-In cells (Supplemental Fig. S2A,B), which predominantly localized to the nucleolus (Supplemental Fig. S2D,E), as also observed for the endogenous protein (Supplemental Fig. S2C). Upon IR exposure, nucleoplasmic relocalization of RFP-DDX54 was evident as early as 1 h post IR, confirming partial exit from the nucleoli (Supplemental Fig. S2F).
FLAG/HA-DDX54 effectively crosslinked to 4sU-RNA (Fig. 2A) and PAR-CLIP (Hafner et al. 2010) was carried out under untreated and IR-exposed conditions (10 Gy, 1 h post IR), revealing more than 1 million diagnostic T-C transition events (Supplemental Fig. S2H; Supplemental Table S2) with good reproducibility (Supplemental Fig. S2G). Distribution of T-C crosslinking events within transcript regions showed that DDX54 binds a diverse set of RNAs, with a large portion mapping to pre-rRNA and rRNA sequences (Fig. 2B), as expected for a nucleolar RNA helicase. Upon actinomycin D treatment, which caused nearly complete relocalization of DDX54 to the nucleoplasm (Supplemental Fig. S2E), a decreased number of T-C transitions in pre-rRNA internal transcribed spacers (ITS) was observed (Supplemental Fig. S3A), demonstrating specificity of DDX54-RNA contacts. Although the majority of DDX54 crosslinks along the transcribed rDNA locus were located in the mature 28S rRNA sequence, one prominent site was present in the 5′ ETS located just upstream of the A0 cleavage site. In light of the previous findings (Burger et al. 2000; Tafforeau et al. 2013), this indicated a potential role for DDX54 in pre-rRNA processing. We thus analyzed the abundance of several pre-rRNA intermediates by Northern blotting and observed that DDX54 knockdown results in slightly lower abundance of 43S and 26S and a concomitant accumulation of 30S pre-rRNA, suggesting a potential A0 cleavage effect impacting the early stages of 18S rRNA maturation (Supplemental Fig. S3B).
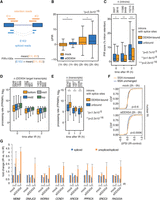
PAR-CLIP reveals differences in binding of DDX54 to acceptor splice sites. (A) FLAG/HA-DDX54 MCF-7 Flp-In cells were exposed to UV 254 nm (0.2 J/cm2) or labeled with 4sU (200 µM, 16 h) and irradiated with UV 365 nm (0.2 J/cm2). Immunoprecipitated protein–RNA complexes were radiolabeled and resolved by SDS-PAGE. The lower panel shows Western analysis of the same nitrocellulose membrane. (B) Distribution of DDX54 PAR-CLIP T-C transition events in control and IR-exposed cells (total numbers given in parentheses). (C) (Top panel) Average normalized T-C transitions events at each uridine position in 1705 introns (corresponding to 518 transcripts) displayed 50 nt upstream of and downstream from splice sites. The identical set of introns was analyzed for both control and IR-exposed conditions. (Bottom two panels) Heatmaps of normalized T-C transition events around splice sites presented in the top panel. (D) Bubble plot depicting the differential contribution and importance of features to classification of DDX54-bound and unbound introns. Three types of features were used: (css) canonical splicing signals; (esr) exonic regulatory elements; (phys) physical features. The differences (DDX54-bound and unbound) in mean decrease in model accuracy for each class (y-axis) were plotted against the t-statistic of the difference in means between intron classes (DDX54-bound and unbound). The circle size corresponds to the mean decrease in the Gini coefficient, representing the importance of that feature for the classification. (E) Comparison of intron length, upstream exonic splicing enhancer (ESE) density, and 3′ splice site strength between DDX54-bound and unbound introns. Significance was assessed by the Kolmogorov-Smirnov (K-S) test: (*) P < 2.2 × 10⁻¹⁶. (F) Average probabilities of nucleotides being unpaired in the regions of 40 nt upstream of and downstream from 3′ splice sites for DDX54-bound and unbound introns. Light gray shaded areas denote significantly different base-pairing probabilities between the two groups (P < 10−4, K-S test). (G) GO enrichment analysis of genes containing DDX54-bound introns. Top five “biological function” categories are shown ranked by Benjamini-Hochberg adjusted P-value (Benjamini and Hochberg 1995). (H) Density of relative positions of introns within transcripts (distance from the 5′ end of intron to transcription start site, TSS) for unbound versus DDX54-bound introns shown in C. Median relative positions are given above the plot. (I) Enrichment of 7-mers in exonic DDX54 binding sites. The top 10 enriched 7-mers are denoted in orange. (J) Average number of T-C transition events at positions relative to centers of exons, which are upstream of (top) or downstream from (bottom) introns shown in C.
Increased binding of DDX54 to weak 3′ splice sites upon IR exposure
In addition to pre-rRNA crosslinks, more than half of DDX54-RNA contacts mapped to exonic and intronic sequences (Fig. 2B) from more than 10,000 DDX54 target transcripts, which showed high overlaps between replicates and conditions (Supplemental Fig. S4A,B). Because this indicated that DDX54 also abundantly binds to pre-mRNAs, we reasoned that DDX54 may regulate gene expression during transcription, splicing, and/or nuclear decay.
We next examined DDX54 binding patterns around donor and acceptor splice sites (Fig. 2C) and found that DDX54-RNA contacts were abundantly present in a narrow region of approximately 10 nt downstream from and upstream of donor and acceptor splice sites, respectively. Comparison between DDX54 PAR-CLIP libraries obtained from control and IR-exposed cells revealed increased binding of DDX54 upon IR exposure at the acceptor splice sites (Fig. 2C; Supplemental Fig. S4C). Similarly, analysis of differential T-C transition events in DDX54 binding sites revealed regions with increased binding upon IR exposure (Supplemental Fig. S4D).
To investigate potential splicing mechanisms specific to DDX54 pre-mRNA interactions, we compared two groups of introns with differing DDX54 binding status, namely DDX54-bound introns, which showed increased binding upon IR, and a similar number of DDX54-unbound introns. We were able to accurately discriminate between the two groups using a random forest classifier trained on 16 features (auROC = 0.95) (Fig. 2D; Supplemental Fig. S4E; Supplemental Table S3). We found that DDX54-bound introns contained significantly weaker 3′ splice sites than unbound introns, were much shorter, and were flanked by exons with a higher density of exonic splicing enhancer (ESE) motifs (Fig. 2E).
DDX54 has been known to have in vitro ATPase activity (Rajendran et al. 2003), but its ability to unwind RNA secondary structures had not been tested. We thus used our PAR-CLIP data in combination with in silico folding to gain insight into the pairing probabilities around DDX54 crosslinking sites. We observed that DDX54 preferentially crosslinks 0–5 nt upstream of regions with a high probability of local secondary structure (Supplemental Fig. S4F). Comparison of in silico folded regions immediately upstream of and downstream from 3′ acceptor splice sites between introns classified according to DDX54 binding preference revealed that the nucleotides up to 20 nt upstream of the splice site are more likely to contain secondary structure in the case of DDX54-bound introns (Fig. 2F). These sites corresponded to the region with increased DDX54 binding upon IR exposure (Fig. 2C), suggesting that DDX54 might unwind secondary structures located in the immediate vicinity of acceptor splice sites.
Interestingly, DDX54-bound introns were present in pre-mRNAs coding for proteins with a core function in splicing (SNRNP200, SF3B2), chromosome reorganization (SET, CHD1), cell cycle (CDKN1A, MDM2), and less significantly, in RNP complex biogenesis, which included transcripts coding for ribosomal proteins and ribosome biogenesis factors (Fig. 2G). In addition, we found that for >50% of DDX54-bound introns, DDX54 binds to more than one intron per gene (Supplemental Fig. S4G). DDX54-bound introns were also more likely to be closer to the 3′ end of transcripts (Fig. 2H), a feature previously observed for retained (also termed detained) introns (RI) (Boutz et al. 2015). Therefore, increased binding of DDX54 is most pronounced for a specific subset of introns, suggesting that they belong to a subclass that is regulated by DDX54 during DDR.
We next assessed DDX54 binding to exons and found that the average DDX54 crosslinking signal slightly decreased at exon centers upon IR exposure (Fig. 2J). This might suggest that upon IR exposure, DDX54 is triggered to contact intronic regions close to splice sites with a concomitant reduction of binding in exons. Most enriched 7-mers in DDX54 exonic binding sites were found to be AAGAAGA and AGAAGAA (Fig. 2I). AG-rich binding motifs have been previously observed for SRSF1 and SRSF10 (Ray et al. 2013), and the heptamer AAGAAGA is frequently present in exonic splicing enhancer (ESE) motifs in human genes (Tacke and Manley 1995; Mersch et al. 2008), indicating that DDX54 binds to or close to the ESEs. This result was further supported by the distribution of ESE motifs, which corresponded to the AAGAAGA heptamer distribution within exons (Supplemental Fig. S4H,I).
A smaller fraction of T-C transition events that mapped to nuclear ncRNAs including U1, U2, and U4 snRNAs was also detected (Supplemental Fig. S4J). Among them, the most prominent changes in the distribution of crosslinking sites upon IR exposure were detected for U2 snRNA. Rearrangements of DDX54 contacts were observed in stem loops I and IIb (Supplemental Fig. S4K), suggesting dynamic interactions of DDX54 with the U2 snRNP. Collectively, these results indicated a regulatory role of DDX54 in the splicing of nascent transcripts induced in response to genotoxic stress.
DDX54 interacts with core and associated spliceosomal proteins
To gain insight in DDX54–protein interactions, we next performed proximity-dependent biotinylation (BioID) assays coupled to MS (Supplemental Fig. S5A–C; Supplemental Table S4). We found that a high number of proteins (104) that constitute or are associated with the spliceosome (Hegele et al. 2012) were enriched in streptavidin-purified fractions obtained from lysates of cells expressing BirA/FLAG-DDX54 (Fig. 3A). Specifically, we detected proteins that constitute the spliceosomal complexes B and C (Fig. 3B; Supplemental Fig. S6), U2 snRNP, and related proteins (e.g., CDC40, DDX41, SF3A1, DDX42, U2AF1). Comparison of changes in the enrichment of DDX54 BioID-detected proteins between IR-exposed and control cells showed that some spliceosomal and spliceosome-associated proteins slightly increased their DDX54 interaction upon IR exposure (Fig. 3C). To confirm these increases in direct protein–protein interactions, we performed anti-FLAG-DDX54 co-immunoprecipitation (co-IP) experiments in the absence or presence of different RNase amounts (Supplemental Fig. S5D). Increased interactions of DDX54 upon IR exposure with specific proteins that constitute U2 snRNP (SF3B1, DDX42, U2AF1, DHX8), spliceosomal B (CDC40), and C complexes (DDX41) were confirmed (Fig. 3D), whereas a noninteracting protein (HNRNPH1) could not be detected. These results support the increased interaction of DDX54 with spliceosomal complexes B, C, and U2 snRNP upon IR.
DDX54 interacts with core spliceosomal and spliceosome-associated proteins. (A) Scatter plot of log2-transformed fold enrichment values for proteins with at least two unique peptides detected in each replicate of the BirA/FLAG-DDX54 BioID proximity-dependent biotinylation experiments. Ribosomal and spliceosomal/spliceosome-associated proteins are denoted in blue and orange, respectively. Gray dashed lines denote enrichment of twofold. (B) Heatmap of log2-transformed fold enrichment values in control and IR-exposed (10 Gy, 3.5 h) cells for a subset of BioID-detected proteins categorized by spliceosomal subcomplexes according to Hegele et al. (2012). Heatmap with protein names is available in Supplemental Figure S6. (C) Density of log2-transformed enrichment values for enriched core spliceosomal and spliceosome-associated proteins (log2 enrichment >1) in IR-exposed (10 Gy, 3.5 h) and control cells (K-S test P-value). (D) Anti-FLAG co-IP validation experiments were performed on cell lysates obtained from FLAG/HA-DDX54 MCF-7 cells after IR exposure (10 Gy, 1 h) in the absence (−) or presence of low (+), intermediate (++), and high (+++) RNase T1 concentration. Western analysis of input lysates and immunoprecipitates (IP) is shown. (*) Unspecific band.
DDX54 is required for expression of genotoxic stress-responsive transcripts and proteins
We next hypothesized that increased binding of DDX54 to 3′ splice sites and interaction with RNA and protein components of the spliceosome might represent hallmarks of DDX54-controlled gene regulatory mechanism by influencing the processing rates of pre-mRNAs coding for proteins with a functional role in the DDR. We thus sought to evaluate the dynamics of the transcriptome response to genotoxic stress in the presence and absence of DDX54 (Supplemental Fig. S7A–C).
Quantification of mRNA abundance by mRNA-seq (Supplemental Fig. S7A) revealed that more than 2300 transcripts were significantly up-regulated 6 h after IR exposure in mock-transfected cells (Fig. 4A,B; Supplemental Fig. S7D). However, up-regulation of many transcripts, including DNA damage–responsive transcripts coding for proteins required for different mechanisms of DNA repair, signaling, and cell death responses (Supplemental Fig. S8), such as BRCA2 (Chen et al. 1998; Xia et al. 2001), was not observed in siDDX54-transfected cells (Fig. 4A; Supplemental Fig. S7D). Interestingly, most prominently affected DDR-related transcripts were encoded by target genes of TP53 (Fig. 4B; Supplemental Fig. S8).
DDX54 is required for the maturation of DNA damage–induced mRNAs via a post-transcriptional mechanism. (A) Heatmap of log2-transformed fold changes (IR versus control) obtained from mRNA-seq data in mock- and siDDX54-treated cells after indicated time periods post IR exposure. (B) Bar plots of log2-transformed fold changes (IR versus control) for a selection of the most differentially expressed (absolute log2-fold changes >1 after 6 h) TP53 target genes in mRNA-seq data. The full set is shown in Supplemental Figure S8. (C) Differential primary transcript (pre-mRNA) and mature transcript (mRNA) expression analysis between IR-exposed and control MCF-7 cells that were either mock- or siDDX54-transfected. The numbers of up-regulated transcripts are indicated in the upper right corners. (D) Comparison of 4sU-Seq log2-transformed fold changes (2 h, 10 Gy IR versus control) for transcripts classified based on either presence or absence of the two top-ranking 7-mers (AGAAGAA, AAGAAGA) in DDX54 binding sites. Median log2-fold changes for both classes are given. (E) Changes in protein synthesis upon IR exposure were measured by pSILAC. Scatter plot of log2-transformed mean H/M ratios for mock and siDDX54 conditions obtained from three replicates of pSILAC experiment. The slope of the linear fit (orange) is shown. Dotted line denotes perfect fit (slope = 1). (F) Box plot of differences in protein synthesis between mock-transfected and DDX54-depleted cells. For proteins with increased synthesis upon IR (H/M ratio >1), the ΔH/M ratios between mock and siDDX54 conditions were computed. The absolute number of proteins encoded by transcripts containing either DDX54-bound or unbound introns, or other proteins with no DDX54 binding information, are shown. A Wilcoxon rank-sum test was used for between-group comparisons.
To gain a deeper understanding of the relationship between primary and mature transcript expression dynamics, we performed 4sU-Seq (Supplemental Fig. S7B,E–G), an approach to enrich and quantify newly transcribed RNA (Rabani et al. 2011; Windhager et al. 2012). By measuring both primary and mature transcript abundances (Supplemental Fig. S7F; Supplemental Table S5), we detected prominent global changes in both pre-mRNA and mRNA levels after IR exposure (Fig. 4C). Although in DDX54-depleted cells the dramatic up-regulation of pre-mRNA levels was also observed, a much more modest increase in mRNA levels, and dramatically lower number of significantly up-regulated mRNAs compared to mock-treated cells (6602 versus 12), was detected (Fig. 4C). In addition, we compared the fold changes upon IR for transcripts either lacking or containing one or more enriched DDX54 7-mers (Fig. 4D) as determined by PAR-CLIP (Fig. 2I). In contrast to mock-transfected cells, we observed an increase in fold changes upon IR for pre-mRNAs containing the 7-mers in DDX54-depleted cells. Conversely, in DDX54-depleted cells, no difference in changes in mRNA abundance was observed between transcripts with or without DDX54 binding motifs, but a clear increase was observed in mock-transfected cells, indicating the DDX54-dependent pre-mRNA processing defect in response to IR.
We next quantified changes in protein synthesis upon IR exposure in both mock-transfected and DDX54-depleted cells (Supplemental Fig. S7H,I; Supplemental Table S6) using pulsed stable isotope labeling by amino acids in cell culture (pSILAC) (Schwanhäusser et al. 2009). Upon IR exposure, a general decrease in protein synthesis was observed in DDX54-depleted cells reflected by generally lower SILAC ratios compared to the mock condition (Fig. 4E). Proteins encoded by transcripts that contained introns bound by DDX54 showed significantly higher differences in SILAC ratios between mock-transfected and DDX54-depleted cells than other proteins encoded by transcripts with introns lacking DDX54 binding (Fig. 4F). DDX54 is thus required for expression of its DDR-responsive target transcripts on both the mRNA and protein levels.
DDX54 binding prevents intron retention and enhances pre-mRNA processing rate
Because our findings revealed a binding preference of DDX54 toward weak 3′ splice sites, we hypothesized that global effects of DDX54 depletion on the abundance of mature transcripts and protein levels may be a result of enhancement of pre-mRNA splicing. Differential analysis of alternative splicing events revealed that the highest percentage of differential events 2 h post IR exposure belonged to the retained intron (RI) class, which further increased up to 25% upon DDX54 knockdown (Supplemental Fig. S9A). Analysis using “percent intron retention” (PIR) scores also revealed a general increase in intron retention 2 h post IR (Fig. 5A,B; Supplemental Table S7), as expected after DNA damage induction (Boutz et al. 2015). In addition, PIR scores were significantly lower for DDX54-bound introns compared to unbound introns (Fig. 5C). Moreover, introns in the top DDX54 target transcripts showed the lowest PIR scores, suggesting that DDX54 binding promotes splicing of its target transcripts (Supplemental Fig. S9B). Validation of several DDX54-bound RI events by RT-PCR (Fig. 5G; Supplemental Fig. S9H,I) showed that the ratios between unspliced versus spliced isoforms are generally most highly increased upon DDX54 knockdown and IR exposure, exceeding those in mock-transfected cells. Therefore, DDX54 is required for processing of these RI-containing pre-mRNAs that have to be efficiently spliced upon DNA damage induction.
DDX54 prevents IR-induced intron retention by increasing pre-mRNA processing rates of its target transcripts. (A) Intron retention quantification by percent intron retention (PIR) scores. (B) Box plots of ΔPIR values (IR, control) obtained from 4sU-Seq data. K-S tests were used for comparison. (C) Box plot of PIR scores after different time points post IR exposure (10 Gy). Introns with at least five T-C transition events per exon–intron–exon pair were considered as DDX54-bound, and the rest as unbound. The numbers of introns per group are given above the plots. K-S tests were used for comparisons. (D) Box plot of processing rates obtained after different time periods after IR exposure (10 Gy). Transcripts were categorized according to the number of T-C transitions, and group sizes are indicated above the graph. (E) Box plots of processing rates for transcripts with at least five T-C transition events per exon–intron–exon pair (DDX54-bound) or all other transcripts (unbound). (F) Comparison between spliceostatin A (SSA) and DDX54-regulated retained intron events. Introns with increased retention (adjusted P < 0.05, ΔPSI > 0.05) or unchanged (adjusted P > 0.05, absolute ΔPSI < 0.05) upon SSA treatment in the nucleus were identified by SUPPA. Distributions of ΔPSI values (IR, control) were compared for mock and siDDX54 conditions (Wilcoxon rank-sum tests). For the set of cytoplasmic RI, see Supplemental Figure S9D. (G) RT-PCR analysis of unspliced and spliced isoforms in newly synthesized RNA extracted from mock- or siDDX54-transfected cells that were either IR-exposed (10 Gy, 2 h) or untreated. Mean fold changes in spliced abundances and unspliced/spliced ratios and standard deviations from two determinations were plotted.
We next computed pre-mRNA processing, synthesis, and degradation rates upon DNA damage induction in mock- and siDDX54-treated cells (Supplemental Fig. S9G; Supplemental Table S8). A general decrease in processing rates upon IR exposure was observed (Supplemental Fig. S9G) with the top DDX54 transcripts and DDX54-bound intron transcripts displaying higher processing rates (Fig. 5D,E). Correspondingly, processing rates upon IR exposure were higher in mock- compared to siDDX54-treated cells (Supplemental Fig. S9C), confirming that DDX54 depletion significantly decreased the processing rate.
Because we found that DDX54 negatively regulates intron retention, we sought to obtain mechanistic insights into pre-mRNA splicing efficacy. We thus examined whether the effects of DDX54 knockdown resemble those caused by splicing inhibition via spliceostatin A (SSA) (Kaida et al. 2007) that targets SF3B1, a U2 snRNP subcomplex protein (Wang et al. 1998). Introns with increased retention upon SSA treatment of HeLa cells (Yoshimoto et al. 2017) also showed higher retention upon IR exposure in DDX54-depleted cells (Fig. 5F; Supplemental Fig. S9D). Similarly, introns with increased retention in the mutant compared to wild-type SF3B1 K562 cell line (Kesarwani et al. 2016) or in SF3B1-depleted compared to mock-transfected HeLa cells (Kfir et al. 2015) showed higher retention upon IR exposure and DDX54 knockdown (Supplemental Fig. S9E,F). Therefore, DDX54 binding at the acceptor splice sites upon IR exposure enhances the efficacy of U2 snRNP-mediated intron excision, which is counteracted by the effects of SSA treatment, SF3B1 depletion, or SF3B1 K700E mutant expression.
To validate our findings, we performed in vitro splicing assays (Fig. 6A) by incubating a splicing-competent HeLa cell lysate with two minigene variants of pre-mRNA substrates with different strengths of 3′ acceptor splice sites and followed the abundances of unspliced and spliced RNA transcripts. In the case of the minigene encoding the transcript with a weak 3′ splice site, an increase in the fold change of the ratio between spliced and unspliced RNA was observed when purified recombinant DDX54-FLAG/HA (Supplemental Fig. S10A) was present in the reaction mix (Fig. 6A). This effect was absent in the case of a strong 3′ splice site, confirming the effect of DDX54 on the enhancement of the splicing reaction for introns containing weak 3′ splice sites.
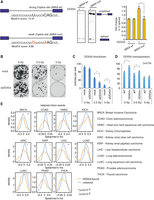
DDX54 affects in vitro splicing efficacy of weak splice site–containing transcripts, promotes cell survival, and impacts splicing of retained introns in tumor tissues. (A) A schematic of minigenes (MINX wt and mut) used for in vitro splicing assays and differing splice site strengths (left). Representative images of PAGE analysis are shown (center). Bar graph of fold changes in the percentage of PCR product corresponding to spliced versus total transcript (right). Values represent the means of two independent experiments ± standard deviations (Student's t test, * P < 0.05). (B) Representative colony formation assay of MCF-7 Flp-In cells exposed to the indicated IR doses. (C,D) Quantification of colony formation assays upon DDX54 knockdown (C) or FLAG-HA/DDX54 overexpression (D). Colonies were counted, and mean counts and standard deviations were obtained from three independent experiments (Student's t test): (*) P < 0.05. (E) Retained intron events in 11 TCGA data sets were classified as DDX54-bound or unbound according to PAR-CLIP data. Spearman correlation coefficients between expression Z-scores and PSI values in normal and tumor samples were computed, and their distributions were compared (K-S test) between DDX54-bound and unbound retained introns.
DDX54 is a stress responsive DEAD-box RNA helicase that promotes cell survival
We next used clonogenic assays to compare cell survival after exposure to different IR dosages (Fig. 6B). DDX54 knockdown resulted in a significantly lower number of clones compared to mock-treated cells (Fig. 6C). On the other hand, overexpression of DDX54 led to a higher cell survival both in the absence or presence of DNA damage induction (Fig. 6D). These results suggest that DDX54 promotes cell survival upon DNA damage.
As a potent regulator of the gene expression during the DDR, DDX54 has the potential to be important for tumor biology. To address this, we analyzed The Cancer Genome Atlas (TCGA) mRNA-seq data (Sebestyén et al. 2016) from 11 solid tumor types and found that DDX54 expression was elevated in nine of them (Supplemental Fig. S10B), suggesting its potential role as a novel tumor marker. Next, we addressed the effects of DDX54 expression on alternative splicing changes in these tumors by classifying the DDX54-bound and unbound alternatively spliced events based on our PAR-CLIP data. Significantly lower Spearman coefficients were observed for DDX54-bound compared to unbound retained introns in nine of 11 tumor tissues, indicating that higher DDX54 expression in tumor tissues anti-correlates with intron retention (Fig. 6E). This result and findings of an alternative approach (Supplemental Fig. S10C,D) confirm conclusions obtained from MCF-7 breast carcinoma cells and stress the potential importance of effective retained intron processing by DDX54 in many cancer types.
Discussion
Recognition of the importance of RBPs for the DDR has increased in recent years (Lenzken et al. 2013; Dutertre et al. 2014; Naro et al. 2015; Shkreta and Chabot 2015; Kai 2016). Using differential quantification of the poly(A)+ RNA–protein interactome, we identified more than 260 RBPs that displayed increased binding activity to polyadenylated transcripts upon induction of DSBs in cultured human breast cancer cells. Strikingly, almost half of those were components of the nucleolus, a membraneless organelle with a dynamic role in the induction of various stress responses (Olson 2004; Boulon et al. 2010). Nucleoli may also be viewed as stress-responsive RNP bodies with subcompartmental structure (Feric et al. 2016), which upon induction of DNA damage, provide a hub for establishing new protein–RNA interactions between relocalized RBPs and nucleoplasmic and/or chromatin-associated RNAs (Boulon et al. 2010). These events could lead to novel functional protein–RNA interactions upon DSB induction, resulting in regulation of gene expression programs, which impact the DDR.
To address this question, we studied the effects of a nucleolar RNA helicase DDX54 on gene expression during DDR by addressing its RNA-binding and regulatory function. PAR-CLIP analysis demonstrated that DDX54 not only binds to pre-rRNA but also to intronic and exonic sequences of protein-coding transcripts, indicating its widespread interaction with pre-mRNA. On one hand, this result was unexpected for a nucleolar RNA helicase, because such proteins predominantly interact with nuclear ncRNAs, but very little with (pre-)mRNA, as evident in the case of DDX21 (Calo et al. 2015). However, our PAR-CLIP results confirmed that DDX54 is indeed a strong poly(A)+ RNA binder, as expected for an RBP detected in our initial proteomics experiment that applied oligo(dT) affinity purification. A closer look at the differences in DDX54 binding characteristics upon IR exposure revealed higher DDX54 occupancy on acceptor splice sites and a concomitant decrease in downstream exon binding, which might indicate movement of DDX54 from the exon centers to the acceptor splice sites but warrants further study. Interestingly, those two features are known binding characteristics of major splicing regulators, U2AF1/U2AF2 (Shao et al. 2014) and SRSF1/SRSF2 (Pandit et al. 2013), respectively. Identification of proteins in the proximity of DDX54 confirmed that DDX54 interacts with core spliceosomal and spliceosome-associated proteins, including U2AF1, components of U2 snRNP, and complex B/C protein family.
As expected, we found that the impact of DDX54 on the transcriptome during the DDR was extensive, because the typical induction of the majority of DDR-responsive transcripts was prevented upon DDX54 knockdown. In addition, the effect of DDX54 on its target transcripts was predominantly post-transcriptional. Because of these results and changes in binding preferences determined by PAR-CLIP, we evaluated the role of DDX54 in splicing regulation. Several recent studies have shown that a large fraction of expressed polyadenylated transcripts contain retained introns, for example, during the differentiation of mouse embryonic stem cells into neurons (Braunschweig et al. 2014) and upon stress induction by DNA damage (Boutz et al. 2015) or heat shock (Shalgi et al. 2014). We found that DDX54-bound introns were more effectively spliced in response to IR and resided in transcripts that display higher processing rates than unbound pre-mRNAs. In fact, DDX54 increased the splicing efficacy of a transcript harboring a weak splice site in an in vitro splicing assay, recapitulating our in vivo findings, and signified the role of DDX54 as a splicing enhancer protein that is able to speed up processing and expression of important DDR factors. We speculate that this function of DDX54 is likely triggered by its partial nucleoplasmic relocalization upon DNA damage induction and/or by phosphorylation, a known post-translational modification of several RNA helicases (Sun et al. 2011; Cruciat et al. 2013; Lauinger et al. 2014; Alessi et al. 2015).
Gene expression profiling by 4sU-Seq also revealed that changes in newly synthesized RNA upon IR exposure are extensive, indicating that the transcriptional response is global not only upon UV irradiation (Boeing et al. 2016) but also upon DSB formation. Nevertheless, to establish effective DDR, a timely expression of subset of transcripts that code for DNA repair, signaling, cell cycle, and cell survival factors, is necessary. Given that the transcriptional induction following IR occurs for the majority of expressed transcripts, a mechanism for speeding up the processing of a specific subset of the transcriptome must exist. In fact, the specific increase in DDX54 binding was observed in introns that were short and harbored weak 3′ splice sites, representing the signature of DDX54-regulated pre-mRNAs. The predisposition of slow splicing rate in these introns is counteracted by DDX54 binding to the acceptor splice sites, which facilitates an increase in the splicing rate of these introns, most likely through the interactions with the components of the core spliceosome (U2 snRNP) and spliceosome-associated factors.
In conclusion, our study defines a large number of candidate RBPs that may act as regulators of DNA damage response. Although the vast majority of them remain functionally unexplored in the context of the DDR, our data suggest the potential importance of RBPs and their targets for tumor biology. On the example of DDX54, we demonstrated the widespread influence of one nucleolar protein on the transcriptome-wide changes induced after DSB formation. DDX54-mediated regulation of splicing rates via interactions with core spliceosome components represents a novel mechanism of gene expression regulation during the DNA damage response and adds to the growing evidence of the importance of splicing factors as well as RNA helicases in the DDR. In the future, novel insights into mechanistic aspects of gene expression regulation during DDR as well as implications for tumor biology in the form of novel biomarkers will be explored.
Methods
Cell culture, plasmids, and transfection
Unless stated otherwise, HEK293 Flp-In T-REx (Thermo Fisher Scientific), MCF-7 (ATCC, HTB-22), and MCF-7 Flp-In (Slobodin et al. 2017) cell lines were cultured in standard Dulbeco's modified Eagle's medium (DMEM) formulation. IR exposure was performed using a cesium-137 γ-ray source. Vector constructs encoding FLAG/HA-DDX54, RFP-DDX54, BirA-FLAG-DDX54, and DDX54-FLAG/HA have been submitted to Addgene. Stable MCF-7 Flp-In and HEK293 Flp-In T-REx cell lines were generated by hygromycin selection. Further details on plasmids and stable cell lines are provided in Supplemental Methods.
Isolation of proteins differentially bound to poly(A)+ RNA
MCF-7 cells were grown in a label-free DMEM formulation and treated with 200 µM 4-thiouridine (4sU, ChemGenes) for 16 h, followed by IR exposure (10 Gy) or no treatment. One hour after IR exposure, the cells were UV crosslinked (365 nm, 0.2 J/cm2) and lysed in lysis/binding buffer (Baltz et al. 2012). To obtain SILAC “heavy” labeled cell extracts, HEK293 Flp-In T-REx cells were grown in high glucose SILAC DMEM (PAA, E15-086) supplemented with 10% (v/v) dialyzed fetal bovine serum (Sigma Aldrich), 2 mM L-glutamine, 100 U/mL penicillin/streptomycin (both from Thermo Fisher Scientific), 0.398 mM 13C6,15N2 L-arginine, and 0.798 mM 13C6,15N2 L-lysine (Cambridge Isotope Laboratories) for at least seven passages. Cells were then 4sU-treated and crosslinked as described above. Cell lysates prepared from MCF-7 label-free cells were mixed with equal volumes of SILAC “heavy” HEK293 lysates, and oligo(dT) affinity purification was performed as previously described (Baltz et al. 2012). Details are provided in Supplemental Methods. Protein–RNA complexes were heat-eluted at 80°C in 10 mM Tris[pH 7.5]. RNA was removed by treatment with RNase I (Thermo Fisher Scientific) and benzonase (Merck), and proteins were concentrated with an Amicon filter device (Millipore UFC901024).
Mass spectrometry and data processing
Proteins were precipitated, digested to peptides, and analyzed by liquid chromatography-tandem mass spectrometry (LC-MS/MS) as described elsewhere (Wessels et al. 2016). All raw data were analyzed and processed by MaxQuant (v1.3.0.5 or 1.5.1.2) (Cox and Mann 2008). Details are given in Supplemental Methods. To call proteins with differential binding to poly(A)+ RNA, we used baySeq (Hardcastle and Kelly 2010). Only the proteins with two or more unique peptide counts were considered. We used summed “heavy” peptide intensity values from MaxQuant output to estimate normalization factors using getLibsizes function with the quantile option. We considered proteins with a likelihood greater than 0.25 and an absolute log2-transformed fold change of more than 1 to be differentially bound to poly(A)+ RNA. Gene Ontology enrichment analyses were performed using DAVID (Huang da et al. 2009).
Immunostaining, microscopy, and Western analysis
Cells were exposed to actinomycin D, UVC, or IR at indicated conditions, fixed and permeabilized. After blocking, primary antibody incubations (Supplemental Table S9) were performed for 3 h or overnight at 4°C. Next, incubation with secondary anti-mouse IgG, conjugated to Alexa-488 (Thermo Fisher Scientific) was performed, followed by staining with Hoechst 33342. Images were acquired on a Zeiss Axio Observer Z1 or a KEYENCE BZ-X710 microscope. Details are given in Supplemental Methods. For Western blotting analysis of poly(A)+ RNA-bound proteins in MCF-7 cells, oligo(dT) purifications were performed as described above. Western analysis was performed using primary antibodies stated in Supplemental Table S9.
PAR-CLIP experiments
MCF-7 Flp-In cells expressing FLAG-HA/DDX54 were incubated with 200 µM 4sU for 16 h, followed by IR exposure (10 Gy, 1 h) or no treatment. Cells were then UV crosslinked (365 nm, 0.2 J/cm2), resuspended in lysis buffer (50 mM Tris[pH 7.5], 500 mM NaCl, 1% (v/v) IGEPAL CA-630, 1 mM DTT, complete EDTA-free protease inhibitor cocktail [Roche]), and incubated for 30 min on ice followed by 10-sec sonication at 80% amplitude. The rest of the PAR-CLIP procedure was carried out as previously described (Hafner et al. 2010) with the exception that the first and second RNase T1 treatments were performed at 1 unit/µL for 10 min at 22°C and at 2 units/µL for 7 min at 22°C, respectively. Details on library preparation are provided in Supplemental Methods.
PAR-CLIP analysis was performed using a previously published computational pipeline (v0.97a) (Lebedeva et al. 2011; Jens 2016). Conservative sets of DDX54 binding sites were defined by only retaining overlapping reads with T-C transitions in both biological replicates. Consensus sets were defined as a pooled average of the two biological replicates, retaining overlapping reads with T-C transitions in at least one replicate. For T-C transition event counts, we sequentially aligned reads to reference sequences starting with human pre-rRNA (U13369.1), followed by rRNA (NR_023363.1, NR_003285.2, NR_003287.2, NR_003286.2), other ncRNA (Ensembl), tRNA (GtRNADb), mtDNA (AF347015.1), and finally the human genome (hg19, iGenomes). T-C transitions were extracted from BAM files using SAMtools (v.0.1.19) and row_mpile_coverage_plus_TC.pl script (Schueler et al. 2014). Enrichment analysis of 7-mers and secondary structure predictions are described in Supplemental Methods.
BioID proximity ligation assays and co-immunoprecipitation
BirA-FLAG/DDX54 HEK293 Flp-In T-REx cells were incubated in the absence or presence of 1 µg/mL doxycycline for 24 h, followed by IR exposure (10 Gy) and addition of 250 µM biotin. Three and a half hours later cells were harvested and the remaining BioID procedure was performed as described (Couzens et al. 2013) with details given in Supplemental Methods.
For anti-FLAG co-immunprecipitation (co-IP) experiments, 1 h after IR exposure (10 Gy), FLAG-HA/DDX54 MCF-7 Flp-In cells were washed and lysed on-dish in 1% (v/v) IGEPAL CA-630, 50 mM Tris[pH 7.5], 300 mM NaCl, and complete EDTA-free protease inhibitor cocktail (Roche). Cleared lysates were treated with different concentrations of RNase T1 (Thermo Fisher Scientific) or left untreated (for details, see Supplemental Methods). Anti-FLAG and anti-IgG1 co-IPs were carried out for 1 h at 4°C, and Western analyses of the co-IPed material was performed using antibodies listed in Supplemental Table S9.
Definition of DDX54-bound introns
DDX54 PAR-CLIP T-C transition event counts from control and IR-exposed replicates were intersected with all nonoverlapping RefSeq hg19 exon–intron–exon regions (Braunschweig et al. 2014) using BEDTools (Quinlan and Hall 2010). T-C counts were normalized using the estimateSizeFactorsForMatrix function in DESeq2 (Love et al. 2014) and exon–intron–exon regions with more than 20 normalized T-C transitions in any of the samples were considered DDX54-bound. For unbound introns, we considered those that had no more than 1 T-C transition present in the exon–intron–exon pair over all replicates and conditions and were considerably well expressed, which was ensured by setting a threshold for intronic reads obtained from 4sU-Seq experiments.
Differential analysis of DDX54 occupancy per binding site was based on a previously published strategy (Zarnack et al. 2013). For each conservative DDX54 binding site, merged between control and IR conditions, the number of T-C transitions was counted, and normalized between conditions using normalization factors obtained by the DESeq2 estimateSizeFactors function and to the expression level obtained from the RNA-seq data set (1 h post IR). Fold changes between IR versus control were then computed from the normalized values.
Modeling of intronic and exonic features
Splice-site strength was calculated using MaxEnt (http://genes.mit.edu/burgelab/maxent/download/) (Yeo and Burge 2004). Polypyrimidine and branch point scores were calculated using SVM-BPfinder (https://github.com/RegulatoryGenomicsUPF/svm-bpfinder) (Corvelo et al. 2010) on the first 75 nt upstream of the 3′ splice site. Exonic enhancer and silencer density was calculated using http://sroogle.tau.ac.il/SROOGLE.rar (Schwartz et al. 2009). Other features for exons and introns (length, GC content, distance to TSS/pA site) were calculated using BEDTools and custom scripts (Supplemental Scripts). Classification of bound versus unbound introns was performed using all features. Similar results were achieved for both classifications independent of the fraction of data withheld for testing (x = 0.1, 0.2, 0.3, 0.4, 0.5, 0.6, 0.7, 0.8, 0.9). Data were randomized and then x fractions were set aside for testing, and the rest was used for training. Feature importance was extracted using the importance function from the randomForest R package. The “Importance” reported is the node impurity measured by the Gini index. We used all features as in the classification example, except only Chasin ESE and ESS density were used, although similar results were achieved using other ESE/ESS sets.
mRNA-seq and 4sU-Seq library preparations
For mRNA-seq, MCF-7 Flp-In cells were reverse-transfected using RNAiMAX (Thermo Fisher Scientific) in a six-well format using 60 pmol of siRNA (1 or 3) (for sequences, see Supplemental Methods). After 48 h, cells were exposed to IR (10 Gy) or left untreated and lysed at different time periods after IR exposure in TRIzol (Thermo Fisher Scientific). RNA was then extracted by miRNeasy kit (Qiagen), and 2 µg total RNA was treated with TURBO DNase (Thermo Fisher Scientific). Equal amounts of DNase-treated total RNA (1 µg) and 2 µL 1:100 dilution of ERCC Spike-in Control Mix 1 (Thermo Fisher Scientific) were mixed and input into the TruSeq unstranded mRNA kit v2 (Illumina). Manufacturer's instructions were followed in the subsequent steps.
For 4sU-Seq, MCF-7 Flp-In cells were reverse-transfected in a 10-cm dish format using 240 pmol siRNA (1 or 3). After 48 h, cells were exposed to IR (10 Gy) or left untreated. 4sU was added to the final concentration of 500 µM 20 min before TRIzol-harvesting at different time periods post IR exposure. To obtain spike-in control 4sU-labeled total RNA from D. melanogaster, S2 cells were labeled for 16 h with 200 µM 4sU. Total RNA was extracted as described above, and 60 µg was treated with TURBO DNase. 4sU biotinylation with an input mixture of human and fly total RNA (200:1) was performed as previously described (Rädle et al. 2013; Gregersen et al. 2014). To prepare cDNA libraries, TruSeq unstranded mRNA kit v2 was used according to the manufacturer's instructions starting from 50% of eluted 4sU-enriched RNA.
mRNA-seq and 4sU-Seq data processing and analysis
After de-multiplexing and adapter removal, TopHat2 (v2.1.0) (Kim et al. 2013) was used to align reads to the reference sequence composed of the human genome (hg19) and 92 sequences corresponding to the ERCC Spike in Control RNAs (Thermo Fisher Scientific). Reads were counted in GENCODE v19 exons and ERCC spike-in sequences using HTSeq-count (Anders et al. 2015). Differential expression analysis was performed by DESeq2 (Love et al. 2014) using size factors obtained from ERCC spike-in read counts. Transcripts with adjusted P-value lower than 0.10 were considered differentially expressed.
For 4sU-Seq experiments, primary and mature transcript expression was quantified according to Mukherjee et al. (2017) by RSEM (v.1.2.20) (Li and Dewey 2011) using bowtie (v.1.1.2) (Langmead et al. 2009) as the read alignment program. To calculate primary transcript expression, we included an additional isoform corresponding to the sequence of the full gene locus. For each gene, we calculated the “mature” RNA expression as the sum of all isoforms for that gene, excluding the “primary” transcript. For intronless genes, “primary” and “mature” expression values were summed. DESeq2 was used for differential expression analysis with size factors obtained from D. melanogaster exonic read counts. Transcripts with adjusted P-values lower than 0.01 were considered differentially expressed. Computation of percent intron retention (PIR) scores, pre-mRNA processing rates, and PSI values for alternatively spliced events was based on previous approaches (Braunschweig et al. 2014; Alamancos et al. 2015; de Pretis et al. 2015). Details are provided in Supplemental Methods.
Purification of DDX54-FLAG/HA and in vitro splicing assays
DDX54-FLAG/HA was transiently overexpressed in HEK293 Flp-In T-REx cells and purified by anti-FLAG immunoprecipitation and FLAG peptide elution. Details are provided in Supplemental Methods. For in vitro splicing analysis, m7G-capped RNAs were produced by in vitro transcription using linearized pSP6MINX plasmid as template. In vitro splicing reactions were composed of 52% HeLa nuclear extract, incubating 1 fmol pre-mRNA and either 2 µL untransfected or DDX54-FLAG/HA eluate per 25-μL reaction mixture under previously described splicing conditions (Hui et al. 2003). The reaction was stopped after 1 h by proteinase K treatment followed by RNA extraction. A fraction of the entire reaction (20%) was reverse transcribed and analyzed by RT-PCR as described (Wilhelmi et al. 2016). The products were separated by denaturing PAGE and quantified by a Phosphorimager and ImageQuant TL software. Quantifications were expressed as mean and standard deviation of values obtained from two biological replicate experiments.
Detection of retained introns by RT-PCR
Enrichment of newly synthesized 4sU-labeled RNA was performed as described for 4sU-Seq experiments with the exception that 70 µg total MCF-7 RNA was spiked with 70 ng D. melanogaster total RNA, and that 70 µg methylthiosulfonate-activated biotin (MTSEA biotin-XX, Biotium) (Duffy et al. 2015) was used instead of HPDP-biotin. Eluted RNA (50%) was reverse transcribed using a mixture of random hexamer and oligo(dT) primers. To detect unspliced and spliced products in a single PCR reaction, oligonucleotide primers (for sequences, see Supplemental Methods) were designed based on a previous strategy (Braunschweig et al. 2014). PCR products were separated on 2.5% (w/v) agarose gels and imaged using Fujifilm LAS-4000 gel documentation system. Band intensities were quantified by ImageJ and normalized by PCR product size and band intensity of D. melanogaster alphaTub84B. Normalized spliced values and unspliced/spliced ratios were expressed as fold changes relative to the samples not exposed to IR.
Quantification of pre-rRNA intermediates by Northern blotting
Total RNA from mock- or siRNA-transfected MCF-7 Flp-In cells was extracted 72 h post transfection with TRIzol. For each sample, 3 µg total RNA was separated on a 1% (v/v) agarose-formaldehyde in tricine-triethanolamine gel and transferred to a nylon membrane in 10× SSC by capillary action as described (Mansour and Pestov 2013). Probes 1786 (amine-caccggtcacgactcggcac-amine) and 5520 (amine-cctcgccctccgggctccgttaatgatc-amine) were fluorescently labeled with DyLight 800 NHS Ester as previously described (Rahman and Zenklusen 2013), and 20 pmol of each probe was used per hydridization in 6× SSPE, 5× Denhardt's solution, 0.2 mg/mL denatured fish sperm DNA, and 0.1% (w/v) SDS overnight at 45°C. On the next day, the membrane was washed twice for 10 min with 2× SSC and 0.1% SDS at 45°C, and once with 1× SSC and 0.1% SDS at 45°C before being scanned on a LI-COR Odyssey infrared imaging system.
pSILAC experiments
Mock- and siRNA-transfected MCF-7 Flp-In cells were grown in the standard DMEM formulation containing “light” L-arginine and L-lysine for 48 h. Cells were then exposed to IR (10 Gy) or left untreated, and the media was changed to the SILAC DMEM formulation containing 2 mM L-glutamine, 10% (v/v) dialyzed fetal bovine serum (Sigma), and either “medium-heavy” amino-acids (0.398 mM 13C6 L-arginine and 0.798 mM 4,4,5,5-D4 L-lysine) or “heavy” amino-acids (0.398 mM 13C6,15N2 L-arginine and 0.798 mM 13C6,15N2 L-lysine). For two replicates of mock or siDDX54 samples each, the media for control cells were exchanged from “light” to “medium-heavy” and for IR-exposed cells from “light” to “heavy.” The opposite applied to one “label-swap” analysis. After 24 h, cells were washed three times and scraped off in ice cold PBS. “Medium-heavy” and “heavy” cells were mixed in a 1:1 ratio and processed for MS as described above.
Colony formation assay
Forty-eight hours after DDX54 knockdown (10 nM siRNA), cells were IR-exposed (2.5 or 5 Gy) or left untreated. The clonogenic assay was then performed as described (Franken et al. 2006).
Additional data sets
In this study, we made use of nucleolar proteome data sets (Andersen et al. 2005; Moore et al. 2011), RBP census (Gerstberger et al. 2014), DDR genes (Wood et al. 2001; Milanowska et al. 2011; Mjelle et al. 2015), TP53 target genes (Nikulenkov et al. 2012; Menendez et al. 2013), spliceosomal subcomplexes (Hegele et al. 2012), exon–intron–exon regions (Braunschweig et al. 2014), and RNA-seq data sets (Kfir et al. 2015; Kesarwani et al. 2016; Yoshimoto et al. 2017). RNA-seq analysis of TCGA data sets (Sebestyén et al. 2016) is described in Supplemental Methods.
Data access
PAR-CLIP, mRNA-seq, and 4sU-Seq data from this study have been submitted to the NCBI Gene Expression Omnibus (GEO; http://www.ncbi.nlm.nih.gov/geo/) under accession number GSE89369. Whole-proteome, mRNA-bound proteome, DDX54 BioID, and pSILAC data from this study have been submitted to the ProteomeXchange (http://www.proteomexchange.org) under the data set identifiers PXD005188, PXD005189, PXD005191, and PXD006093, respectively.
Acknowledgments
We thank Nicolas Leveille and Reuven Agami for the kind gift of the MCF-7 Flp-In cell line. We thank Eduardo Eyras for kind suggestions on TCGA analysis and Stefano de Pretis for advice on the INSPEcT package. We thank Ouidad Benlasfer and Charlotte Stein for generation of stable cell lines and RNA-seq library preparation. We acknowledge Alexander Löwer for providing a list of TP53 target genes. We thank Alina-Christina Munteanu and Hans-Herman Wessels for help with in silico folding and preparation of S2 cell 4sU-labeled RNA. This work was supported by an International European Fellowship (Maria Sklodowska Actions FP7-PEOPLE-2011-IEF) awarded to M.M.
Author contributions: M.M. and M.L. conceived the study and designed experiments. M.M. performed the majority of experimental and computational work and prepared figures, including Supplemental Material. K.I. contributed mass spectrometry experiments and was supervised by M.S. In vitro splicing assays were performed by F.DeB. and supervised by F.H. N.M. contributed modeling of intronic/exonic features and pre-mRNA/mRNA quantifications and was supervised by U.O. O.H. contributed to PAR-CLIP data analysis. U.Z. contributed the colony formation assay experiments. C.T. contributed Northern blotting experiments and was supervised by M.O. M.M. and M.L. wrote the manuscript with contributions from all authors.
Footnotes
-
[Supplemental material is available for this article.]
-
Article published online before print. Article, supplemental material, and publication date are at http://www.genome.org/cgi/doi/10.1101/gr.218438.116.
-
Freely available online through the Genome Research Open Access option.
- Received November 18, 2016.
- Accepted June 5, 2017.
This article, published in Genome Research, is available under a Creative Commons License (Attribution-NonCommercial 4.0 International), as described at http://creativecommons.org/licenses/by-nc/4.0/.


