
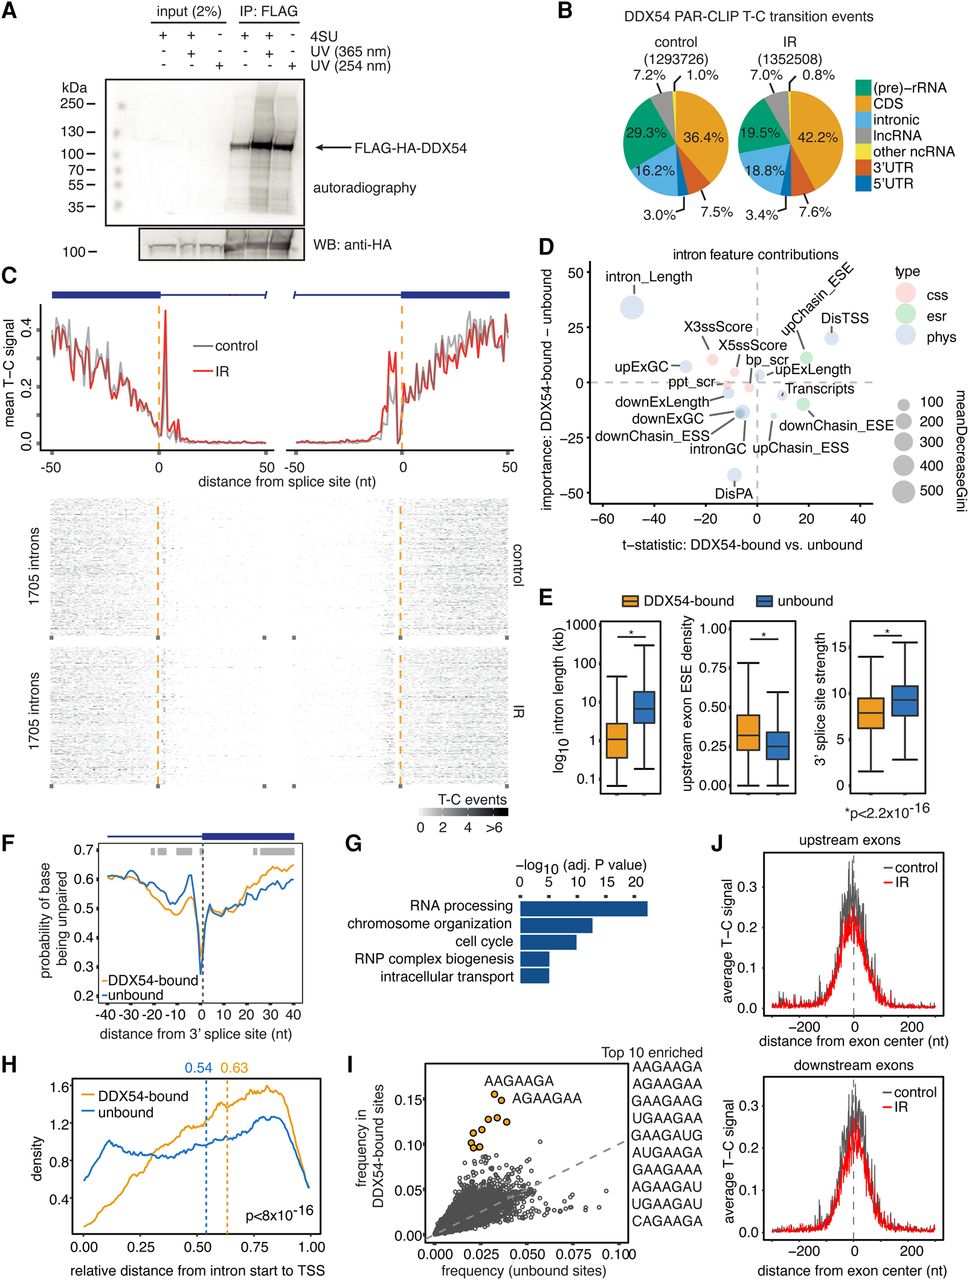
PAR-CLIP reveals differences in binding of DDX54 to acceptor splice sites. (A) FLAG/HA-DDX54 MCF-7 Flp-In cells were exposed to UV 254 nm (0.2 J/cm2) or labeled with 4sU (200 µM, 16 h) and irradiated with UV 365 nm (0.2 J/cm2). Immunoprecipitated protein–RNA complexes were radiolabeled and resolved by SDS-PAGE. The lower panel shows Western analysis of the same nitrocellulose membrane. (B) Distribution of DDX54 PAR-CLIP T-C transition events in control and IR-exposed cells (total numbers given in parentheses). (C) (Top panel) Average normalized T-C transitions events at each uridine position in 1705 introns (corresponding to 518 transcripts) displayed 50 nt upstream of and downstream from splice sites. The identical set of introns was analyzed for both control and IR-exposed conditions. (Bottom two panels) Heatmaps of normalized T-C transition events around splice sites presented in the top panel. (D) Bubble plot depicting the differential contribution and importance of features to classification of DDX54-bound and unbound introns. Three types of features were used: (css) canonical splicing signals; (esr) exonic regulatory elements; (phys) physical features. The differences (DDX54-bound and unbound) in mean decrease in model accuracy for each class (y-axis) were plotted against the t-statistic of the difference in means between intron classes (DDX54-bound and unbound). The circle size corresponds to the mean decrease in the Gini coefficient, representing the importance of that feature for the classification. (E) Comparison of intron length, upstream exonic splicing enhancer (ESE) density, and 3′ splice site strength between DDX54-bound and unbound introns. Significance was assessed by the Kolmogorov-Smirnov (K-S) test: (*) P < 2.2 × 10⁻¹⁶. (F) Average probabilities of nucleotides being unpaired in the regions of 40 nt upstream of and downstream from 3′ splice sites for DDX54-bound and unbound introns. Light gray shaded areas denote significantly different base-pairing probabilities between the two groups (P < 10−4, K-S test). (G) GO enrichment analysis of genes containing DDX54-bound introns. Top five “biological function” categories are shown ranked by Benjamini-Hochberg adjusted P-value (Benjamini and Hochberg 1995). (H) Density of relative positions of introns within transcripts (distance from the 5′ end of intron to transcription start site, TSS) for unbound versus DDX54-bound introns shown in C. Median relative positions are given above the plot. (I) Enrichment of 7-mers in exonic DDX54 binding sites. The top 10 enriched 7-mers are denoted in orange. (J) Average number of T-C transition events at positions relative to centers of exons, which are upstream of (top) or downstream from (bottom) introns shown in C.


