
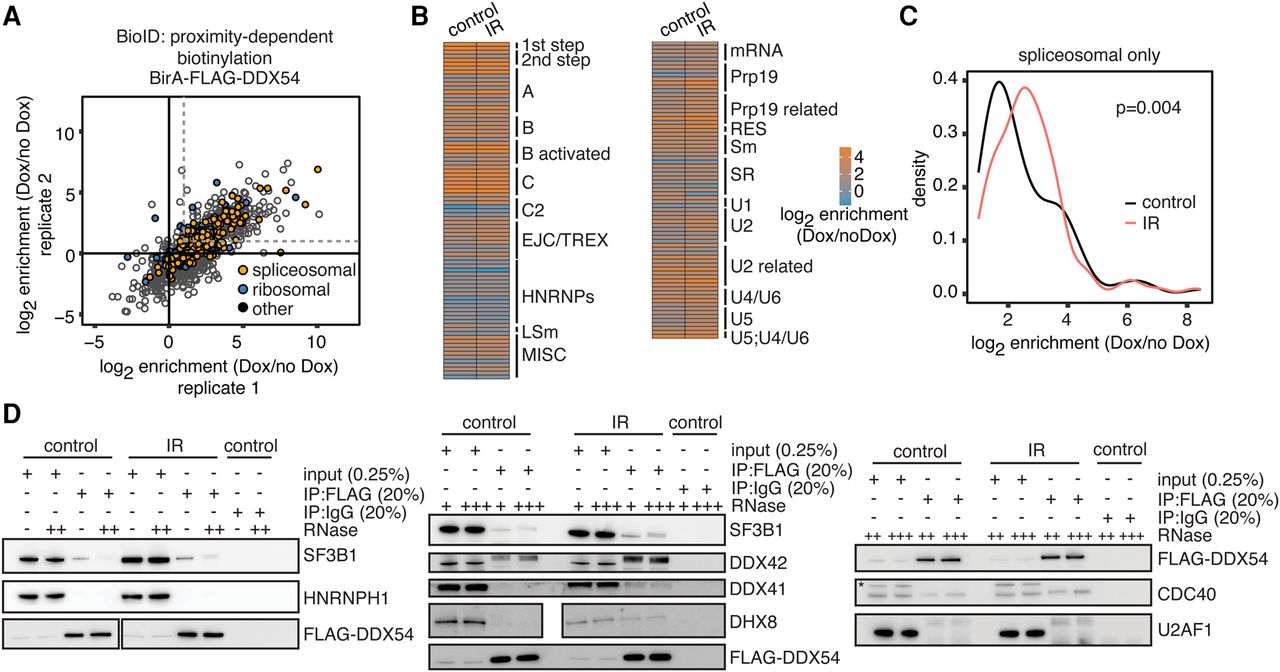
DDX54 interacts with core spliceosomal and spliceosome-associated proteins. (A) Scatter plot of log2-transformed fold enrichment values for proteins with at least two unique peptides detected in each replicate of the BirA/FLAG-DDX54 BioID proximity-dependent biotinylation experiments. Ribosomal and spliceosomal/spliceosome-associated proteins are denoted in blue and orange, respectively. Gray dashed lines denote enrichment of twofold. (B) Heatmap of log2-transformed fold enrichment values in control and IR-exposed (10 Gy, 3.5 h) cells for a subset of BioID-detected proteins categorized by spliceosomal subcomplexes according to Hegele et al. (2012). Heatmap with protein names is available in Supplemental Figure S6. (C) Density of log2-transformed enrichment values for enriched core spliceosomal and spliceosome-associated proteins (log2 enrichment >1) in IR-exposed (10 Gy, 3.5 h) and control cells (K-S test P-value). (D) Anti-FLAG co-IP validation experiments were performed on cell lysates obtained from FLAG/HA-DDX54 MCF-7 cells after IR exposure (10 Gy, 1 h) in the absence (−) or presence of low (+), intermediate (++), and high (+++) RNase T1 concentration. Western analysis of input lysates and immunoprecipitates (IP) is shown. (*) Unspecific band.


