
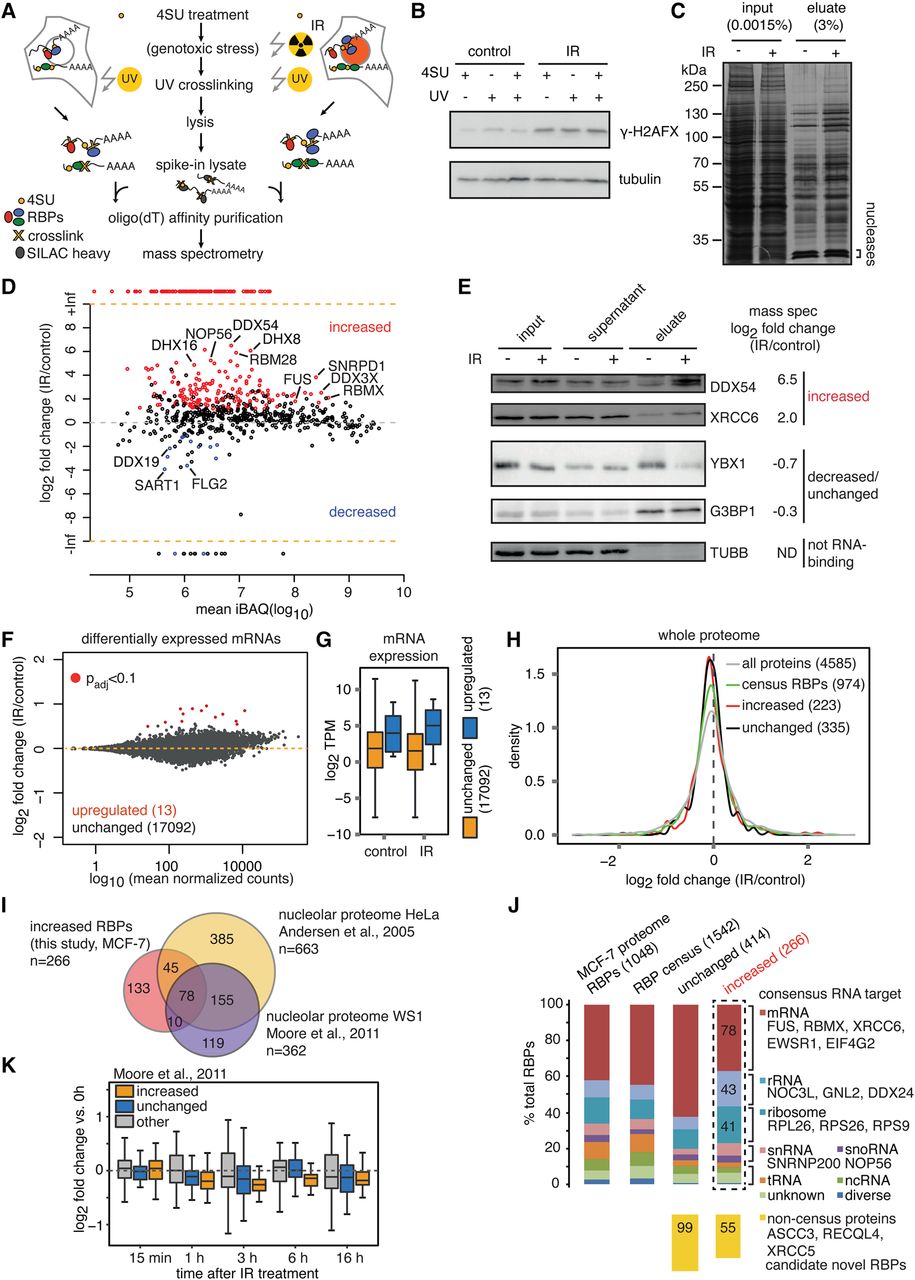
Increased binding of proteins to poly(A)+ RNA upon exposure to ionizing radiation. (A) Outline of oligo(dT) affinity purification using SILAC “heavy” spike-in normalization to detect differential binding of proteins to poly(A)+ RNA. (B) Western analysis of phosphorylated H2AFX upon 4sU treatment, UV, and/or IR exposure in total cell lysates. (C) Silver staining analysis after large-scale oligo(dT) purification. (D) Differential binding analysis of proteins detected in control versus IR-exposed cells with at least 2 unique peptides detected in at least 1 out of 4 MS runs. Mean iBAQ values versus log2-transformed fold changes obtained from normalized intensities are plotted. (E) Western analysis of proteins belonging to increased, decreased/unchanged groups, or non-RNA binders as negative control. (F) Differential expression analysis of protein-coding mRNAs in input oligo(dT) lysates (1 h post 10 Gy IR versus control). MA plot depicts mean normalized read counts versus log2-transformed fold changes. Significantly up-regulated mRNAs (adjusted P-value <0.1) are shown in red. (G) Box plots of expression levels in transcripts per million (TPM) are shown for unchanged and up-regulated mRNAs. (H) Density of log2-transformed fold changes in summed peptide intensities obtained from whole-proteome analysis of IR-exposed (10 Gy, 1 h) and control input lysates. Protein classes were defined based on D and RBP census (Gerstberger et al. 2014). Absolute numbers of whole proteome–quantified proteins are indicated in brackets. (I) Overlap in absolute numbers of proteins with increased binding in this study and two nucleolar proteome data sets. (J) Proteins with unchanged and increased mRNA binding and MCF-7 whole-proteome RBPs were classified according to their RNA target in the RBP census (Gerstberger et al. 2014). Non-RBP census proteins are depicted in yellow. (K) Proteins with unchanged and increased mRNA binding were matched with the nucleolar proteome data set. Nonoverlapping nucleolar proteins were classified as “other.” Box plots of log2-transformed fold changes in nucleolar protein abundance after different time periods post IR exposure (10 Gy) are shown.


