
Genome-wide repression of eRNA and target gene loci by the ETV6-RUNX1 fusion in acute leukemia
- Susanna Teppo1,
- Saara Laukkanen1,
- Thomas Liuksiala1,2,
- Jessica Nordlund3,
- Mikko Oittinen1,
- Kaisa Teittinen1,
- Toni Grönroos1,
- Pascal St-Onge4,
- Daniel Sinnett4,5,
- Ann-Christine Syvänen3,
- Matti Nykter2,6,
- Keijo Viiri1,
- Merja Heinäniemi7,8 and
- Olli Lohi1,8
- 1Tampere Center for Child Health Research, University of Tampere and Tampere University Hospital, 33520 Tampere, Finland;
- 2Institute of Biosciences and Medical Technology, University of Tampere, 33520 Tampere, Finland;
- 3Department of Medical Sciences, Molecular Medicine and Science for Life Laboratory, Uppsala University, 75105, Uppsala, Sweden;
- 4CHU Sainte-Justine Research Center, Université de Montréal, Montréal, Quebec, H3T 1J4, Canada;
- 5Department of Pediatrics, Faculty of Medicine, Université de Montréal, Montréal, Quebec, H3T 1J4, Canada;
- 6Department of Signal Processing, Tampere University of Technology, 33720 Tampere, Finland;
- 7Institute of Biomedicine, School of Medicine, University of Eastern Finland, 70211 Kuopio, Finland
- Corresponding author: susanna.teppo{at}uta.fi
Abstract
Approximately 20%–25% of childhood acute lymphoblastic leukemias carry the ETV6-RUNX1 (E/R) fusion gene, a fusion of two central hematopoietic transcription factors, ETV6 (TEL) and RUNX1 (AML1). Despite its prevalence, the exact genomic targets of E/R have remained elusive. We evaluated gene loci and enhancers targeted by E/R genome-wide in precursor B acute leukemia cells using global run-on sequencing (GRO-seq). We show that expression of the E/R fusion leads to widespread repression of RUNX1 motif–containing enhancers at its target gene loci. Moreover, multiple super-enhancers from the CD19+/CD20+-lineage were repressed, implicating a role in impediment of lineage commitment. In effect, the expression of several genes involved in B cell signaling and adhesion was down-regulated, and the repression depended on the wild-type DNA-binding Runt domain of RUNX1. We also identified a number of E/R-regulated annotated and de novo noncoding genes. The results provide a comprehensive genome-wide mapping between E/R-regulated key regulatory elements and genes in precursor B cell leukemia that disrupt normal B lymphopoiesis.
Childhood acute lymphoblastic leukemia (ALL) is a heterogeneous disease consisting of distinct clinical subtypes characterized by specific chromosomal translocations or mutations. The most common ALL subtypes are hyperdiploid and ETV6-RUNX1 (E/R) fusion gene positive pre-B-ALL, which both comprise ∼20%–25% of the cases (Inaba et al. 2013). Both leukemias have been suggested to arise from a progenitor cell in utero and typically advance into overt disease after accumulating additional mutations during early childhood (Wiemels et al. 1999; Bateman et al. 2015). The E/R fusion can be detected also among healthy newborns with prevalence estimates ranging from 0.01% to 1% (Mori et al. 2002; Greaves et al. 2011; Lausten-Thomsen et al. 2011; Zuna et al. 2011).
After 20 years since the discovery of the E/R fusion (Romana et al. 1994; Golub et al. 1995), the mechanism(s) by which it contributes to the development of B-ALL remains not fully understood. E/R is a fusion of two essential hematopoietic transcription factors (TF): ETV6 (TEL) (Wang et al. 1998) and RUNX1 (AML1) (Wang et al. 1996). The translocation between Chromosomes 12 and 21, t(12;21), fuses the N terminus of ETV6 to nearly full-length RUNX1, thus retaining the DNA-binding domain of RUNX1 (Runt). The E/R fusion is suggested to function as an aberrant TF: The transactivating function of RUNX1 is lost, and the fusion protein is converted into a repressor through the ETV6 moiety that recruits corepressors (SIN3A or NCOR) and epigenetic modifiers (HDACs) (Hiebert et al. 1996; Fears et al. 1997; Fenrick et al. 1999; Song et al. 1999; Uchida et al. 1999; Guidez et al. 2000; Hiebert et al. 2001; Morrow et al. 2007). During the past decade, a number of microarray studies were performed exploring the gene expression profiles of E/R-positive patient samples (Yeoh et al. 2002; Ross and Zhou 2003; Fine et al. 2004; Andersson et al. 2005, 2007; Gandemer et al. 2007). However, these studies generated only a limited number of common genomic targets of E/R, and the functions of E/R have remained elusive.
Global run-on assay followed by next generation sequencing (GRO-seq) is a recently described method that allows for genome-wide detection of primary transcript levels by directly measuring nascent RNA production, including transcription at regulatory elements (Core et al. 2008). At these regions, RNA polymerase II (RNAP II) generates so-called enhancer RNAs (eRNAs) that show dynamic activation patterns reflecting regional regulatory activity (Core et al. 2008; Kaikkonen et al. 2013). Enhancers contain binding sites for multiple sequence-specific TFs that can be revealed through profiling dynamical eRNA expression and de novo motif discovery. In the context of lineage determination, a unique subset of enhancers termed super-enhancers (SE) has been distinguished. They consist of enhancers with clustering of binding sites for multiple TFs and high histone K27 acetylation levels, reminiscent of locus control regions characterized at beta-globin or immune gene loci (Li et al. 2002; Whyte et al. 2013; Pott and Lieb 2014; Adam et al. 2015). Recently, aberrant enhancer activity at the TAL1 gene locus was shown to drive leukemogenesis in T-ALL (Mansour et al. 2014). However, the majority of cancer-relevant regulatory elements remain uncharacterized.
Here we applied GRO-seq on an inducible cell model to elucidate the genomic targets of the E/R fusion in precursor B-ALL.
Results
ETV6-RUNX1 is predominantly a repressive fusion TF
To study the molecular functions and targets of the E/R fusion in ALL, we generated a doxycycline-inducible human E/R expressing cell line using an E/R-negative precursor B-ALL cell line Nalm-6 (Nalm6-E/R) (Fig. 1A; Supplemental Fig. S1A–E). Induction with doxycycline for 24 h increased the E/R mRNA level by 18-fold compared to REH cells (in which E/R is expressed endogenously) (Supplemental Fig. S1A), and at protein level, E/R was detectable as early as 4–8 h after induction (Fig. 1B). Since the E/R fusion retains the DNA-binding domain of the RUNX1 protein (Runt), we generated another cell line with a targeted mutation (Nalm6-E/Rmut): Substitution of an arginine with glutamine (R201Q) in human RUNX1 reduces DNA-binding affinity of the Runt domain by 1000-fold (Li et al. 2003; Morrow et al. 2007). Moreover, a reciprocal cell line was created in which endogenous E/R is silenced by ∼60% (REH-shE/R) (Supplemental Fig. S1F).
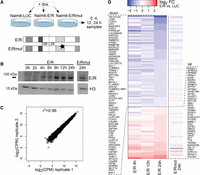
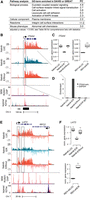
An inducible cell culture model uncovers early transcriptional changes downstream from the ETV6-RUNX1 fusion protein. (A) The doxycycline-inducible cell culture model (Nalm6-E/R) with two controls (Nalm6-E/Rmut and Nalm6-LUC) is schematically illustrated and the sampling time points indicated (see also Supplemental Fig. S1). Mutation at the DNA-binding domain of E/R is marked with a star. (B) Expression of E/R fusion protein after doxycycline induction at indicated time points (a representative Western blot of two replicates). The H3 antibody was used as a loading control. (C) Highly consistent results were obtained from biological replicates, as shown by a correlation plot depicting the GRO-seq signal from Nalm6-LUC cells. Pearson r2 values for the biological replicate pairs of all samples were between 0.96–0.98. (D) A heatmap illustrating magnitude and direction of changes in the GRO-seq signal for the annotated transcripts altered in the E/R sample (and not in E/Rmut) at 24 h. Log2 fold changes of indicated samples relative to Nalm6-LUC are shown in color with shades of blue and red indicating down-regulation and up-regulation, respectively. E/R-mediated changes were predominantly repressive (for genes, see Supplemental Table S5).
We applied the GRO-seq assay on our inducible cell model to investigate early E/R-mediated transcriptional events. After 0, 4, 12, and 24 h of E/R induction, nuclei were extracted, and GRO-seq was performed with a high level of concordance (r2 = 0.96) between two independent experiments (Fig. 1C). Mature transcripts as measured by RT-qPCR showed considerable concordance with primary transcription in GRO-seq (Supplemental Table S1). Overall, two-thirds of the DNA-binding-dependent transcriptional alterations at 24 h were repressive (Fig. 1D).
ETV6-RUNX1–mediated repression occurs at enhancers carrying RUNX1 binding sites
GRO-seq allows TF binding sites to be inferred by investigating sequence-specific DNA motifs within enhancer regions that display expression of eRNAs. We explored changes of eRNA expression in the vicinity of E/R-regulated genes that, based on the mutant E/R results, depended on direct DNA-binding (for transcript-centric list, see Supplemental Table S2 for coordinates) and tested for the overrepresentation of TF motifs (see Supplemental Material, “Genomic regions used in analysis” and “TF motif enrichment analysis”). As shown in Figure 2A, enhancers containing the ETS motif were enriched at both up- and down-regulated loci, whereas the RUNX1 motif ranked highly in the repressed group. As an independent confirmation, we retrieved ChIP-seq profiles for RUNX1 in an ALL cell line (SEM) and for RUNX1, ERG, and FLI1 (the latter two representing ETS factors) in hematopoietic stem cells (HSC) (GSE42075, Wilkinson et al. 2013; GSE45144, Beck et al. 2013). There was significant enrichment of RUNX1 peaks in the ±400 kb vicinity of regulated genes, as shown in Figure 2B, agreeing with the motif enrichment analysis (Fig. 2A). Again, RUNX1 peaks were associated with E/R-mediated repression (Fig. 2B). The result remained consistent when less stringent peak cutoffs were tested (Supplemental Fig. S2). Among the enhancers associated with E/R-regulated genes at ±400 kb from the altered transcription start site (TSS) of a transcript, 67% (315 of 467) contained either a RUNX1 motif or a RUNX1 binding site (ChIP peak in HSC or SEM cells). Notably, we found evidence of a nearby E/R-regulated enhancer for 96% of genes identified by the transcript-centric approach (104/108) and for all but one, at least one enhancer region with evidence of RUNX1 binding or motif (Supplemental Table S2).
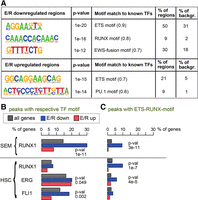
Enrichment of TF motifs at enhancers in the vicinity of E/R-regulated genes. (A) Enriched TF motifs at putative enhancer regions within 400 kb of the transcription start site (TSS) of E/R-regulated genes are shown (binomial test with FDR < 0.01 and enrichment in >5% of regions). P-value, best-known matching TF motif, and the percentage of regions containing the motif are indicated. The similarity score to known TF motifs is shown in parentheses. (B,C) Enrichment of ChIP peaks nearby (max 400 kb from TSS) all expressed genes (gray) or those that were either down-regulated (blue) or up-regulated (red) by E/R. Horizontal bars show the percentage of genes associated with a ChIP peak containing either the indicated TF motif (in B) or the ETS-RUNX motif (in C). P-value of the hypergeometric test is shown for statistically significant enrichment in the repressed group (P < 0.05). The most prominent ChIP peaks from each data set were used for the analysis. See Supplemental Figure S2 for additional details.
A previous work indicated that RUNX1 and ETS factors can also occupy a shared ETS-RUNX motif (Hollenhorst et al. 2009). We observed marked enrichment of repressed RUNX1 binding sites harboring ETS-RUNX motif in both SEM and HSC cells (fivefold, Fig. 2C). ERG ChIP peaks centered by either ERG motif (Fig. 2B) or ETS-RUNX motif (Fig. 2C) showed enrichment in the E/R-repressed category, agreeing with the eRNA-based motif analysis. In contrast, the up-regulated genes lacked enrichment of the studied ChIP peaks (RUNX and ETS factors). The TF motif and ChIP peak enrichment results suggest that E/R acts mainly through binding to a RUNX1 motif and that a subset of genes may be coregulated with ETS factors or indirectly by other TFs.
ETV6-RUNX1 targets super-enhancers associated with CD19+/CD20+-cell identity
To further scrutinize the motif and ChIP peak findings (Fig. 2), we explored the eRNA signal distribution upon E/R induction from top RUNX1 peaks in SEM cells. As shown in Figure 3, A and B, repression of eRNA signal centered to RUNX1 motif occurred specifically upon wild-type E/R expression, reaching the maximal effect at the 24-h time point.
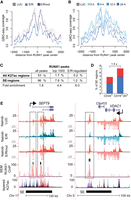
eRNA transcription profiles reveal E/R targets and repression at SE regions. Histograms of GRO-seq coverage are shown at RUNX1-bound genomic regions comparing control (LUC), E/R mutant (E/Rmut), and wild-type E/R samples (A) and across the time series of E/R induction (B). Signal profile represents the most prominent intergenic RUNX1 ChIP peaks from SEM cells centered by the RUNX1 motif. Early repression of eRNAs is evident at the center of RUNX1-bound sites upon expression of E/R but not E/Rmut. (C) Enrichment of RUNX1 ChIP peaks in SEM cells at SE regions over regular H3K27ac regions is shown. The fold enrichment at SE regions is indicated for all peaks (P-value <10−50), top 1000 peaks (P-value 5.2 × 10−44), and E/R-regulated RUNX1 peaks (P-value 1.6 × 10⁻¹⁰). (D) Proportion of E/R-regulated SE regions in CD34+ or CD19+/CD20+ cells is shown as bar plots. Down-regulation and up-regulation are indicated in blue and red, respectively. In total, 37 of 500 SEs in CD19+/CD20+ were regulated by E/R, a 1.5-fold excess compared to CD34+ cells (22 of 452 SEs in CD34+). (E) GRO-seq signal tracks at representative E/R-regulated SEs are shown. Repression of eRNA signal at prominent RUNX1 ChIP peaks (highlighted in the figure) is observed in the vicinity of SEPT9 and VDAC1 genes. Transcript variants 10 and 11 of SEPT9 are shown in the RefSeq track. Two biological replicates of each GRO-seq sample (Nalm6-LUC, Nalm6-E/R, Nalm6-E/Rmut) are shown with different shades of color, and signals above and below the axis indicate plus and minus strands, respectively. RUNX1 ChIP peaks in SEM cells are shown in light red overlaid with the input control in shades of blue and purple. SE track is based on CD19+/20+ cell data from Hnisz et al. 2013. Layered H3K27ac track indicates active enhancers and is shown as an overlaid signal from seven cell lines retrieved from ENCODE (The ENCODE Project Consortium 2012). Color key: GM12878, red; H1-hESC, yellow; HSMM, green; HUVEC, light blue; K562, blue; NHEK, purple; NHLF, pink.
Given the role of RUNX1 in HSC differentiation (for review, see Lutterbach and Hiebert 2000), we next compiled annotated B cell and HSC enhancers based on H3K27ac data (distinguishing between “regular” enhancers and super-enhancers as in Hnisz et al. 2013), and included the most prominent RUNX1-bound sites in SEM and HSC cells (Supplemental Fig. S3A). The GRO-seq signal was then quantified at these sites. This “enhancer-centric” approach allowed us to pinpoint regulation by E/R that directly considers alterations of eRNA (Supplemental Fig. S3B,C). We next tested whether the RUNX1 peaks in SEM cells were generally enriched at SE regions and found enrichment over all H3K27ac-positive regions (4.4-fold, P-value 5 × 10−44) (Fig. 3C). Importantly, E/R-regulated sites (based on the eRNA level analysis) with RUNX1 peaks were also enriched at SE regions (6.0-fold, P-value 1.6 × 10⁻¹⁰). Motivated by this observation, we compared the proportion of SEs from CD34+ cells and CD19+/CD20+ cells, which represent HSC and later stage of B cell differentiation, respectively. The amount of affected SE regions in CD19+/CD20+ cells was 1.5-fold higher compared to CD34+ enhancers, and 65% of the SEs were repressed (Fig. 3D; Supplemental Table S3). These findings indicate the role for the E/R fusion as an impediment for B cell differentiation.
In total, among the 534 E/R-regulated H3K27ac regions revealed by the enhancer-centric analysis, 59 were SEs (for the SE-coordinates, see Supplemental Table S3), and 28 of them (47%) correlated with an alteration at a nearby gene (for the list, see Supplemental Table S2). Intriguing examples of repressed SEs with multiple RUNX1 peaks are the two loci shown in Figure 3E, containing cancer-related genes SEPT9 and VDAC1 (Peterson and Petty 2010; Brahimi-Horn et al. 2015).
GRO-seq establishes noncoding transcript targets of ETV6-RUNX1
Recent findings have indicated a role for misexpression of long noncoding RNAs (lncRNAs) in various steps of tumorigenesis (Yang et al. 2014). In addition to the eRNAs, our GRO-seq profiling revealed 28 novel E/R-regulated lncRNA transcripts, which were manually classified as either antisense RNAs (14) or intergenic RNAs (14) to depict their putative function (Supplemental Table S4). One of the most robustly E/R down-regulated and annotated lncRNA was LOC728175 (uncharacterized transcript), which is associated with a SE region in CD19+/CD20+ cells (Fig. 4A). Down-regulation of LOC728175 was confirmed by RT-qPCR at mature RNA level after E/R induction (Fig. 4B). In evaluating the clinical relevance of this finding, we analyzed its expression in patient samples. RNA-seq measurement revealed that LOC728175 expression was lower among E/R-positive patients (n = 9), compared to other precursor B-ALL subtypes (n = 8) (Fig. 4C). Similarly, an E/R-regulated noncoding transcript near the SE region of CLEC2D locus (Fig. 4D) was repressed among E/R-positive patients (Fig. 4E,F). Overall, among the de novo transcripts regulated by E/R in GRO-seq (57 transcripts), 15 showed concordant change in expression (adjusted P < 0.05) (Supplemental Table S4).
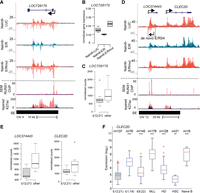
E/R-regulated noncoding genes retain altered expression in patient samples. (A) GRO-seq and ChIP-seq signals (as in Fig. 3E) indicate down-regulation of LOC728175 transcription by E/R, likely through a RUNX1 binding site located at TSS. (B) E/R-mediated down-regulation of LOC728175 in Nalm6-E/R cells as measured by RT-qPCR after 24 h of E/R induction. Expression was normalized to the housekeeping gene GAPDH. A representative experiment is shown with technical variation (lowest and highest datum within 1.5 × IQR). (C) RNA-seq normalized count values for LOC728175 among E/R-positive (t12;21) and E/R-negative (other) patients indicate lower expression in the E/R-positive group (adjusted P-value 0.37; E/R, n = 9; other, n = 8). (D) GRO-seq and ChIP-seq signals shown at a locus containing three repressed genes (LOC374443, CLEC2D, and a de novo transcript E/R54) and colocalizing with RUNX1-binding sites. Tracks are as in Figure 3E. (E) RNA-seq normalized count values for LOC374443 and CLEC2D show that decreased expression is maintained at the diseased state (LOC374443 adjusted P-value 0.020; CLEC2D adjusted P-value 0.027). No reads mapped to E/R54. (F) Combined microarray data indicate repression of CLEC2D among E/R-positive patients. In each comparison, statistical significance (Mann-Whitney U test) was tested against E/R-positive subtype: (***) P < 0.001; (**) P < 0.01. Tukey whiskers are shown for each box plot (1.5 × IQR).
ETV6-RUNX1 regulates cell adhesion and transmembrane signaling pathways
As SEs are essential in differentiation, their enrichment suggested significant consequences for cellular pathways. The enhancer-centric approach in parallel to transcript-centric approach jointly implicated 183 coding and 13 noncoding annotated transcripts as E/R targets in a Runt DNA-binding domain-dependent manner (Supplemental Table S5). To unveil the pathways implicated, we performed gene ontology analyses for the transcript-centric gene list using the DAVID software (Huang et al. 2009) and for the enhancer-centric regulatory region list by using the GREAT software (see Supplemental Material; McLean et al. 2010). Interestingly, genes related to cell adhesion and transmembrane or intracellular signaling were highly ranked among functional annotation groups in both analyses (Fig. 5A; for detailed results, see Supplemental Table S6).
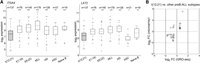
Transmembrane signaling is affected by E/R. (A) Excerpt of the most significantly enriched gene ontology and pathway terms for E/R-regulated transcript-centric and enhancer-centric analyses (see also Supplemental Table S6). (B) GRO-seq and ChIP-seq signals at the ITGA4 locus are shown as in Figure 3E. The annotated SE region present in both CD19+/CD20+ cells and CD34+ cells (Hnisz et al. 2013) harbors a prominent RUNX1 peak downstream from the TSS. This RUNX1 peak is referred to in D. The primary transcript is repressed by E/R. (C) ITGA4 mRNA expression level as measured by RT-qPCR after 24 h of E/R induction (Nalm6-E/R) or after silencing of endogenous E/R in REH cells (REH-shE/R). A representative experiment with technical variation (1.5 × IQR) is shown. Expression is normalized to the housekeeping gene GAPDH. (D) ETV6 ChIP assay with qPCR (primer sites are in the middle of the RUNX1 peak highlighted in B) validates the binding of E/R after 24 h induction, while E/Rmut, LUC, or nonspecific IgG antibody shows no enrichment in comparison to the control region at the GAPDH promoter area. A representative figure of two independent ChIP experiments is shown. (E) LAT2 transcript is repressed in Nalm6-E/R cells (refer to Fig. 3E for tracks). Dashed boxes indicate the TSS and intron 3 of LAT2. (F) Expression of LAT2 mRNA relative to housekeeping gene HMBS as measured by RT-qPCR after induction of E/R for 24 h or after silencing of endogenous E/R in REH cells. A representative experiment is shown with technical variation (1.5 × IQR).
This prompted us to examine the genes related to cell adhesion and signaling more closely. Knockout of ITGA4, a gene that belongs to the enriched integrin signaling pathway (Fig. 5A) and encodes a transmembrane subunit of the VLA4 receptor, results in a differentiation block prior to pro-B cell stage in mouse (Arroyo et al. 1996). A locus containing ITGA4 is among the E/R-regulated SE regions that contain a ChIP peak for RUNX1 (Fig. 5B), suggesting direct binding. As shown in Figure 5C, expression of the mature ITGA4 transcript was repressed by E/R containing the wild-type Runt domain and up-regulated in REH shE/R-knockdown cells. We confirmed direct binding of wild-type E/R at ITGA4 promoter, coinciding with SE, with a ChIP experiment using ETV6 antibodies (Fig. 5D). The direct effect was further supported by the lack of ChIP-enrichment of the E/Rmut sample.
We also investigated E/R targets between different RUNX1 fusions and observed LAT2 (linker for activation of T-cells family member 2), a signaling transmembrane protein, as a shared target for E/R and the RUNX1-RUNX1T1 fusion (Brdicka et al. 2002; Janssen et al. 2003; Duque-Afonso et al. 2011a). In acute myeloid leukemia, binding of the RUNX1-RUNX1T1 fusion results in widespread alterations throughout the epigenome (Ptasinska et al. 2012, 2014). A binding site for RUNX1-RUNX1T1 (Duque-Afonso et al. 2011b) at intronic region 3 of LAT2, which contains prominent peaks in RUNX1-ChIP assay, was markedly repressed in GRO-seq by the E/R fusion (Fig. 5E). Repression of mature LAT2 transcript was evident after E/R induction, whereas up-regulation was detected in REH shE/R-knockdown cells (Fig. 5F). Both ITGA4 and LAT2 were consistently repressed in a large patient data set among E/R-positive patients (Fig. 6A).
Patient data indicate that E/R-perpetuated changes persist at diagnostic samples. (A) Expression of ITGA4 and LAT2 in microarrays shows repression among E/R-positive patients compared to other subtypes: (MLL) KMT2A (MLL) rearranged; (HD) hyperdiploid; (HSC) hematopoietic stem cells. In each comparison, statistical significance (Mann-Whitney U test) was tested against the E/R-positive subtype: (***) P < 0.001; (**) P < 0.01; (*) P < 0.05. (B) Concordance between differentially expressed genes on GRO-seq and combined microarray (Pearson's correlation coefficient 0.529, P = 0.0011) (Supplemental Table S7).
ALL patient data sets discern ETV6-RUNX1 targets
In examining the persistence of observed changes in overt disease, we compiled a large single-platform gene expression data set from the GEO microarray repository, including 664 precursor B-ALL samples of all ages and with known genetics (Supplemental Material; Heinäniemi et al. 2013; Liuksiala et al. 2014). This was also motivated by the limited overlap between previous microarray studies in patients (Supplemental Fig. S3D; Supplemental Material) and cell culture models (Fuka et al. 2011; Linka et al. 2013). With the unified sample set, a quarter (35/133) of the E/R fusion targets identified by the GRO-seq and measured in the microarray data set were found differentially expressed between E/R-positive and E/R-negative ALL samples (Supplemental Table S7). The correlation between the log2 fold changes of the 35 differentially expressed genes was significant (Pearson's correlation coefficient 0.529 with a P-value of 0.0011) (Fig. 6B). In a majority of the genes (23/29), concordant alterations were observed in RNA-seq analysis of a cohort of pediatric ALL patients consisting of nine E/R-positive and eight other precursor B-ALL patients (13/29 with adjusted P < 0.05) (Supplemental Table S7).
Discussion
Enhancers represent key control switches that regulate initiation of transcription at nearby gene loci by integrating signals from multiple TFs (Arner et al. 2015). Transcription of eRNA is considered the most precise mark of functional looping between an activated enhancer and its regulated gene promoter, and the dynamic changes observed in eRNA levels allow elucidation of key TFs upon cell differentiation and environmental stimuli (Wang et al. 2011; Kaikkonen et al. 2013). We present here the first application of eRNA quantification to elucidate aberrant transcriptional activity downstream from a fusion TF. With our controllable cell model coupled to GRO-seq, we were able to identify E/R targets at both regulatory regions and at protein-coding and noncoding genes. To establish a link between regulatory region activity and gene transcription downstream from E/R, a correlation-based approach was applied to link enhancers to target genes and combined with motif annotation and ChIP-seq data. Further, we used the mutated E/R to exclude effects that did not involve direct DNA binding. Complementary experimental validation using an ETV6 ChIP assay showed that a promoter region of ITGA4 was bound by the E/R fusion and not by its mutated form. This demonstrates how the initial regulatory map based on GRO-seq signal correlation can be further validated and refined.
Directly measuring nascent RNA production, GRO-seq bypasses issues of antibody specificity and cross-linking efficiency associated with ChIP assays (Slattery et al. 2014). Moreover, mapping between an enhancer and gene transcription is achieved more directly than by integrating mature transcript levels. By detecting de novo eRNAs in the vicinity of annotated E/R-regulated genes, and in an alternative approach by quantifying eRNA levels at previously characterized enhancers, we observed a rapid repression of prominent RUNX1 binding sites, and RUNX1 and ETS motifs, as underlying the global changes in eRNA levels and gene transcription upon E/R induction. Typically, the gene loci that were concomitantly repressed harbored multiple E/R-regulated enhancers with prominent RUNX1 peaks. Significant regulatory effects at enhancers translated into significant alterations of transcription at nearby genes in one-third of genomic loci. Lack of more complete concordance may reflect complex regulatory mechanisms or imply a role for E/R in epigenetic remodeling that impact the region with a delay.
Recently, a subset of T-ALL patients was found to harbor mutations near the oncogenic TAL1 locus that leads to establishment of a highly active SE via MYB binding (Mansour et al. 2014). We observed enrichment of E/R-regulated RUNX1 binding sites in SEs. Moreover, several affected binding sites localized to gene loci with an established role in cancer, including SEPT9 and VDAC1. Intriguingly, SEPT9 is a leukemic fusion partner for KMT2A (MLL) and associated with oncogenic signaling pathways in many cancers (e.g., by interacting with HIF-1-alpha) (Peterson and Petty 2010), and the knockout of VDAC1 in mouse induces tumor growth (Brahimi-Horn et al. 2015). Accompanying these potential oncogenic changes, repression of super-enhancers associated with CD19+/CD20+ cells could underlie the differentiation arrest at the pro-/pre-B cell stage in E/R-positive patients and provide further evidence implicating regulatory regions in cancer development (Hnisz et al. 2015).
Our main finding that approximately two-thirds of E/R targets were repressed is in accordance with early reports that suggested a repressive role for E/R (Hiebert et al. 1996; Fenrick et al. 1999; Guidez et al. 2000). Although the majority of the E/R targets were repressed, one-third of them were up-regulated, possibly through other TFs such as ETS factors as suggested by motif analysis, and a few of the genes were regulated independently of DNA binding through the Runt domain, suggesting indirect effects (data not shown). One potential caveat in our experimental setup is the ectopic expression of E/R, which may allow nonspecific DNA binding. To moderate possible cell-line–specific effects and to aid in distinction of clinically relevant targets, we integrated data from patient samples. We were able to pinpoint a considerable number of genes targeted by E/R within hours of induction that were also present in primary ALL patients carrying the t(12;21) translocation. In future, it would be informative to evaluate E/R targets during various stages of early B lymphopoiesis to better understand the dynamics of disease initiation.
In conclusion, we demonstrate that E/R functions as a repressive TF at genomic sites containing the RUNX1 motif. Based on our results and literature (Schindler et al. 2009; van Delft et al. 2011), we suggest that E/R impairs B cell differentiation through transcriptional reprogramming and renders pre-leukemic cells susceptible to additional genetic hits for an extended period of time. The results pave the way for further characterization of the TF network that mediates commitment to B cell fate and the specific contribution of leukemic TF fusions derailing this process.
Methods
Cloning, cell culture, and chromatin immunoprecipitation
pLVX-Tight-Puro-ETV6-RUNX1 (E/R) construct was generated by cloning ETV6-RUNX1 cDNA (a kind gift from Professor Renate Panzer-Grümayer) into the inducible expression vector (Clontech). Point mutation G1553A was introduced by site-directed mutagenesis resulting in the E/Rmut construct. The shE/R construct was generated by cloning short hairpin RNA (shRNA) oligos targeting ETV6-RUNX1 (target sequence GAATAGCAGAATGC ATACTT) into pLVX-shRNA1 vector (Clontech). Nalm6-cells (ACC 128, DSMZ) were infected with the regulatory vector TetOn and subsequently with one of the pLVX response vectors: E/R, E/Rmut, or LUC (luciferase control) (Clontech). The expression of E/R in Nalm6-cells was induced with 500 ng/mL doxycycline (Clontech) and confirmed by RT-qPCR and Western blotting. RT-qPCR was performed using iScpript (BioRad) and SsoFast EvaGreen Supermix (BioRad), and the relative 2−ΔΔCT method (Livak and Schmittgen 2001) was used for quantification. Western blot to detect E/R was performed using anti-ETV6 (HPA000264, RRID:AB_611466, Atlas Antibodies). For chromatin immunoprecipitation (ChIP), 2 × 10⁷ cells per immunoprecipitation were harvested after 24 h induction and cross-linked using ethylene glycol bis[succinimidylsuccinate] (EGS) (Thermo Fisher Scientific) and formaldehyde (J.T. Baker, Avantor). Two antibodies against ETV6 were pooled for IP (sc-166835, RRID:AB_2101020 [Santa Cruz Biotechnology] and HPA000264, RRID:AB_611466 [Atlas Antibodies]).
Further details and all primer sequences are listed in Supplemental Material.
GRO-seq assay and processing of GRO-seq and ChIP sequencing reads
The nuclei isolation (yielding ∼5 × 10⁶ nuclei per condition), the nuclear run-on reaction, and library preparation were performed as previously described (Wang et al. 2011, Kaikkonen et al. 2013; Supplemental Material). The ChIP-seq data from human HSC and SEM cells (GSE45144, Beck et al. 2013; GSE42075, Wilkinson et al. 2013; originally mapped to hg18) were reanalyzed starting from raw reads. See Supplemental Material for details of processing and visualizing the GRO and ChIP sequencing reads.
Genomic regions used in analysis
ChIP-seq: Peak detection was performed using HOMER program findPeaks style factor (http://homer.salk.edu/homer/ngs/peaks.html) against the respective control (IgG or input). Due to the different number of peaks called from each experiment, the 1000 peaks with highest enrichment were used to represent prominent binding of the TF in question (HOMER program getTopPeaks.pl) (Supplemental Fig. S2). Hypergeometric P-values for RUNX1-peak enrichments were calculated for greater or equal difference than observed.
GRO-seq: The HOMER program findPeaks.pl was used to identify de novo transcripts from GRO-seq data using a pooled read library and allowing gaps at nonmappable regions. Transcript categories identified and further details are described in Supplemental Material.
Differential expression analysis of GRO-seq transcripts
Transcript quantification is described in detail in the Supplemental Material.
For the transcript-centric analysis, transcripts expressed at a level RPKM > 1 (reads per kilobase per million mapped reads) in at least two samples and with at least 20 reads within the quantified region in any sample were used for statistical analysis, excluding snoRNAs. Differentially expressed transcripts were identified using the R/Bioconductor package edgeR (Robinson et al. 2010). A linear model was fitted to the RLE-normalized data using a group-mean design matrix. Contrasts between the different conditions were performed, and transcripts with at least 1.5-fold change in expression level and adjusted P-value < 0.05 (Benjamini-Hochberg method using P-values from moderated t-test) were defined as significantly regulated (Benjamini and Hochberg 1995). The correlation and Euclidean distance between the log2 fold change values observed for the transcript and dynamically regulated eRNAs (as defined above) ±400 kb from TSS was used to assign candidate regulatory elements for each transcript. The transcript-centric analysis was coupled with TF motif enrichment analysis ±400 kb from significantly regulated genes (for further details, see Supplemental Material).
For the enhancer-centric analysis, the eRNAs passing the expression level-based cutoffs (RPKM 2.5 and at least 10 reads) at annotated B cell, HSC, and RUNX1-bound enhancers based on previously reported H3K27ac ChIP-seq data (Hnisz et al. 2013), and the top ChIP-seq peaks in HSC (GSE45144) and SEM cells (GSE42075), were included in the statistical analysis, performed as above. The eRNAs with adjusted P-value < 0.1 and lacking a response in the E/Rmut sample were associated with nearby genes based on log2 fold change values of eRNA and gene body transcription, similarly as above. Further, only gene transcripts with significant change (two-tailed t-test) between E/R 24 h and LUC were reported. Notice that this approach performs multiple testing corrections on eRNA changes and prioritizes E/R regulation at enhancers, with no fold change cutoff for associated gene transcripts applied, compared to the transcript-centric analysis. Consistent with the gene transcription profiles, multidimensional scaling of the eRNA profiles grouped biologically similar samples together (Supplemental Fig. S3C), validating the enhancer-centric approach as a complementary way to improve detection of E/R targets.
Microarray data set and RNA sequencing
The microarray data were retrieved from the NCBI GEO database representing healthy and malignant hematological samples hybridized to Affymetrix GeneChip Human Genome U133 Plus 2.0 array (for GSE accession numbers, references, and further details of data processing, see Supplemental Material). Differential expression was defined by a minimum absolute log2 fold change of 0.5 between group medians and maximum Q-value of 0.01.
Publicly available RNA-seq data for 17 primary BCP-ALL patients were obtained from the Gene Expression Omnibus data set GSE79373. The data were available from nine BCP-ALL patients harboring the ETV6-RUNX1 fusion gene and eight BCP-ALL patients without ETV6-RUNX1 (hyperdiploid n = 7, other n = 1). Aligned reads were summarized using featureCounts (Liao et al. 2014). Differential expression was performed using the DESeq2 package in R (Love et al. 2014). Expression analysis was only run on the regions selected based on GRO-seq: 35 E/R-regulated protein-coding genes (intersect of GRO-seq data and the combined microarray analysis) and 57 de novo regions. See Supplemental Tables S4 and S7 for normalized count values used in RNA-seq box plots.
Data access
GRO sequencing data generated in this study have been submitted to the NCBI Gene Expression Omnibus (GEO; http://www.ncbi.nlm.nih.gov/geo/) under accession number GSE67519.
Acknowledgments
We thank Minna Kaikkonen for advice in GRO-seq methodology. We thank the Sequencing Service GeneCore Sequencing Facility (EMBL, http://genecore3.genecore.embl.de/genecore3/index.cfm) for DNA sequencing. This work was supported by grants from the Academy of Finland (project number 277816 to O.L.; 276634 to M.H.; 265575 to K.V.); The Foundation for Pediatric Research (O.L.); Jane and Aatos Erkko Foundation (O.L.); Sohlberg Foundation (K.V.); Competitive State Research Financing of the Expert Responsibility area of Tampere University Hospital (grant numbers 9R029 and 9S032 to O.L.); the Swedish Cancer Society (CAN2010/592 to A.C.S.); the Swedish Research Council for Science and Technology (VR-NT 90559401 to A.C.S.); and The Finnish Cultural Foundation (Interdisciplinary Science Workshops to M.H.).
Footnotes
-
↵8 Co-senior authors.
-
[Supplemental material is available for this article.]
-
Article published online before print. Article, supplemental material, and publication date are at http://www.genome.org/cgi/doi/10.1101/gr.193649.115.
- Received April 26, 2015.
- Accepted September 12, 2016.
This article is distributed exclusively by Cold Spring Harbor Laboratory Press for the first six months after the full-issue publication date (see http://genome.cshlp.org/site/misc/terms.xhtml). After six months, it is available under a Creative Commons License (Attribution-NonCommercial 4.0 International), as described at http://creativecommons.org/licenses/by-nc/4.0/.


