
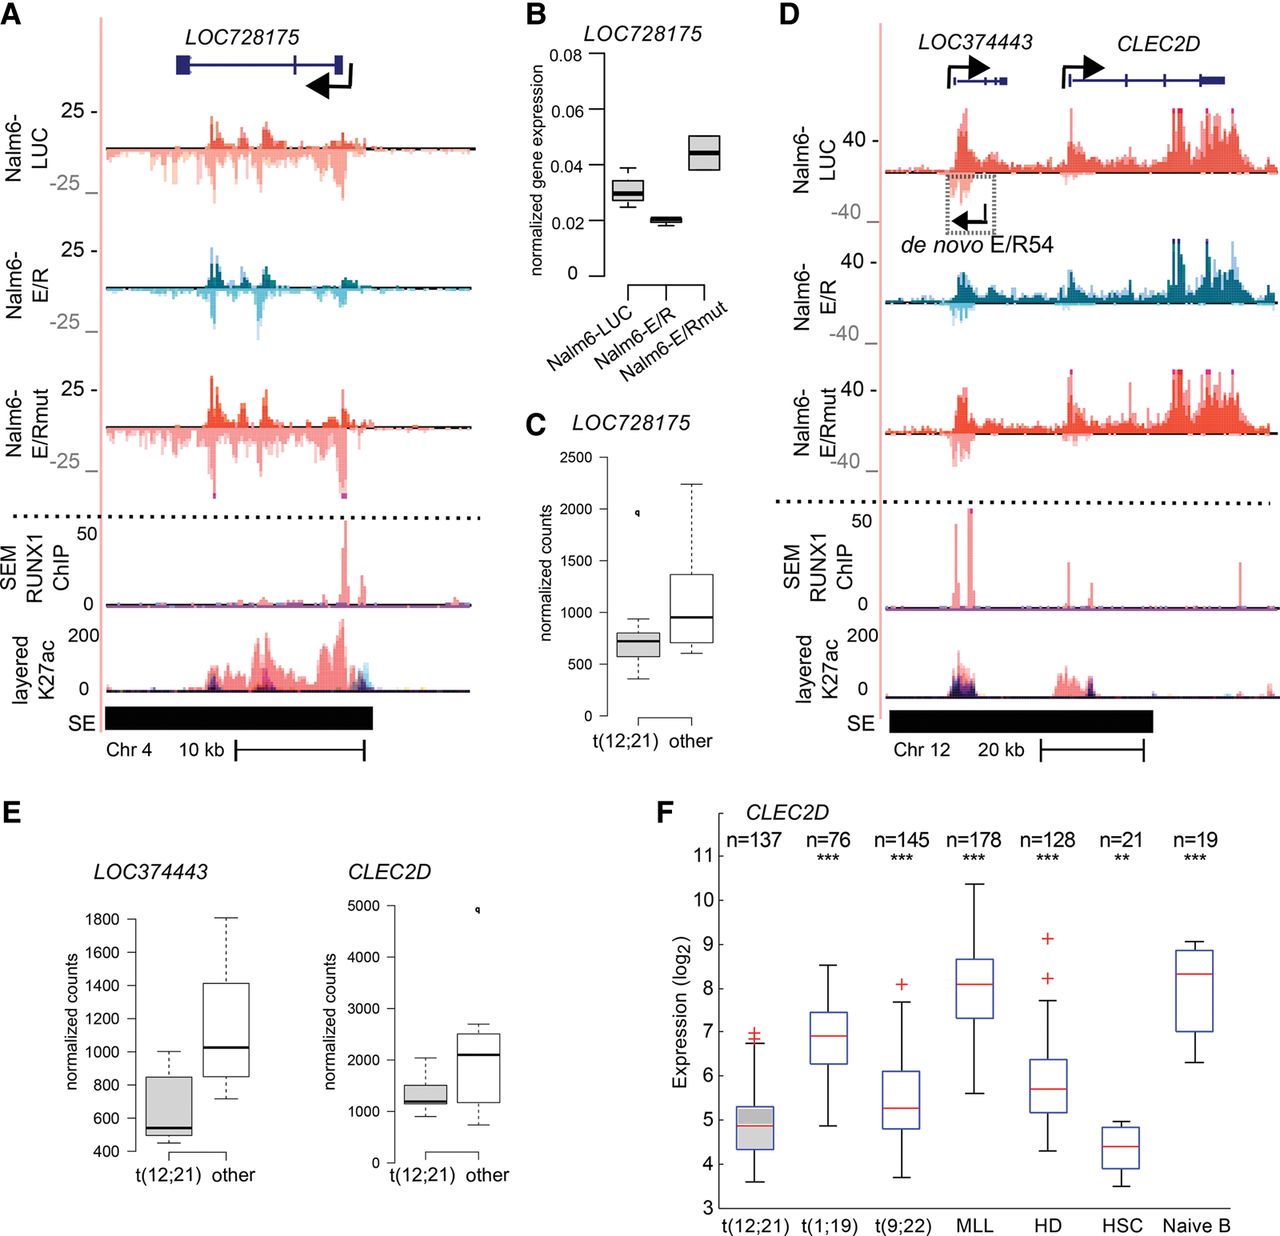
E/R-regulated noncoding genes retain altered expression in patient samples. (A) GRO-seq and ChIP-seq signals (as in Fig. 3E) indicate down-regulation of LOC728175 transcription by E/R, likely through a RUNX1 binding site located at TSS. (B) E/R-mediated down-regulation of LOC728175 in Nalm6-E/R cells as measured by RT-qPCR after 24 h of E/R induction. Expression was normalized to the housekeeping gene GAPDH. A representative experiment is shown with technical variation (lowest and highest datum within 1.5 × IQR). (C) RNA-seq normalized count values for LOC728175 among E/R-positive (t12;21) and E/R-negative (other) patients indicate lower expression in the E/R-positive group (adjusted P-value 0.37; E/R, n = 9; other, n = 8). (D) GRO-seq and ChIP-seq signals shown at a locus containing three repressed genes (LOC374443, CLEC2D, and a de novo transcript E/R54) and colocalizing with RUNX1-binding sites. Tracks are as in Figure 3E. (E) RNA-seq normalized count values for LOC374443 and CLEC2D show that decreased expression is maintained at the diseased state (LOC374443 adjusted P-value 0.020; CLEC2D adjusted P-value 0.027). No reads mapped to E/R54. (F) Combined microarray data indicate repression of CLEC2D among E/R-positive patients. In each comparison, statistical significance (Mann-Whitney U test) was tested against E/R-positive subtype: (***) P < 0.001; (**) P < 0.01. Tukey whiskers are shown for each box plot (1.5 × IQR).


