
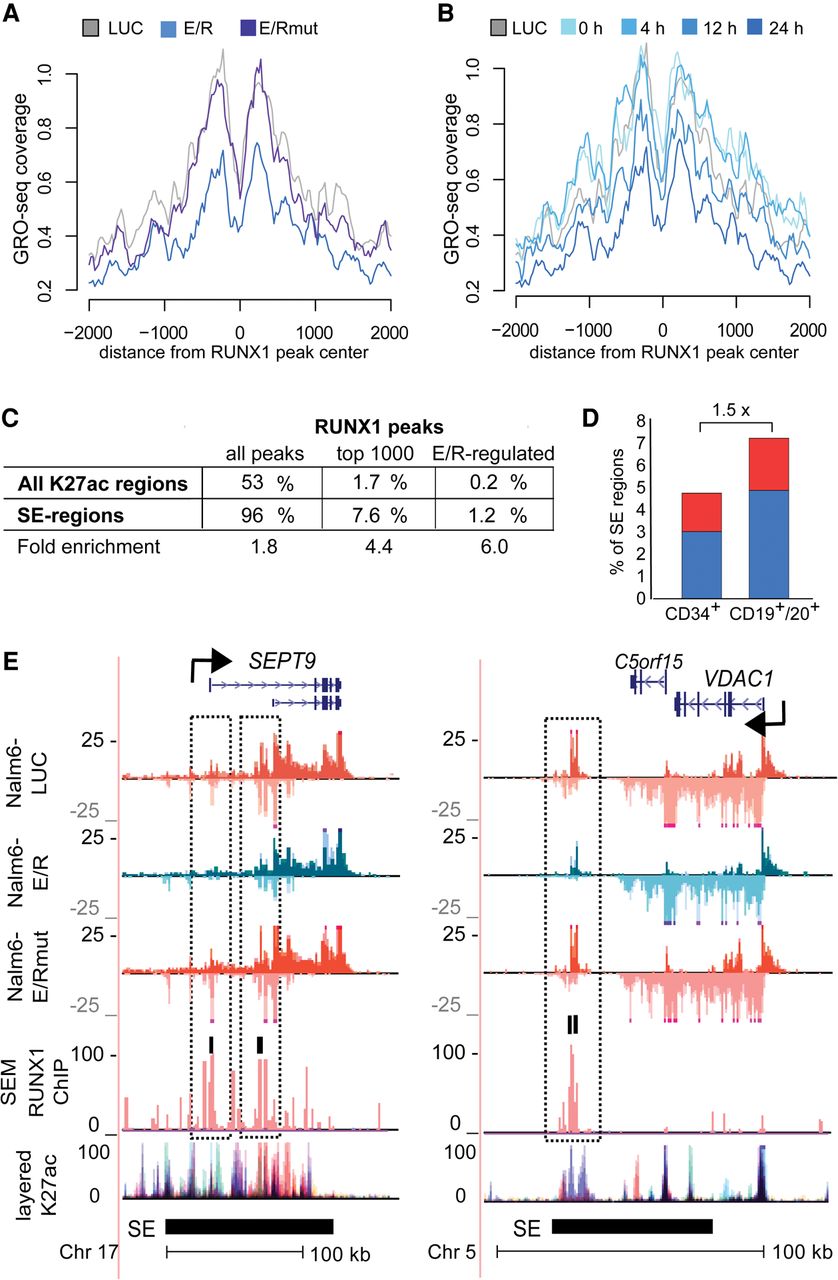
eRNA transcription profiles reveal E/R targets and repression at SE regions. Histograms of GRO-seq coverage are shown at RUNX1-bound genomic regions comparing control (LUC), E/R mutant (E/Rmut), and wild-type E/R samples (A) and across the time series of E/R induction (B). Signal profile represents the most prominent intergenic RUNX1 ChIP peaks from SEM cells centered by the RUNX1 motif. Early repression of eRNAs is evident at the center of RUNX1-bound sites upon expression of E/R but not E/Rmut. (C) Enrichment of RUNX1 ChIP peaks in SEM cells at SE regions over regular H3K27ac regions is shown. The fold enrichment at SE regions is indicated for all peaks (P-value <10−50), top 1000 peaks (P-value 5.2 × 10−44), and E/R-regulated RUNX1 peaks (P-value 1.6 × 10⁻¹⁰). (D) Proportion of E/R-regulated SE regions in CD34+ or CD19+/CD20+ cells is shown as bar plots. Down-regulation and up-regulation are indicated in blue and red, respectively. In total, 37 of 500 SEs in CD19+/CD20+ were regulated by E/R, a 1.5-fold excess compared to CD34+ cells (22 of 452 SEs in CD34+). (E) GRO-seq signal tracks at representative E/R-regulated SEs are shown. Repression of eRNA signal at prominent RUNX1 ChIP peaks (highlighted in the figure) is observed in the vicinity of SEPT9 and VDAC1 genes. Transcript variants 10 and 11 of SEPT9 are shown in the RefSeq track. Two biological replicates of each GRO-seq sample (Nalm6-LUC, Nalm6-E/R, Nalm6-E/Rmut) are shown with different shades of color, and signals above and below the axis indicate plus and minus strands, respectively. RUNX1 ChIP peaks in SEM cells are shown in light red overlaid with the input control in shades of blue and purple. SE track is based on CD19+/20+ cell data from Hnisz et al. 2013. Layered H3K27ac track indicates active enhancers and is shown as an overlaid signal from seven cell lines retrieved from ENCODE (The ENCODE Project Consortium 2012). Color key: GM12878, red; H1-hESC, yellow; HSMM, green; HUVEC, light blue; K562, blue; NHEK, purple; NHLF, pink.


