
Development of a microscopic platform for real-time monitoring of biomolecular interactions
- Yasuhiro Sasuga1,2,
- Tomomi Tani1,
- Masahito Hayashi1,
- Hisashi Yamakawa3,
- Osamu Ohara3,4,5, and
- Yoshie Harada1,2
- 1 The Tokyo Metropolitan Institute of Medical Science, Bunkyo-ku, Tokyo 113-8613, Japan
- 2 Core Research for Evolutional Science and Technology (CREST), Japan Science and Technology Agency (JST), Honcho, Kawaguchi, Saitama 332-0012, Japan
- 3 Department of Human Gene Research, Kazusa DNA Research Institute, Kisarazu, Chiba 292-0818, Japan
- 4 Research Center for Allergy and Immunology, RIKEN Yokohama Institute, Tsurumi-ku, Yokohama, Kanagawa 230-0045, Japan
Abstract
We developed a new microscopic platform for the real-time analysis of molecular interactions by combining microbead-tagging techniques with total internal reflection fluorescent microscopy (TIRFM). The optical manipulation of probe microbeads, followed by photo immobilization on a solid surface, enabled us to generate arrays with extremely high density (>100 microbeads in a 25 μm × 25 μm area), and TIRFM made it possible to monitor the binding reactions of fluorescently labeled targets onto probe microbeads without removal of free targets. We demonstrated the high performance of this platform through analyses of interactions between antigen and antibody and between small compounds and proteins. Then, recombinant protein levels in total cellular lysates of Escherichia coli were quantified from the association kinetics using antibody-immobilized microbead arrays, which served as a model for a protein-profiling array. Furthermore, in combination with in vitro synthesis-coupled protein labeling, we could kinematically analyze the interaction of nuclear factor κB (p50) with DNA. These results demonstrated that this platform enabled us to: (1) monitor binding processes of fluorescently labeled targets to multiple probes in real-time without removal of free targets, (2) determine concentrations of free targets only from the association kinetics at an early phase, and (3) greatly reduce the required volume of the target solution, in principle to subnanoliter, for molecular interaction analysis. The unique features of this microbead-based microarray system open the way to explore molecular interactions with a wide range of affinities in extremely small volumes of target solutions, such as extracts from single cells.
The development of DNA microarray technology has enabled the successful probing of complex transcriptional networks on a genome-wide scale (Rhodes et al. 2002; Beltran et al. 2003; Zheng et al. 2004). In addition, various types of microarrays for monitoring molecular interactions have been developed (de Wildt et al. 2000; Zhu et al. 2001; MacBeath 2002; Wang et al. 2003). However, one critical concern with these conventional microarrays is their limitation to static analysis of molecular interactions. Because conventional microarray systems detect probe binding by quantitative end-point measurements after removal of unbound targets, they are not suited to either kinematic analysis of molecular interactions or to the analysis of interactions with high dissociation rates. A simple approach to address this concern is to monitor the molecular interactions in real-time. Another concern is the analysis of molecular interactions using very small samples. Proteins and/or nucleic acids from a selected subpopulation of cells or even from a single cell can be extracted using new technologies such as laser capture microdissection (Paweletz et al. 2001), microfabricated fluorescence-activated cell sorting (Wang et al. 2005), and other microfluidic systems (Thorsen et al. 2002; Hong et al. 2004). More importantly, recent progress in bioimaging (Sako et al. 2000; Itoh et al. 2002; Murakoshi et al. 2004; Michalet et al. 2005), allowing the study of the dynamic behavior of various proteins in living cells, has increased the need to bridge the gap between bioimaging and biochemistry at the single-cell level. Although DNA microarray technology can achieve mRNA profiling at a single-cell level by artificially amplifying target molecules by in vitro enzymatic reactions, such an approach is not robust and, more seriously, cannot be applied to proteins. A simple approach to address this is to miniaturize the molecular detection platform to the size of a single animal cell.
While real-time monitoring of binding processes and extreme miniaturization of the analysis platform are independent issues, it was our intention to address both of these issues for application to single-cell biology. Here we describe the development of an array-based real-time system using fluorescence imaging technologies for analyzing molecular interactions with extremely small amounts of target molecules. This analysis platform will make it practical to analyze multiple molecular interactions in parallel using subnanoliter samples.
Results
Outline of molecular-interaction analysis using fluorescence microscopy
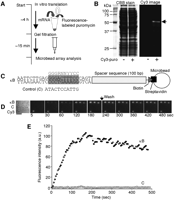
To build a miniaturized array-based real-time analysis system, we selected a microscopic platform based on fluorescence imaging technology. A schematic view of our molecular interaction-monitoring platform is shown in Figure 1A. This system was based on an array of microbeads conjugated with different probes on a glass coverslip. A solution containing fluorescence-labeled target molecules is injected onto the microbead array and the binding of target molecules to the probes is monitored by total internal reflection fluorescence microscopy (TIRFM). Since evanescent excitation selectively illuminates only fluorophores very close to the glass surface (within ≤150 nm) (Funatsu et al. 1995; Axelrod 2003), it is possible to track the binding reaction of the target molecules to the probe microbeads with a high signal-to-background noise ratio and without removal of the target molecules in solution. The fluorescence of the microbeads is monitored in real-time by a CCD camera with an image intensifier.
Microbead array fabrication
Because the illumination area in objective lens-assisted TIRFM is restricted to a circular area with a diameter of 60–100 μm, we fabricated microbead-based arrays to fit this area using optical trapping followed by photo-cross-linking onto a glass surface. The fabrication procedures for microbead arrays are schematically shown in Figure 1, B and C. The advantages of this approach over direct immobilization of probes onto a glass surface are (1) high spatial resolution, (2) higher density of probes molecules on the microbeads, and (3) high-fabrication reproducibility because the same batch of microbeads can be used for the fabrication of a huge number of arrays.
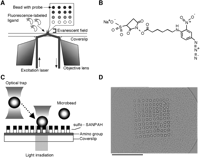
Molecular interaction analysis using a microscopic platform. (A) Schematic drawing of the imaging strategy for detection of the molecular interactions. Proteins, nucleotides, or other biomolecules are immobilized onto the surface of microbeads, and the microbeads are arrayed on a glass coverslip. A solution containing fluorescently labeled target molecules is injected into the microbead array and the fluorescence, which binds to probe molecules on the surface of microbeads, is observed by objective lens-type total internal reflection fluorescence microscopy. (B) The chemical structure of sulfo-SANPAH (sulfosuccinimidyl 6-[4′-azido-2′-nitrophenylamino] hexanate). Bifunctional cross-linking reagent, sulfo-SANPAH, has NHS ester and nitrophenyl azide, which react with amino groups and is activated by the light irradiation, respectively. (C) Schematic diagram of microbead array fabrication. The amino group coated coverslip is conjugated with sulfo-SANPAH by its NHS ester. A microbead is captured by using an optical trap and carried to the fixing position. In the final step, the area where the microbead was carried is activated by light irradiation (300–360 nm) and the microbead is fixed at this position. (D) Microscopic image of a microbead array. The 100 microbeads (10 × 10 pattern) arrayed on a coverslip are shown. The mean diameter of microbeads was 0.95 μm. Scale bar, 20 μm.
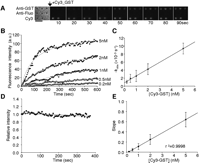
Analysis of antigen binding to antibody. (A) Microscopic images showing the binding of Cy3-labeled GST to the antibody-conjugated microbead array. Anti-GST and anti-fluorescein (fluo) antibody coated microbeads were arrayed on a coverslip, and Cy3-labeled GST (2 nM) was injected. (Left) The bright-field image of antibody-conjugated microbead array and others show the Cy3-fluorescence images. Cy3-conjugated microbeads (Cy3) were used as a marker for fluorescence imaging. Scale bar, 5 μm. (B) Concentration dependence of the association of Cy3-labeled GST to anti-GST antibody. Various concentrations of Cy3-labeled GST were added to the antibody-conjugated microbead arrays. Images were collected at 5-sec intervals. The symbols represent the mean fluorescence intensities from six different microbeads. Gray lines represent the nonlinear fitted curves. (C) Plot of –kobs against concentrations of Cy3-labeled GST. (D) Determination of dissociation rate constant of Cy3-labeled GST from anti-GST antibody. After monitoring the binding phase, the buffer without Cy3-labeled GST was replaced and the observation was continued. Relative fluorescence intensities of dissociation of Cy3-labeled GST from anti-GST antibody-immobilized microbeads are shown. The symbols represent the mean relative intensities from six different microbeads. (E) Plots of slope values in the initial association phase against concentrations of Cy3-labeled GST. Error bars represent standard deviation from the average observed value from six different microbeads at each concentration. Straight lines represent the fitted linear regressions.
As an example, Figure 1D shows the array pattern of 100 polystyrene microbeads (diameter of 0.95 μm, bead-to-bead spacing in a range of 2μm) within a 25 μm × 25 μm area of a coverslip. Small microbead size and small pitch values are the keys to miniaturization and to meeting the requirements for parallel detection of more than 100 interactions using TIRFM.
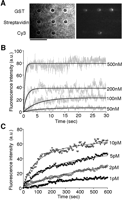
Analysis of the binding of low-molecular-weight molecules. GST and streptavidin coated microbeads were arrayed on a coverslip and the binding of Cy3-labeled GSH or biotin was monitored. (A) Microscopic images showing the binding of Cy3-labeled GSH to the protein-conjugated microbead array after the exposure to 200 nM Cy3-labeled glutathione for 30 sec. (Left) The bright-field image; (right) the Cy3-fluorescence image. Cy3-conjugated microbeads (Cy3) were used as a marker for fluorescence imaging. Scale bar, 5 μm. (B) Concentration dependence of the association of Cy3-labeled GSH to GST. Various concentrations of Cy3-labeled GSH were injected onto the protein-conjugated microbead arrays. Fluorescence images were collected at video rate. Gray lines represent the mean fluorescence intensities from three different microbeads. Black lines represent the nonlinear fitted curves. (C) The binding of Cy3-labeled biotin to streptavidin. Various concentrations of Cy3-labeled biotin were injected onto the protein-conjugated microbead arrays. Fluorescence images were collected at 5-sec intervals. The symbols represent the mean fluorescence intensities from four different microbeads. Black lines represent the nonlinear fitted curves.
Analysis of the binding of antigen to antibody on microbeads
In order to evaluate the performance and applicability of this new microbead-based array platform for the detection of molecular interactions, we first monitored the binding of glutathione S-transferase (GST) to anti-GST antibody. Anti-GST and anti-fluorescein antibody-coated microbeads were arrayed on a coverslip and Cy3-labeled GST (Cy3-GST) was applied as the target onto this platform. Cy3-GST bound readily to anti-GST antibody-coated beads, whereas no binding was observed to anti-fluorescein antibody-coated beads (Fig. 2A). The fluorescence intensity of the anti-GST antibody-coated microbead increased dose and time dependently (Fig. 2B). The analysis of the binding phase gave an association rate constant (kass) of 1.7 × 10⁶ (M–1 s–1) according to equation 1 (see Methods; Fig. 2C). The dissociation rate constant (kdiss) of 2.2 × 10⁻⁴ (s–1) according to equation 2 (see Methods) was also determined directly from the dissociation phase of Cy3-GST (Fig. 2D). From these rate constants, the dissociation constant (KD) was calculated to be 1.3 × 10⁻¹⁰ (M).
In the initial association phase (up to ∼150 sec; Fig. 2B), we noticed that fluorescence intensity increased linearly. Each plot was thus fitted with a line to estimate the slope values, which were plotted against the concentrations of Cy3-GST (Fig. 2E). The results indicated that the slope values increased proportionally with Cy3-GST concentration (regression fitting provided a correlation coefficient of 0.9998), implying that the correct antigen concentrations can be estimated only from the analysis of the early association phase.
Detection of the binding of low-molecular-weight molecules
Mass-sensing sensor chip analysis, e.g., with a surface plasmon resonance (SPR) detector, is frequently used for real-time monitoring of molecular interactions. One of the drawbacks of this technique is low sensitivity to binding of small molecules. In contrast to this, the detection sensitivity for target molecules in our monitoring platform should be, in principle, independent of their molecular mass. To check whether or not our platform is applicable to the analysis of low-molecular-weight molecules, we examined the bindings of glutathione (GSH) to GST. The fluorescence images were collected at video rates, since the binding reaction reached equilibrium very rapidly. While Cy3-GSH bound to GST-coated microbeads as expected, no binding was observed on streptavidin-coated beads (Fig. 3A). Figure 3B shows the time course of the binding of the Cy3-GSH to GST at several concentrations (50–500 nM) of Cy3-GSH. The KD value of Cy3-GSH to GST obtained from these results was 1.3 × 10⁻⁶ (M), which roughly agrees with those obtained in previous studies using 35S-labeled GSH or other GSH derivatives (Jakobson et al. 1979; McHugh et al. 1996). Thus, the microbead-based array platform enabled us to successfully monitor the binding of low-molecular-weight molecules. If test samples have a low dissociation constant, such as biotin–streptavidin binding (KD,10–15 M), the detection limit of the sample concentration would become much lower than the GSH–GST interaction. In fact, in the case of the binding of Cy3-labeled biotin to streptavidin, we succeeded in detecting binding at 1 pM of Cy3-labeled biotin (Fig. 3C).
Application of microbead arrays for the quantification of a specific protein in a complex protein mixture
The binding reaction of a single type of fluorescently labeled target onto microbeads was successfully monitored as described above. We then investigated whether we could detect specific targets among a large number of nontarget fluorescently labeled molecules, a crucial task when using our system for quantitative proteomics in an antibody-array format. As a model system, we measured the production levels of recombinant GST in Escherichia coli using an antibody-conjugated microbead array. A soluble fraction was recovered from the lysate of E. coli harboring an IPTG-inducible GST expression plasmid in the presence and absence of IPTG, and allowed to react with amino-reactive Cy3 dye. After removal of free Cy3 dye, the Cy3-labeled proteins (Fig. 4A) were then applied onto an antibody-conjugated microbead array. The increase in fluorescence intensity of anti-GST antibody-conjugated microbeads over time was found to be greater in the presence, than in the absence, of IPTG. On the other hand, there was no detectable fluorescence on the anti-fluorescein antibody-conjugated microbeads when lysates with and without IPTG induction were analyzed (Fig. 4B,C). From the association kinetics in the early phase (∼150 sec), the expression level of GST produced in the presence of IPTG was found to be four times higher than that in the absence of IPTG (Fig. 4D). These results were in essential agreement with that of protein blot analysis using the same samples and antibodies (Fig. 4E).
Analysis of protein–DNA interactions using a fluorescently labeled protein produced in vitro
In the experiments described above, a protein of interest was purified to homogeneity and then chemically labeled. In practical use, this could constitute a bottleneck in overall analysis and, more importantly, would greatly reduce the advantage of our platform, which requires only nanogram amounts of the labeled protein, whereas conventional biochemical purification techniques typically have yields in the microgram range. To address this issue, we took advantage of a cell-free translation system with fluorescently labeled puromycin (Nemoto et al. 1999; Miyamoto-Sato et al. 2000; Doi et al. 2002). Figure 5A shows a schematic drawing of the procedure for synthesis and analysis of the Cy3-labeled protein using the cell-free translation system. We tested whether this method could be used to analyze the interaction between the transcription factor, NFκB p50, and double-stranded DNA. A single Cy3-fluorescent band of in vitro synthesized p50 with apparent molecular weight of 50 kDa (Cy3-p50) was observed by SDS-PAGE (Fig. 5B). The concentration of Cy3-p50 was estimated to be 480 nM from the fluorescence intensity of the band. To analyze the binding kinematics of Cy3-p50 to the κB sequence (Ghosh et al. 1990; Kunsch et al. 1992), biotinylated double-stranded DNAs containing a consensus κB sequence and control sequence with a 100-bp spacer sequence were bound to streptavidin-coated microbeads (Fig. 5C) and arrayed on a coverslip. The synthesized Cy3-p50 was applied to the DNA-conjugated microbead array and binding to the DNA was monitored. Then, the solution with Cy3-p50 was replaced by the same buffer solution, but without Cy3-p50 and the observation was continued in order to monitor dissociation of Cy3-p50 from the beads. While Cy3-p50 bound to DNA strands containing a κB motif, no binding was observed in the case of control DNA (Fig. 5D,E). Association/dissociation rate constants were estimated by curve-fitting (George et al. 1995) based on kinetic interaction data of the binding of Cy3-p50 to the consensus κB sequence as kass = 4.2 × 10⁶ (M–1 s–1) and kdiss = 8.1 × 10⁻⁴ (s–1). This data is in agreement with the previous study measured by SPR analysis (Hart et al. 1999). Next, in order to analyze the binding characteristics of Cy3-p50 to the κB sequence, several mutated κB sequences were used (Fig. 6A). The results of the association and dissociation of Cy3-p50 and DNA-conjugated microbeads are shown in Figure 6, B,C,D, (see Supplemental Video). The kdiss values for single-nucleotide mutant variants were significantly higher than those of the consensus κB sequence, whereas the difference in kass was small (Fig. 6D). The kdiss values for G2A, G3A, and A4T obtained were 8.9 × 10⁻² (s–1), 8.8 × 10⁻³ (s–1), and 1.0 × 10⁻² (s–1), respectively. In particular, the dissociation of p50 from G2A was 100 times higher than that of the wild-type κB sequence. The results thus indicated that the guanosine on position 2 (G2) is extremely important for high-affinity binding of p50 to the κB sequence within the wild-type κB sequence, 5′-GGGACTTTCC-3′. This is consistent with previous findings from crystallography (Ghosh et al. 1995; Berkowitz et al. 2002) and DNA microarray-based studies (Wang et al. 2003). Our real-time analysis revealed for the first time that G2 played a crucial role in stabilizing the complex of p50 to the κB sequence.
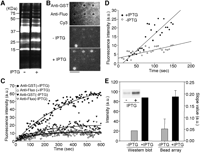
Analysis of protein expression levels in E. coli using antibody-conjugated microbead arrays. (A) Cy3-labeled soluble proteins from two types of pGEX-transformed E. coli, one inducing by 1mM IPTG (+) and the other not (–). Cy3-labeled soluble proteins were analyzed using 12.5% SDS-PAGE with a fluorescence imaging analyzer. The Cy3-fluorescence image is shown. (B) Microscopic images showing the binding of Cy3-labeled soluble proteins to the anti-GST or anti-fluorescein (fluo) antibody-conjugated microbeads after the exposure to 20 nM (in terms of Cy3 concentration; protein concentration, 0.1 μg/mL) Cy3-labeled proteins for 600 sec. (Top) The bright-field image of an antibody-conjugated microbead array. (Middle, bottom) The Cy3-fluorescence images. A Cy3-conjugated microbead (Cy3) was used as a marker for fluorescence imaging. Scale bar, 5 μm. (C) Time courses of the association of Cy3-labeled proteins with anti-GST or anti-fluo antibody. Fluorescence images were collected at 5-sec intervals. The data represent the mean fluorescence intensities from three different microbeads. The black lines represent the fitted nonlinear curves. (D) Analysis of the binding of Cy3-labeled proteins to anti-GST antibody in the early association phase. The slope values in early association phase (∼150 sec) were obtained by a linear fitting procedure. (E) Comparison of GST expression levels by Western blot analysis and antibody-conjugated microbead array analysis. Western blot analysis: Cell lysates were separated by 12.5% SDS-PAGE and analyzed with anti-GST antibody. The protein band intensities are shown. Bead array analysis: The slope values in the early association phase (∼150 sec) are shown. (Inset) A fluorogram of the Western blot. Error bars represent standard deviation from the average slope values observed from three different microbeads.
Analysis of protein–DNA interactions. (A) A schematic drawing of the procedure for the synthesis and the analysis of the Cy3-labeled protein using an in vitro translation system. The mRNA-encoding protein without a stop codon was added to the cell-free translation solution with fluorophore-conjugated puromycin. Unreacted puromycin was removed by gel filtration. The translated solution was applied to the microbead array without further purification. (B) Cy3-labeled NFκB p50. In vitro translation reaction was carried out in the presence of the template mRNA and 40 μM Cy3-conjugated puromycin (Cy3-puro). The product was analyzed by 10% SDS-PAGE with a fluorescence image analyzer. After fluorescence detection, the gel was stained by CBB. (C) Target DNA-conjugated microbead constructions. Two types of DNA labeled with biotin were immobilized on the surface of streptavidin-coated microbeads, one containing a κB motif (κB) and the other not (control). The gray box represents a κB motif and the gray letters indicate κB consensus sequence. In control DNA, the sequence of the gray box is replaced with the control sequence. (D) Microscopic images showing the binding of Cy3-labeled NFκB p50 to the DNA-conjugated microbead array. Cy3-labeled NFκB p50 (2 nM) was injected. (Left) The bright-field image of the DNA-conjugated microbead array and others show the Cy3-fluorescence images. A Cy3-conjugated microbead (Cy3) was used as a marker for fluorescence imaging. After monitoring the association phase (180 sec), the buffer without Cy3-labeled NFκB p50 was replaced and observation continued for the following 300 sec. Images were collected at 5-sec intervals. Scale bar, 5 μm. (E) Time courses of the association and dissociation of Cy3-labeled NFκB p50 to κB or control DNA. The data represents the mean fluorescence intensities from three different microbeads. The gray lines represent the nonlinear fitted curves.
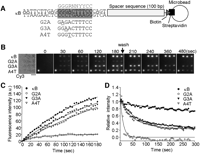
Parallel analyses of NFκB p50 bindings to κB sequence variants. (A) Target DNA-conjugated microbead constructions. Four types of DNA labeled with biotin were immobilized on the surface of streptavidin-coated microbeads, one containing a κB motif (κB) and the others containing single-nucleotide mutant sequences (G2A, G3A, and A4T). The gray box represents a κB motif and the gray letters indicate κB consensus sequence. In the mutant DNA, the sequence of the gray box is replaced with each single-nucleotide mutant sequence. The mutated position is underlined. (B) Microscopic images showing the binding of Cy3-labeled NFκB p50 to the DNA-conjugated microbead array. Cy3-labeled NFκB p50 (2 nM) was injected. (Left) The bright-field image of a DNA-conjugated microbead array and the others show the Cy3-fluorescence images. A Cy3-conjugated microbead (Cy3) was used as a marker for fluorescence imaging. After monitoring the association phase (180 sec), the buffer without Cy3-labeled NFκB p50 was replaced and the observation was continued for the following 300 sec. Images were collected at 5-sec intervals. Scale bar, 5 μm. (C) Time courses of the association of Cy3-labeled NFκB p50 to κB or mutant DNA. The data represents the mean fluorescence intensities from three different microbeads. The black lines represent the nonlinear fitted curves. (D) Time courses of the dissociation of Cy3-labeled NFκB p50 from κB or mutant DNA. The data represents the mean fluorescence intensities from three different microbeads. The black lines represent the fitted nonlinear curves.
Discussion
In this study, we developed a novel platform for the detection of molecular interactions based on the combination of fluorescence imaging techniques with an ultra-dense microbead array assembled by optical manipulation. Using evanescent illumination for the detection of fluorescence-labeled target molecules, we succeeded in monitoring molecular interactions in real-time with high sensitivity, regardless of their molecular masses.
A combination of optical trapping of microbeads followed by photo-cross-linking enabled us to covalently fix microbeads onto a glass coverslip in any desired pattern. Because the density of this microbead array is 500–1500 times higher than the probe density in conventional microarrays (Lipshutz et al. 1999; Okamoto et al. 2000; Pellois et al. 2002), this platform is applicable, at least in principle, to sample volumes in the subnanoliter range, which is close to the volume of a single animal cell. If these microbeads are arrayed on the bottom of a picoliter-volume well (e.g., 20 μm × 20 μm × 20 μm), which is successfully connected to a microfluidic sample preparation module (Thorsen et al. 2002; Hong et al. 2004), our platform might offer a new approach for single-cell analysis. The sensitivity of this analysis platform is solely determined by the affinity between probe and target. For example, if we tried to detect the target molecules using an antibody array in a picoliter-volume well, the detection limit of the target molecules would be several hundred molecules per cell, since the detection limit of Cy3-labeled molecules using an antibody array is as low as 0.1 nM, as demonstrated in this study. This detection limit is considered to be low enough to monitor protein profiles of major proteins in a single cell.
Although microbeads have been used in various ways in microarray technology, the use of covalently immobilized microbeads on a glass surface is, to our knowledge, new. The microarray format described by Gunderson et al. (2004) is apparently similar to ours, but unlikely, in the current format, to be compatible with TIRFM. However, it is possible that in the future, the combination of their random arraying microbead technology with our photo-immobilization method might produce a TIRFM-compatible microarray system with a large number of microbeads. Their idea of decoding microbeads after random arraying might address the problem of fabrication throughput with our method. Another possible way of addressing this issue could be by using recently developed optical manipulation techniques that create a large number of optical traps using a computer-generated hologram (Curtis et al. 2002) and a Bessel beam (Garcés-Chávez et al. 2002). These techniques would allow trapping of multiple particles and reconfiguration with dynamic trapping patterns. If such a multiple trapping system were combined with a microfluidic bead sorter, such as a cell sorter, it might be possible to rapidly assemble a large number of probe beads.
A common concern with protein arrays is how to prepare probe proteins and targets. Since this concern is important to researchers, many groups have attempted to prepare a set of cDNAs that can produce all of the proteins encoded by the genome. This is conventionally called ORFeome cloning (Reboul et al. 2003; Vaglio et al. 2003; Brasch et al. 2004). If such a set of cDNAs becomes available, it would be straightforward to prepare probe microbeads, e.g., by self-assembling methods (He and Taussig 2001; Weng et al. 2002; Ramachandran et al. 2004). In the same way, the preparation of fluorescently labeled target proteins also becomes straightforward as demonstrated in this study (Figs. 5, 6), by using in vitro protein synthesis-coupled fluorescent labeling (Nemoto et al. 1999; Miyamoto-Sato et al. 2000; Doi et al. 2002).
In conclusion, we established a method for the generation of extremely high-density arrays based on the photo-immobilization of microbeads and confirmed that the resulting arrays could be successfully used for quantitative measurements of protein–protein, small compound–protein, and protein–DNA interactions in real-time. Our system has several unique features compared with conventional molecular interaction monitoring systems, i.e., (1) requirement of only a subnanoliter-scale reaction volume for the interaction analysis, (2) highly sensitive and real-time monitoring of molecular interactions, and (3) parallel monitoring of multiple binding reactions. Together with novel microfluidic techniques for sample preparation, our approach has the potential to offer a basic tool for biological and medical applications that demand the parallel analysis of multiple molecular interactions in subnanoliter sample volumes.
Methods
Fabrication of microbead array
Washed coverslips (24 mm × 32 mm, Matsunami glass) were treated with amino silane solution (5% 3-aminopropyltriethoxysilane, 2.9% H2O, 1 mM HCl in ethanol), which was polymerized overnight at room temperature. After washing with water and drying, a flow-cell was constructed from a bottom aminosilanized coverslip and a top coverslip (18 mm × 18 mm, Matsunami glass), separated by two adhesive tapes (Nichiban). The chamber volume was about 10 μL. Sulfo-SANPAH (Pierce) solution (0.01 mg/mL in 0.1 M Na-phosphate buffer, pH 7.2) was poured into the flow-cell and incubated for 20 min. After flushing with PBS buffer (8000 mg/L NaCl, 200 mg/L KCl, 1150 mg/L Na2HPO4, 200 mg/L KH2PO4), the sulfo-SANPAH treated flow-cell was incubated with blocking solution (1 mg/mL dephosphorylated α-casein [Sigma] in PBS buffer) for 15 min. Protein or DNA-conjugated microbeads (see below) were placed into the flow-cell and a single microbead was captured by an optical trap. After moving to a fixing position, the microbead was put on the glass surface and illuminated with UV (300–360 nm) light for 1–5 sec. After fixing with UV light, free microbeads were washed away with PBS buffer. Then, microbeads coated with other test probes were injected, captured, and fixed one by one to create an array of heterogeneous spots. Microbeads were aligned and fixed at 2–5-μm intervals.
Preparation of probe-conjugated microbeads
Protein A, streptavidin, and GST, respectively, were fixed to carboxylated polystyrene microbeads by a chemical cross-linking reaction (see Supplemental Methods). Antibody-conjugated microbeads were prepared as follows: Anti-GST (sc-459, Santa Cruz) or anti-fluorescein (Rockland) antibodies were first trapped on protein A-conjugated microbeads, and then cross-linked with protein A using 6.5 mg/mL DMP (Pierce) in 0.2 M triethanolamine (pH 8.2). DNA-conjugated microbeads were prepared as follows. The 128-bp DNA fragments carrying the NFκB-binding sequence, or its variant sequences, were prepared by PCR from the template plasmids using oligonucleotides (top strand, see Supplemental Methods) and a biotin-labeled oligonucleotide (biotin-5′-CTCGTATGTTGTGTGGAATTGTG-3′). The biotin-labeled PCR products (50 ng/μL) were captured on streptavidin-conjugated microbeads to generate DNA probe microbeads.
Fluorescent labeling of target molecules
Purified GST was mixed with amino-reactive Cy3-dye (Amersham Bioscience) in a ratio of 1:3 in PBS buffer for 1 h at room temperature. Free Cy3-dye was removed by a NAP-5 column (Amersham Bioscience). The molar ratio of GST:Cy3 dye was 1:1. GSH and biotin-x-cadaverin, respectively, were labeled with SH-reactive Cy3 dye (Amersham Bioscience) and amino-reactive Cy3 dye in a ratio of 1:3 for 2 h at room temperature. The Cy3-labeled GSH and biotin were purified by thin-layer chromatography (TLC), as described by Wang et al. (2000) with slight modifications (see Supplemental Methods). Soluble proteins in E. coli expressing GST were labeled with Cy3-dye as follows: E. coli (DH5α) transformed with pGEX 6p-1 was cultured overnight at 37°C. GST expression was induced with 1 mM IPTG at 37°C, and the cells were grown for another 30 min. Cultured cells in the absence of IPTG were used as a control. One-milliliter cultures were disrupted by freeze-thawing. Aliquots of soluble fraction were labeled with amino-reactive Cy3-dye in PBS buffer for 30 min at room temperature. Unreacted Cy3-dye was removed by gel filtration with Sephadex G-25 (Amersham Bioscience) equilibrated with PBS buffer.
Immunoblotting
SDS gel electrophoresis was carried out using a 12.5% polyacrylamide gel. Cy3-labeled soluble proteins from E. coli either induced by IPTG or not, were electrophoretically transferred to Hybond PVDF membrane (Amersham Bioscience) and reacted with a primary rabbit polyclonal antibody against GST followed by a secondary antibody of horseradish peroxidase linked anti-rabbit IgG (Amersham Bioscience). The protein band of GST was detected with the ECL-plus detection system (Amersham Bioscience) and analyzed with ChemiDoc (Bio-Rad Laboratories).
Synthesis and labeling of NFκB p50 using a cell-free translation system
One microgram of template plasmid (see Supplemental Methods) linearized with XhoI was transcribed in 20 μL of T7 transcription mix (Promega) for 30 min at 37°C. The transcript was purified by RNeasy (Qiagen). In vitro translation was carried out in Wheat Germ extract (Proteios, Toyobo) with 3 μg of template RNA in 25 μL of reaction mixture containing Cy3-puro (see Supplemental Methods) at a final concentration of 40 μM for 4 h at 26°C. Unreacted Cy3-puro was removed by gel filtration with Sephadex G-50 (Amersham Bioscience) equilibrated with PBS buffer. The translated solution was separated by SDS-PAGE, and the synthesized Cy3-p50 was confirmed by Molecular Imager FX (Bio-Rad Laboratories). The concentration of the labeled protein was determined from the values of fluorescence intensity compared with a known labeling ratio of purified Cy3-labeled protein.
Microscope
An inverted microscope (IX-70, Olympus) was modified to fit the microbead array platform. Nd:YAG laser (IRCL1000-1064, 500 mW, CrystaLaser LC) and UV light from a mercury lamp sent through a pinhole (diameter 5 μm, PA-5, SIGMA KOKI), respectively, were used for the optical manipulation and the activation of sulfo-SANPAH. These laser and UV lights were shone into the microscope with the aid of optical filters and focused on the objective plane through the objective lens (UApo/340 40×, N.A. = 1.35, Olympus). A 532-nm Nd:YAG laser (GCL-050-L, 500 mW, CrystaLaser LC) was used for fluorescence excitation through the objective lens (PlanApo 100×, N.A. = 1.40, Olympus), and evanescent wave illumination was used. Excitation light intensity and exposure time were controlled by neutral density filters and a mechanical shutter. Bright-field and fluorescence images were captured by an EB-CCD camera (Hamamatsu Photonics) with an image intensifier (VS4-1845, VideoScope). The acquired images were recorded on DV-videotape using a videocassette recorder (DSR-11, Sony).
Experimental protocols
The following buffers were used: binding buffer I (10 mM HEPES, 150 mM NaCl, 3 mM EDTA, 0.005% Tween 20, 1 mg/mL dephosphorylated α-casein at pH 7.4) for analyses of GST, GSH, biotin, or soluble proteins; binding buffer II (10 mM HEPES, 150 mM NaCl, 3 mM EDTA, 0.005% Tween 20, 1 mg/mL dephosphorylated α-casein, 0.02 mg/mL poly [dI-dC] [Amersham Bioscience] at pH 7.4) for NFκB analysis. The Cy3-labeled targets were diluted with respective binding buffers. Just before observation, an oxygen scavenger system (Harada et al. 1990) was added to prevent fluorescence bleaching. After the fabrication of the microbead array, 10 μL of the target solution was injected into the flow cell and the binding of Cy3-labeled targets with probe-conjugated microbeads was observed. After monitoring over specified periods of time, buffer without Cy3-labeled targets was injected using a peristaltic pump (205S, Watson-Marlow Bredel Pumps) at a flow rate of 100 μL/min to monitor the dissociation phase. Fluorescence images were collected every 5 sec (exposure time of 1/8 sec) or video rate. All reactions were observed at 30°C. The quantitative measurements of fluorescence intensity were performed with Meta Imaging Software (Molecular Devices).
Data analysis
Changes in curve-fitted fluorescence intensity (FI) value at the association phase were converted to a plot of FI versus time
(t). The slopes of the dFI/dt-versus-FI plots represent the observed association rate, –kobs. A plot of –kobs against a concentration of injected target allows kass and kdiss to be determined from equation 1:  where kass, kdiss, C are the association rate constant, the dissociation rate constant, and the concentration of injected target, respectively.
The kdiss can also be measured in the buffer without target after the observed association phase. Since the concentration of the target
is zero, equation 2 describes first-order kinetics:
where kass, kdiss, C are the association rate constant, the dissociation rate constant, and the concentration of injected target, respectively.
The kdiss can also be measured in the buffer without target after the observed association phase. Since the concentration of the target
is zero, equation 2 describes first-order kinetics: 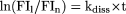 where FI1 and FIn are the fluorescence intensities at the end of binding (time t1) and at the time tn, and t equals tn-t1.
Acknowledgments
This work was supported in part by a research grant from Core Research for Evolutional Science and Technology (CREST) of the Japan Science and Technology Agency (JST), by a Grant-in-Aid for Scientific Research by the Ministry of Education, Culture, Sports, Science, and Technology of Japan (to Y.H.), and by the Human Frontier Science Program (to Y.H.). Y.H. also acknowledges the financial support from the Toray Science Foundation. We thank Dr. Toshiki Tanaka for his suggestion of purifying puromycin and Dr. Naoto Nemoto for his advice on the synthesis of amino-dC-puromycin.
Footnotes
-
[Supplemental material is available online at www.genome.org.]
-
Article published online ahead of print. Article and publication date are at http://www.genome.org/cgi/doi/10.1101/gr.4235806.
-
↵5 Corresponding author. E-mail ohara{at}kazusa.or.jp; fax 81-438-52-3914.
-
- Accepted August 23, 2005.
- Received June 6, 2005.
- Cold Spring Harbor Laboratory Press


