
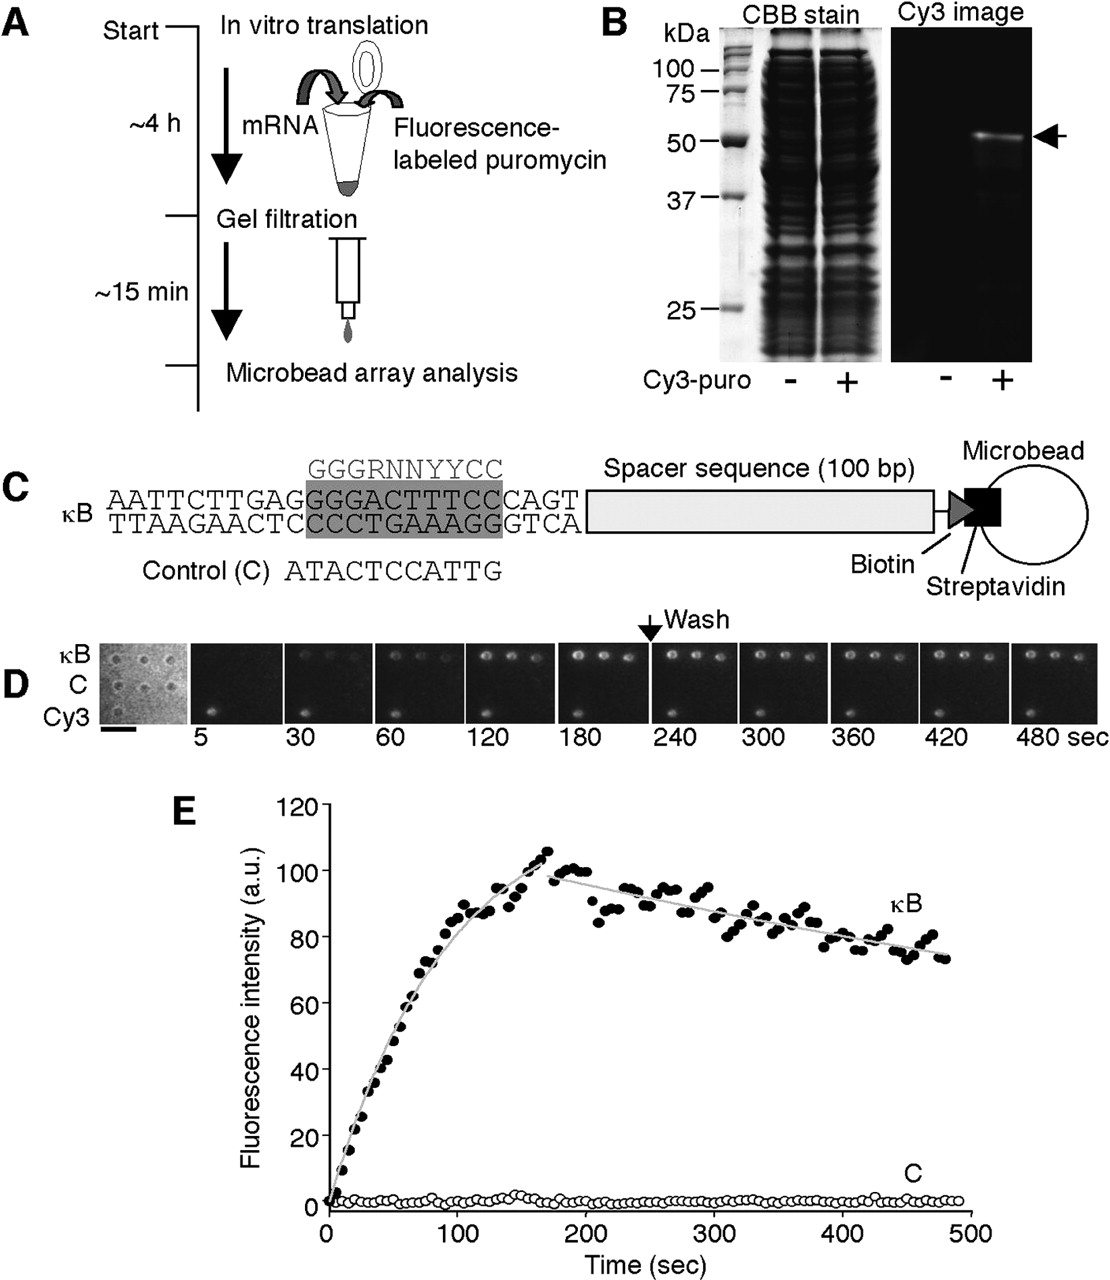
Analysis of protein–DNA interactions. (A) A schematic drawing of the procedure for the synthesis and the analysis of the Cy3-labeled protein using an in vitro translation system. The mRNA-encoding protein without a stop codon was added to the cell-free translation solution with fluorophore-conjugated puromycin. Unreacted puromycin was removed by gel filtration. The translated solution was applied to the microbead array without further purification. (B) Cy3-labeled NFκB p50. In vitro translation reaction was carried out in the presence of the template mRNA and 40 μM Cy3-conjugated puromycin (Cy3-puro). The product was analyzed by 10% SDS-PAGE with a fluorescence image analyzer. After fluorescence detection, the gel was stained by CBB. (C) Target DNA-conjugated microbead constructions. Two types of DNA labeled with biotin were immobilized on the surface of streptavidin-coated microbeads, one containing a κB motif (κB) and the other not (control). The gray box represents a κB motif and the gray letters indicate κB consensus sequence. In control DNA, the sequence of the gray box is replaced with the control sequence. (D) Microscopic images showing the binding of Cy3-labeled NFκB p50 to the DNA-conjugated microbead array. Cy3-labeled NFκB p50 (2 nM) was injected. (Left) The bright-field image of the DNA-conjugated microbead array and others show the Cy3-fluorescence images. A Cy3-conjugated microbead (Cy3) was used as a marker for fluorescence imaging. After monitoring the association phase (180 sec), the buffer without Cy3-labeled NFκB p50 was replaced and observation continued for the following 300 sec. Images were collected at 5-sec intervals. Scale bar, 5 μm. (E) Time courses of the association and dissociation of Cy3-labeled NFκB p50 to κB or control DNA. The data represents the mean fluorescence intensities from three different microbeads. The gray lines represent the nonlinear fitted curves.


