
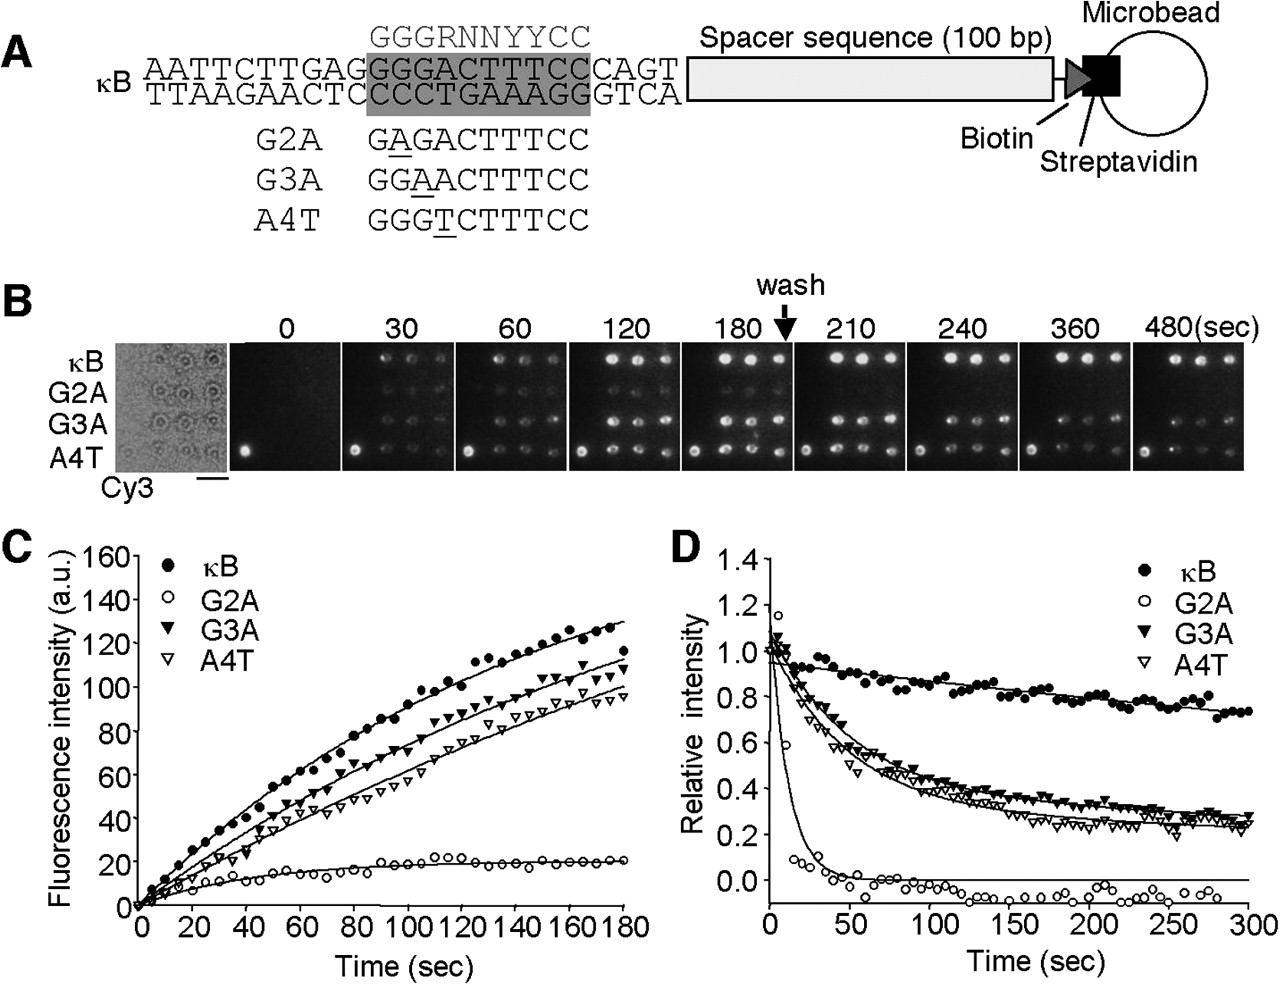
Parallel analyses of NFκB p50 bindings to κB sequence variants. (A) Target DNA-conjugated microbead constructions. Four types of DNA labeled with biotin were immobilized on the surface of streptavidin-coated microbeads, one containing a κB motif (κB) and the others containing single-nucleotide mutant sequences (G2A, G3A, and A4T). The gray box represents a κB motif and the gray letters indicate κB consensus sequence. In the mutant DNA, the sequence of the gray box is replaced with each single-nucleotide mutant sequence. The mutated position is underlined. (B) Microscopic images showing the binding of Cy3-labeled NFκB p50 to the DNA-conjugated microbead array. Cy3-labeled NFκB p50 (2 nM) was injected. (Left) The bright-field image of a DNA-conjugated microbead array and the others show the Cy3-fluorescence images. A Cy3-conjugated microbead (Cy3) was used as a marker for fluorescence imaging. After monitoring the association phase (180 sec), the buffer without Cy3-labeled NFκB p50 was replaced and the observation was continued for the following 300 sec. Images were collected at 5-sec intervals. Scale bar, 5 μm. (C) Time courses of the association of Cy3-labeled NFκB p50 to κB or mutant DNA. The data represents the mean fluorescence intensities from three different microbeads. The black lines represent the nonlinear fitted curves. (D) Time courses of the dissociation of Cy3-labeled NFκB p50 from κB or mutant DNA. The data represents the mean fluorescence intensities from three different microbeads. The black lines represent the fitted nonlinear curves.


