
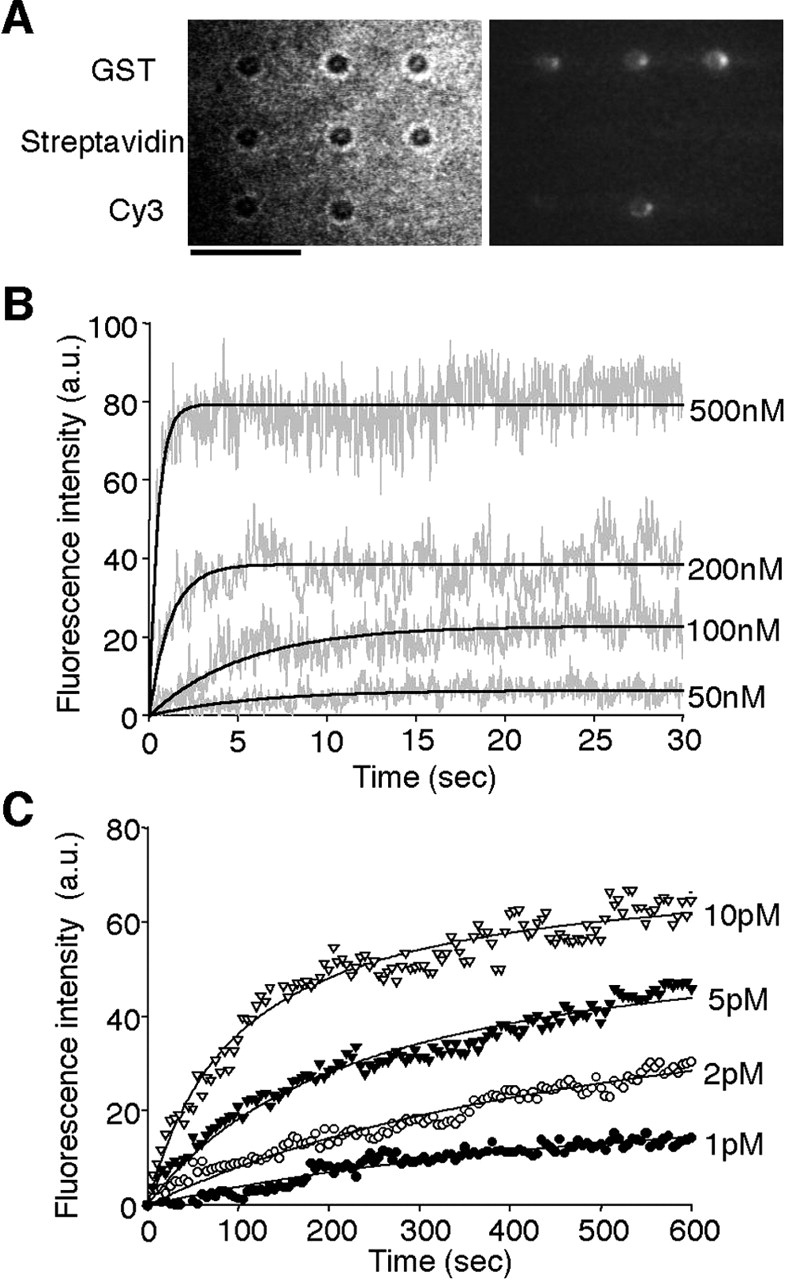
Analysis of the binding of low-molecular-weight molecules. GST and streptavidin coated microbeads were arrayed on a coverslip and the binding of Cy3-labeled GSH or biotin was monitored. (A) Microscopic images showing the binding of Cy3-labeled GSH to the protein-conjugated microbead array after the exposure to 200 nM Cy3-labeled glutathione for 30 sec. (Left) The bright-field image; (right) the Cy3-fluorescence image. Cy3-conjugated microbeads (Cy3) were used as a marker for fluorescence imaging. Scale bar, 5 μm. (B) Concentration dependence of the association of Cy3-labeled GSH to GST. Various concentrations of Cy3-labeled GSH were injected onto the protein-conjugated microbead arrays. Fluorescence images were collected at video rate. Gray lines represent the mean fluorescence intensities from three different microbeads. Black lines represent the nonlinear fitted curves. (C) The binding of Cy3-labeled biotin to streptavidin. Various concentrations of Cy3-labeled biotin were injected onto the protein-conjugated microbead arrays. Fluorescence images were collected at 5-sec intervals. The symbols represent the mean fluorescence intensities from four different microbeads. Black lines represent the nonlinear fitted curves.


