
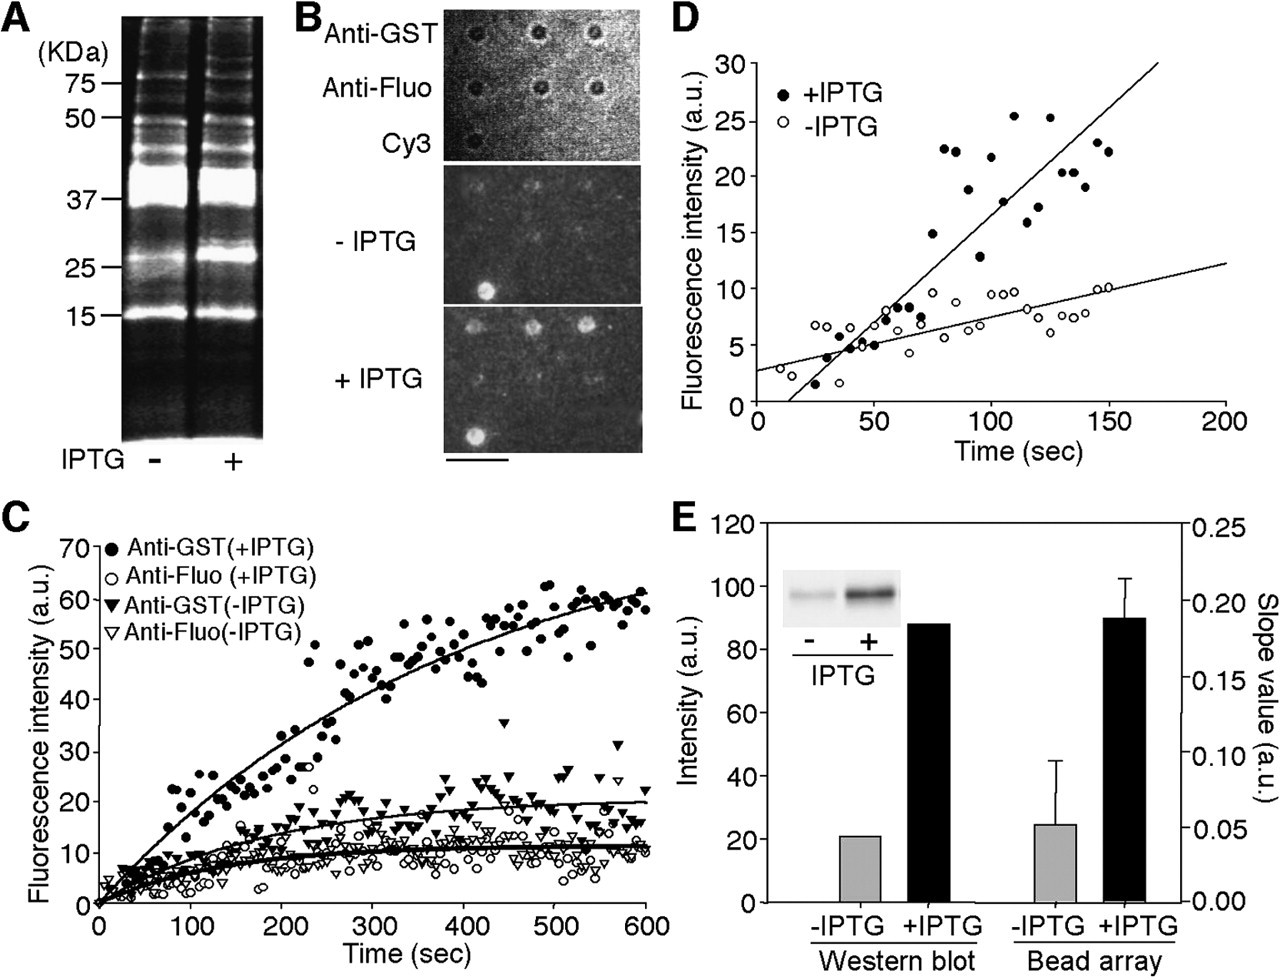
Analysis of protein expression levels in E. coli using antibody-conjugated microbead arrays. (A) Cy3-labeled soluble proteins from two types of pGEX-transformed E. coli, one inducing by 1mM IPTG (+) and the other not (–). Cy3-labeled soluble proteins were analyzed using 12.5% SDS-PAGE with a fluorescence imaging analyzer. The Cy3-fluorescence image is shown. (B) Microscopic images showing the binding of Cy3-labeled soluble proteins to the anti-GST or anti-fluorescein (fluo) antibody-conjugated microbeads after the exposure to 20 nM (in terms of Cy3 concentration; protein concentration, 0.1 μg/mL) Cy3-labeled proteins for 600 sec. (Top) The bright-field image of an antibody-conjugated microbead array. (Middle, bottom) The Cy3-fluorescence images. A Cy3-conjugated microbead (Cy3) was used as a marker for fluorescence imaging. Scale bar, 5 μm. (C) Time courses of the association of Cy3-labeled proteins with anti-GST or anti-fluo antibody. Fluorescence images were collected at 5-sec intervals. The data represent the mean fluorescence intensities from three different microbeads. The black lines represent the fitted nonlinear curves. (D) Analysis of the binding of Cy3-labeled proteins to anti-GST antibody in the early association phase. The slope values in early association phase (∼150 sec) were obtained by a linear fitting procedure. (E) Comparison of GST expression levels by Western blot analysis and antibody-conjugated microbead array analysis. Western blot analysis: Cell lysates were separated by 12.5% SDS-PAGE and analyzed with anti-GST antibody. The protein band intensities are shown. Bead array analysis: The slope values in the early association phase (∼150 sec) are shown. (Inset) A fluorogram of the Western blot. Error bars represent standard deviation from the average slope values observed from three different microbeads.


