
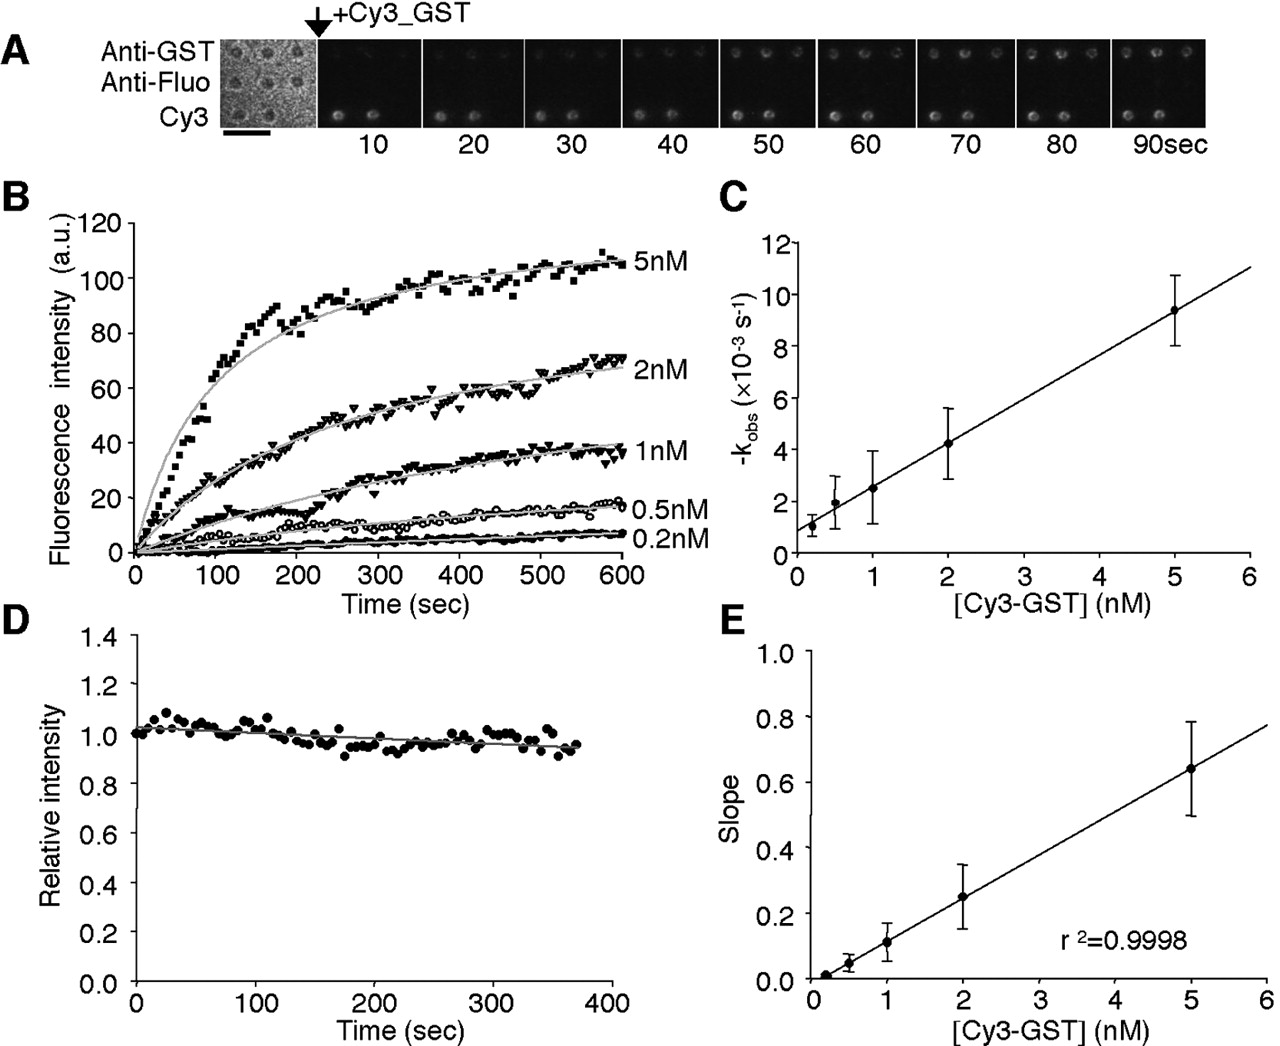
Analysis of antigen binding to antibody. (A) Microscopic images showing the binding of Cy3-labeled GST to the antibody-conjugated microbead array. Anti-GST and anti-fluorescein (fluo) antibody coated microbeads were arrayed on a coverslip, and Cy3-labeled GST (2 nM) was injected. (Left) The bright-field image of antibody-conjugated microbead array and others show the Cy3-fluorescence images. Cy3-conjugated microbeads (Cy3) were used as a marker for fluorescence imaging. Scale bar, 5 μm. (B) Concentration dependence of the association of Cy3-labeled GST to anti-GST antibody. Various concentrations of Cy3-labeled GST were added to the antibody-conjugated microbead arrays. Images were collected at 5-sec intervals. The symbols represent the mean fluorescence intensities from six different microbeads. Gray lines represent the nonlinear fitted curves. (C) Plot of –kobs against concentrations of Cy3-labeled GST. (D) Determination of dissociation rate constant of Cy3-labeled GST from anti-GST antibody. After monitoring the binding phase, the buffer without Cy3-labeled GST was replaced and the observation was continued. Relative fluorescence intensities of dissociation of Cy3-labeled GST from anti-GST antibody-immobilized microbeads are shown. The symbols represent the mean relative intensities from six different microbeads. (E) Plots of slope values in the initial association phase against concentrations of Cy3-labeled GST. Error bars represent standard deviation from the average observed value from six different microbeads at each concentration. Straight lines represent the fitted linear regressions.


