
Characterization of the Genomic Xist Locus in Rodents Reveals Conservation of Overall Gene Structure and Tandem Repeats but Rapid Evolution of Unique Sequence
Abstract
The Xist locus plays a central role in the regulation of X chromosome inactivation in mammals, although its exact mode of action remains to be elucidated. Evolutionary studies are important in identifying conserved genomic regions and defining their possible function. Here we report cloning, sequence analysis, and detailed characterization of the Xist gene from four closely related species of common vole (field mouse), Microtus arvalis. Our analysis reveals that there is overall conservation of Xistgene structure both between different vole species and relative to mouse and human Xist/XIST. Within transcribed sequence, there is significant conservation over five short regions of unique sequence and also over Xist-specific tandem repeats. The majority of unique sequences, however, are evolving at an unexpectedly high rate. This is also evident from analysis of flanking sequences, which reveals a very high rate of rearrangement and invasion of dispersed repeats. We discuss these results in the context of Xist gene function and evolution.
[The sequence data described in this paper have been submitted to the GenBank data library under accession nos.AJ310127–AJ310130 and AJ311670.]
X chromosome inactivation is the process by which one of the two genetically equivalent parental X chromosomes becomes transcriptionally inactive and heterochromatinized during early embryogenesis in female mammals (Lyon 1961). This is a multistep process and includes counting of the X chromosomes per diploid set, choice of the chromosome to be inactivated (which is usually random in the embryo proper), and initiation, spread, and maintenance of the inactive state. X-inactivation is regulated by a single site on the X, termed the X inactivation center (XIC; for review, see Rastan and Brown 1990).
The molecular basis of the XIC has recently begun to be revealed through studies on the Xist (X inactive–specific transcript) gene. Xist has been localized to the XIC region and codes for an unusually large untranslated RNA, which is retained in the nucleus in close association with the X chromosome from which it is transcribed (Borsani et al. 1991; Brockdorff et al. 1991, 1992; Brown et al. 1991,1992; Clemson et al. 1996). Expression of Xist precedes the onset of X-inactivation in early mouse embryos and coincides with initiation of X-inactivation in differentiated XX embryonic stem (ES) cells (Kay et al. 1993). Xist is required in cis for X inactivation to occur, because deletion of the gene leads to inability of the mutated X chromosome to be silenced (Penny et al. 1996; Marahrens et al. 1997). Ectopic Xist copies integrated into autosomal regions of mouse XY ES cells can cause inactivation ofcis-linked autosomal genes and, in some instances, lead to activation of the endogenous Xist gene (Lee et al. 1996;Herzing et al. 1997; Lee and Jaenisch, 1997). Thus, it has been shown that Xist has the main properties of the Xic.
In undifferentiated ES cells, an unstable variant of Xist is transcribed from all X chromosomes, both on XX and XY backgrounds (Panning et al. 1997; Sheardown et al. 1997a). This transcript is not associated with the X chromatin but is detected at the site of transcription as a pinpoint signal. It is now known that both sense and antisense transcripts through the locus contribute to the unstable signal. Antisense transcription initiates ∼15 kb 3′ of Xistat the Tsix promoter (Lee et al. 1999). Initial studies indicated that unstable sense transcript is driven by an upstream promoter P0 located −6.5 kb from the P1 initiation site of mouse Xist (Johnston et al. 1998). However, subsequent work has shown that this is unlikely to be the case and has suggested unstable sense transcripts are initiated from the major somatic promoters P1/P2 (Warshawsky et al. 1999).
Despite detailed characterization of the Xist gene, its mechanism of function and the delineation of its important functional domains remain elusive. Comparative sequence studies can provide a useful tool in the definition of domains preserved during independent evolution of mammalian species, thereby identifying putative functional regions. To date, complete Xist sequence is only available for human and mouse (Brockdorff et al. 1992; Brown et al. 1992), although some information has been obtained for lepine (rabbit) and equine (horse) genes and for short fragments of bovine and several primate species (Hendrich et al. 1993, 1997). These studies indicate an overall conservation of the exon/intron structure of murine and human Xist/XIST and a similarity in the position of Xist-specific tandem repeats.
In this study we present an analysis of the Xist gene and its surrounding sequence in four closely related species of the common vole (field mouse), Microtus arvalis. Both mouse and vole belong to the vast order Rodentia and are separated from each other by 15–25 million years of independent evolution (Lindsay 1978; Jaeger et al. 1985; Catzeflis et al. 1989). Common voles have been well-characterized cytogenetically, and a cytogenetic map of several X-linked genes, including Xist, has been obtained for all four vole species under study (Mazurok et al. 1994, 1995, 1996; Mayorov et al. 1996;Elisaphenko et al. 1998; Nesterova et al. 1998). A phenomenon of nonrandom inactivation of the parental X chromosomes occurs in particular combinations of crosses between vole species, making this biological system particularly attractive for X-inactivation studies (Zakian et al. 1987, 1991). Sequencing of the Xist gene and adjacent 5′ and 3′ regions in four species of common vole provides an additional resource for comparative analysis and evolutionary studies of the Xist locus in mammals.
RESULTS
Characterization of Vole Xist Gene
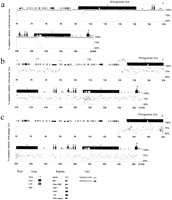
At least three overlapping λ clones were isolated from genomic libraries for each of four common vole species: M. arvalis,M. rossiaemeridionalis, M. kirgisorum, and M. transcaspicus. A genomic Xist contig was created for each species by restriction and blot hybridization analyses (Fig.1a). Complete Xist genomic sequences, including 5′ and 3′ flanking regions, were obtained for these species, either by direct sequencing of λ clones or sequencing of subcloned fragments in pBluescript. Vole Xist sequences were aligned with mouse Xist, and the putative 5′, 3′, and exon-intron boundaries were established for each species.
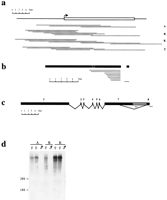
Cloning of vole Xist gene. (a) Series of λ clones isolated from genomic DNA libraries for common vole species, M. arvalis (A), M. rossiaemeridionalis (R), M. kirgisorum (K), and M. transcaspicus (T). The clone contigs have covered the whole Xist gene sequence, including extra 5′ and 3′ sequences. 5′ and 3′ boundaries of vole Xist gene were determined on the base of homology analysis with mouse. The predicted 5′ end of the gene is indicated (arrow). (b) A series of cDNA clones pulled out of M. arvalis oligo(dT) library using exon 7 and 8 probes. The size and position of clones relatively to the Xist transcript is indicated. A single clone obtained with exon 8 probe contains 0.6 kb of intron 7 sequence. Exons are shown in black with the position of introns shown in white. Exon 8 is shown distantly to the rest of the transcript to indicate the size of the intronic sequence in exon 8-contaning clone. (c) Exon-intron structure of vole Xist gene based on RT-PCR and cDNA cloning analyses. Vole Xist consists of eight exons depicted as black blocks; grey box represents long Xisttranscripts found in 3′ RACE. A (n) denotes the 3′ ends of RACE products, although classical polyadenylation sites are absent in the sequence. (d) Northern blot of M. arvalis(A), M. rossiaemeridionalis (R), and M. kirgisorum (K) total RNA hybridized to exon 1 (Rx8Pst2) probe. Expression of vole somatic Xist is female-specific in all species studied.
The exon-intron structure of the M. arvalis Xist gene was determined by comparison between genomic and cDNA sequences. Twelve clones were isolated from an oligo-dT cDNA library using vole genomic DNA probes corresponding to exons 7 and 8 (Fig. 1b). The size of the cDNAs was 3kb–5 kb and, hence, did not represent the completeXist sequence. However, restriction and sequence analyses revealed two clones spanning exons 1–7, which were therefore sufficient to map all exon-intron boundaries. This analysis showed a similarity in overall gene structure and exon/intron boundaries between the vole and mouse Xist genes (Fig. 1c). Screening the library with the exon 8 probe resulted in only one clone containing exon 8 sequence. This clone, 1 kb long, contained a part of unspliced intron 7 sequence in addition to exon 8. This result might reflect a rareXist variant in some cells or the cloning of a partly unspliced pre-messenger cDNA. We have not recovered any cDNA clones containing the alternatively spliced transcript, which probably indicates rare usage of the splice site, as was shown for mouse (Sheardown et al. 1997a), or possibly poor polyadenylation of the alternatively spliced variant.
To verify the data obtained for M. arvalis and expand this analysis to the other three species, we analyzed RT-PCR products, amplified across the whole length of Xist. Correctly spliced RT-PCR products were readily detected for exons 1–7. Using this technique, we were also able to amplify a vole homolog of a rare mouseXist RNA variant in which a truncated exon 7 is spliced to exon 8. Sequencing of amplified fragments showed that splicing has occurred at a consensus splice donor site in the middle of exon 7, which is homologous to human and mouse (Brown et al. 1992; Sheardown et al. 1997a).
Table 1 summarizes the data on the exon and intron sizes of vole Xist in comparison with its mouse homolog. The overall gene structure is conserved between the four species studied and is similar to that in mouse. Vole Xistconsists of eight exons, with large exons 1 and 7 and six small exons ranging between 83 bp (exon 2) and 393 bp (exon 8). The positions of exon-intron boundaries are conserved and obey the rule GT/AG for intron excisions.
Relative Length of Xist Elements and Surrounding Regions in Vole and Mouse
To determine the expression pattern of vole Xist, we performed Northern blot analysis of XX and XY total liver RNA (Fig. 1d). Hybridization signal was observed exclusively in females, consistent with transcription from the inactive X chromosome. At least two bands were detected in all female samples, presumably representing the long and short alternatively spliced transcripts described above, although we could not establish the precise size of the bands. The relative hybridization intensity of these bands indicates a higher proportion of the longer transcript, consistent with the results of our cDNA analysis.
Mapping the Vole Xist Initiation Site
Transcription of mouse Xist RNA is initiated from multiple start sites, with the major transcript in somatic cells being initiated at the P2 site (Brockdorff et al. 1992; Johnston et al. 1998). The positions of putative P1 and P2 start sites in voles were established initially by comparison of vole and mouse sequences. Two approaches were then used to test the validity of the prediction.
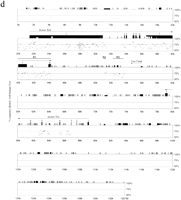
First, we performed slot blot hybridization of vole RNA with probes 5′ and 3′ of the predicted start sites as initial indication for promoter usage in voles (Fig. 2b). Hybridization was not detected for a probe located 5′ to the tentative P1 site (VP1), indicating that transcription initiates downstream from it (data not shown). Probes located either between the presumptive P1and P2 sites (VP2 and VP3) or 3′ to the presumptive P2 site (VP4 and VP5) revealed a similar level of hybridization for all samples (Fig. 2b). The equal ratio of vole VP4:VP2 Xist hybridization signals suggests that transcription initiates from a site upstream of VP2 (Fig. 2c).
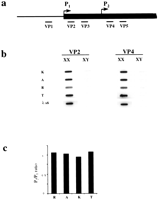
Xist transcription analysis. (a) A scheme of voleXist, including the putative transcription start sites and the positions of the probes used in slot blot analysis. (b) Hybridization of probes to slot blots containing 10 μg of total RNA from XX and XY kidneys. No hybridization was detected for upstream VP1 probe (data not shown). The results obtained for VP2 and VP3 and for VP4 and VP5 probes were similar, hence only representative slot blots for VP2 and VP4 probes are shown. The signal was normalized to 28S RNA probe and to lambda Xist DNA for the efficiency of hybridization. (c) Quantification of slot blot data showing the usage of vole P1 and P2 start sites. Black bars represent P2/P1 ratio for M. rossiaemeridionalis (R), M.arvalis (A),M. kirgisorum (K), and M. transcaspicus (T) RNA signal. The value close to 1 suggests that all transcripts initiate upstream the VP4 and VP5 probes.
A nuclease protection assay was used to map the Xisttranscription initiation site (Fig. 3). In all vole species analyzed, a major protected band 264 bp in length was readily detected by a probe spanning the predicted P1 (VR1; Fig. 3a). This product corresponded to the P1 initiation site predicted by comparative sequence analysis. Additional weak protected products were detected and may suggest heterogenity in initiation of transcription as seen for mouse and human Xist/XIST(Brockdorff et al. 1992; Brown et al. 1992). In contrast, a probe across the putative P2 site (VR2) gave a full-length protected product (data not shown). This represents RNA transcript initiating upstream of the VR2 probe and is consistent with the RNA slot-blot hybridization (data shown above). We conclude that in voles somatic Xist is regulated by a promoter P1 with a major transcription initiation site at the homologous position with mouse and human P1 sites (Fig. 3c). The putative binding sites in the mouse Xist promoter, which are known to bind transcription factors in in vitro assays (Sheardown et al. 1997b), are conserved in voles.
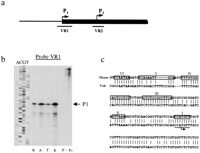
Mapping the vole Xist transcription start site. (a) A scheme of vole Xist, including the putative transcription start sites and the positions of the probes used in nuclease protection assay. (b) Nuclease protection assay was used to detect the position of transcription start site. Antisense riboprobes were synthesized spanning the predicted P1 and P2 start sites. 10 μg of total RNA from fibroblast cell cultures was hybridized to radiolabeled probe and digested with mung bean nuclease. Probe-, undigested probe; probe +, digested probe after hybridization to yeast RNA. Lanes R,A,T,K are forM. rossiaemeridionalis, M. arvalis, M. kirgisorum, and M. transcaspicus RNA, respectively. (P1) The band corresponding to the size of P1 start site. A sequencing ladder of known fragment is shown alongside to estimate the position of start site. The data for P1 riboprobe only is shown. (c) Sequence comparison of Xist minimal promoter between vole and mouse. Consensus initiator sequence is underlined, and the position of transcriptional start site is indicated by arrow. Conserved promoter elements I–VI are boxed (Sheardown et al. 1997b).
Mapping the Vole Xist 3′ End
The 3′ end of the M. arvalis Xist transcript was determined initially by sequencing cDNA clones isolated from an oligo(dT) library. The majority of clones terminate at +18943 bp relative to the M. arvalis Xist P1 site. This is 384 nucleotides upstream of the position predicted on the basis of homology between vole and mouse at the 3′ end of exon 7 (Fig. 1b). This position coincides with the beginning of a poly(A) tract of a B1 repeat specific to M. arvalis and, therefore, most likely represents mispriming of oligo(dT) to this poly(A) tract, rather than the real 3′ end of voleXist RNA. None of the isolated clones terminated at the predicted end of exon 7. This result may suggest poor polyadenylation of the Xist transcript.
To clarify the vole Xist 3′ end structure and for fine mapping the 3′ end of the transcript, we used nuclease protection. A probe across the donor splice site in the middle of exon 7 (VR3) gave a major protected band corresponding to the size of full-length protected product, indicating predominance of long exon 7 transcript (data not shown). A minor band, corresponding to the size of the alternatively spliced Xist variant, was also detected with several other weak bands. The latter bands might be a result of nonspecific probe degradation or might indicate the presence of other minor splice products, which we failed to detect by other methods. Similar analysis was performed for the 3′ end of exon 7 (VR4) as predicted by sequence homology. Surprisingly, the major band detected was fully protected product, indicating that this site of transcript termination is rarely used in voles (data not shown).
Next, a 3′RACE assay was used on total (M. arvalis and M. kirgisorum) or poly A+ (M. rossiaemeridionalis) RNA. Several gene-specific primers were used in combination with a universal 3′ RACE primer, and the amplified fragments were blotted and hybridized with corresponding Xist probes to prove their specificity (Fig. 4). The bands obtained were subcloned and sequenced. Alignment between RACE products and genomic sequence revealed that the transcripts terminate at several specific sites for all three species analyzed. Some clones were found to be terminated at the 3′ end of exon 7, predicted on the basis of homology with mouse Xist (Borsani et al. 1991; Brockdorff et al. 1992). Other clones, however, were longer, terminating at two major sites further downstream. A few clones included the whole of intron 7, but lacked exon 8. We were not able to isolate any RACE product including exon 8, even with exon 8 RACE primer. The result obtained for total RNA samples was similar to poly A+ samples. Bands forM. rossiaemeridionalis were slightly larger than those forM. arvalis and M. kirgisorum because of the insertion of a B1 repeat in this species.
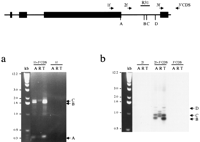
Mapping the vole Xist 3′ end. The schematic represents theXist exons 5–8. The location of primers used for 3′ RACE is indicated with arrows. The positions of major polyadenylated 3′ ends ofXist transcripts (A, B, C, D) and probe R31 used for hybridization are shown. (a) 3′ RACE amplification of M. arvalis (A) and M. kirgisorum (T) total RNA, and M. rossiaemeridionalis (R) poly A+ RNA with combination of gene-specific and universal primers, 1f +3′CDS, 2f +3′CDS, 3f +3′CDS. 1f, 2f and 3′CDS primers only were used as negative control to assure specificity of amplification. Ethidium bromide stained gel is shown for primer pair 1f +3′CDS and 1f control. Three major bands (A, B, C) are indicated with arrows. (b) Southern blot hybridization of Xist probe R31 is shown for primer pair 2f +3′CDS and controls to prove specificity of amplified fragments. Bands corresponding to the 3′ ends of Xist (B, C, D) are indicated with arrows.
The data obtained by various methods indicate high heterogenity of voleXist transcript, represented by alternatively spliced RNA and several variants terminated at different exon 7 or intron 7 sites. This phenomenon is not unusual because a longer Xist/XIST variant encompassing the intronic sequence was reported recently for the mouse and human genes (Hong et al. 1999, 2000).
Comparative Analysis of Vole, Mouse, and Human Xist Genes
We used the PipMaker Web server (http://bio.cse.psu.edu) to analyze Xist sequences of the four vole species, mouse, and human to identify evolutionary conserved regions as candidates forXist functional domains. PIP (PercentIdentity Plot) analysis allows comparison of two extended genomic sequences and displays the result in a simple and illustrative form. Each section of gap-free alignment is represented as a horizontal line showing sequence conservation (percent of homology) and features along segments of the first sequence. The longer the line, the longer the gap-free homologous region (Schwartz et al. 2000).
High homology was found between the four vole species along the whole region, with an average sequence identity of 92.8% (all deletions and insertions are included; Table 2). PIP analysis of M. kirgisorum and M. arvalis is presented in Figure 5a. The differences between vole species are accounted for mainly by short deletions, insertions, and nucleotide substitutions. Insertion of species-specific repeat elements is detected in the upstream region in all vole species analyzed. In addition, M. arvalis carries an insertion of SINE elements in exons 1 and 7. SINE elements are also detected in M. arvalis introns 1 and 7 and in M. rossiaemeridionalis intron 7. The latter could be a part of the RNA transcript in the case of the long exon 7 Xist variant. Other pairs of vole species show essentially similar plots, but with noticeable differences in the region of Xist-specific E repeats (see below).
Homology Between VoleXist Sequences
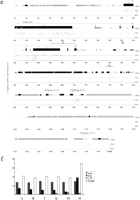
Comparative analysis of Xist gene in vole, mouse and human. (a) Percent identity plot (PIP) of M. kirgisorum Xistrelative to M. arvalis Xist. M. kirgisorum genomic sequence is shown on the X axis, and the percentage of its identity (50%–100%) to M. arvalis Xist is shown on theY axis. Black boxes illustrate Xist exons; the other sequence features and repeat elements are indicated with shape and shade coded icons (see annotation underneath Figure, panel c). (b) PIP of M. kirgisorum Xist (X axis) relative to mouse Xist (Y axis). (c) PIP ofM. kirgisorum Xist (X axis) relative to humanXist (Y axis). (d) PIP of mouseXist (X axis) relative to human Xist(Y axis); regions 1, 2, and 3 (Lee et al. 1999) are marked as R1, R2, and R3, respectively. (e) PIP of human Xist(X axis) relative to mouse Xist (Y axis); regions 1, 2, and 3 (Lee et al. 1999) are marked as R1, R2, and R3, respectively. (f) Comparison of SINE, LINE, LTR elements and total interspersed repeat representation in the Xist upstream sequence of M. arvalis (A), M. rossiaemeridionalis(R), M. transcaspicus (T), M. kirgisorum (K), M. musculus (M), and H. sapiens (H). The Y axis represents the percentage of genomic Xist upstream sequence occupied by repeat elements. (Figure continues on following page.)
PIP analysis between M. kirgisorum and mouse Xistsequences is shown in Figure 5b. The overall level of sequence identity for Xist between these two rodent species is relatively low (57.2%), with a percentage homology for spliced RNA transcript of 61.0% and for intronic regions of 54.0%. The analysis does not reveal extended regions of high homology as was observed for the closely related vole species (Tables 2 and 3). However, 16 fragments of length 116–228 bp showing homology between 68% and 90% are detected in the promoter region, and along exons 1, 4, 6, and 7. Short regions of high homology are also detected for introns 1, 5, and 7.
Homology Between Vole (M. kirgisorum) and MouseXist Elements
Comparative analysis of M. kirgisorum/human (Fig. 5c) and mouse/human sequences (Fig. 5d) gives essentially similar plot patterns to the data obtained for the M. kirgisorum/mouse pair. The overall homology is slightly lower (48% for M. kirgisorum/human and 49% for mouse/human) and less extended, and it is restricted exclusively to the transcribed and promoter regions. As was described previously for human, murine, lepine, and bovineXIST/Xist (Brown et al. 1992; Hendrich et al. 1993), the homology between vole and other species is not continuous, but represents an alternation of homologous and totally unrelated sequences. Seven gap-free regions (90–160 bp) of relatively high homology (68%–86%) were detected for both vole/human and mouse/human pairs. However, pairwise comparison of these regions between vole, mouse, and human reveals that most of them are not shared by all species. Remarkably conserved between all species studied is exon 4 (79% for mouse/human, 78% for vole/human, 85% vole/mouse). Four other regions of homology (73%–78%) located in the exon 1 (M. kirgisorum, +2231 +2365, +5009 +5224, +6465 +6664, and +6894 +7043) and shared by all species were detected by program LALIGN(Huang and Miller 1991), allowing gapping to find the best homologous region. With the exception of exon 4, which encodes an RNA with potential to form a stem loop in all species, no evolutionary conserved elements of secondary RNA structures were detected for the other four homologous regions.
Comparative Analysis of the Xist 5′ and 3′ Regions
A comparison between genomic 5′regions upstream of Xisttranscription initiation site P1 was completed for vole species, mouse (T.B. Nesterova, unpubl.), and human. Homology between human and mouse/vole spans Xist and breaks completely at 1.6 kb upstream of the P1 transcription start site and at the 3′ end of exon 8 (Fig. 5c,d). Similarly, homology between mouse and vole breaks at 1.1 kb upstream of P1 site, but reappears in a linear manner at −9 kb. Two regions of relatively high homology (C1 and C2) interrupted by an extended unrelated sequence (UR) were identified in rodents (Fig. 5b).
Homologous region C1 adjacent to Xist contains promoter elements and shows 65.3% sequence identity between M. kirgisorum and mouse. The overall homology of the C2 region (M. kirgisorum 108–5887; mouse 7495–12279) is 60%, which is higher than overall homology for the Xist gene (57.2%) and is comparable with the conservation of the Xist RNA molecule (61%). The sequence identities for gap-free alignments vary in the range of 75%–85%, indicating evolutionary conservation of this region, at least in rodents. An analysis of CpG content in M. kirgisorum and mouse reveals a homologous region with prominent CpG island features, characteristic of mammalian promoter regions (Bird 1986). Promoter prediction and nucleosome assembly potential computer analyses strongly support the hypothesis of promoter activity in this region (N. Kolesnikov, E. Elisaphenko, S. Slobodyanyuk, A. Shevchenko, M. Pavlova, I. Rogozin, T. Nesterova, N. Brockdorff, and S. Zakian, in prep.). The position of a CpG island at the 3′ end of the homology region indicates a potential gene with antisense transcription relative to Xist.
None of the gap-free alignments in the region UR (positions 5888–14011 bp in M. kirgisorum, 12280–20413 in mouse) exceeds the 48% homology, characteristic of totally unrelated sequences. The mouse putative early promoter P0, active in undifferentiated ES cells, was mapped within this region (Johnston et al. 1998), but we were not able to identify its vole homolog.
A feature common to Xist upstream regions of vole, mouse, and human is a high enrichment for various repeat elements, including SINEs (B1, B2, B3, RSINE, MIR, ID), LINE (L1), LTR, and simple repeats (Fig.5f). In both vole and mouse, two pseudogenes were detected. These pseudogenes are not related to each other and are located on opposite strands (data not shown).
An analysis of the human and mouse 3′ region revealed similar enrichment for interspersed repeats and a lack of overall homology (Fig. 5d,e). Three regions of homology, reported previously for the mouse/human Tsix region (Lee et al. 1999), correspond to the mouse Xist intron 7 and exon 8 (region 1) and to various interspersed elements (LTR, MaLR, simple repeat; regions 2 and 3). The mouse Tsix promoter is situated approximately 2 kb downstream (relative to Xist gene) from the third homology region and coincides with the position of a CpG island (Fig. 5d). Mouse regions 2 and 3 map within a 3-kb fragment, whereas homologous human regions lie 17 kb apart and are separated by the invasion of several LTR elements. Another three regions of relatively high human:mouse homology (57%–73%) were revealed further downstream from theXist/XIST gene. These regions are homologous to the mouseTsx gene, situated 35 kb 3′ from the end of Xist exon 8 (Simmler et al. 1996). We identify homology for mouse Tsxexons 3–6 and adjacent intronic sequences but find that the human gene is split by the insertion of several LINE elements (Fig. 5e).
Xist Tandem Repeats
Previously it has been hypothesized that Xist-specific tandem repeats might be involved in X inactivation because they could bind regulatory molecules in a highly cooperative manner and they are well conserved between human and mouse (Brockdorff et al. 1992; Brown et al. 1992). All five types of repeats reported previously in mouse and human are present in vole Xist (Fig.6a,e). The most conserved are the 5′ repeats (A) and C-rich repeats (B). The core regions of the 5′repeats are almost identical between vole species, and there are just a few nucleotide transpositions between vole and mouse. Spacers between the core repeats are generally not conserved, but have a high AT content in all species. Repeat B is found in approximately the same copy number in voles and mouse, and it is about two-thirds of the length in human (Fig. 6e). It is possible that the size of the human B repeat was initially the same, but was split by an insertion, because 12 copies of a similar repeat (Bh) were identified 700 bp upstream of the main repeat. Repeat C is amplified to 14 copies in mouse Xistand is found in a truncated state in both human and vole.
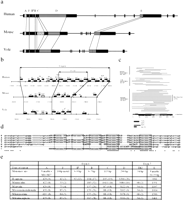
Tandem repeats in the Xist gene. (a) Schematic representation of tandem repeats in human, mouse, and voleXist gene. Similar repeats in different species are connected by thin lines. The size and features of specific repeats are indicated in e. (b) Schematic representation of the D repeat region. Individual copies and their position are indicated. Previously published region indicated as D core. Human D-core consists of 7.7 tandem copies, and mouse and vole contain five truncated copies of various length. Truncated copies of D repeat are found in surrounding regions in all three species, thereby increasing the length of D-repeat region. (c) Length and position of D repeat copies found in extended D region. The homology to previously published consensus is color coded. (d) alignment of F repeat region between M. kirgisorum (K), M. arvalis (A), M. rossiaemeridionalis (R), M. transcaspicus (T), mouse (M), and human (H). Consensus sequence containing a putative binding site is boxed. Positions of identical nucleotides in all six species are marked with asterisks. (e) Monomer size and copy number of tandem repeats in the Xist gene. 1M1 +M2 – motifs 1 and 2; numbers in brackets represent the monomer copy number in each species.
Repeat D is the most complex of the Xist repeats. Originally it was found in eight copies in human XIST, and a single reduced copy was described for the mouse homolog (Brown et al. 1992). Using the Tandem Repeat Finder program andLALIGN software from the FASTA package, we have not found any complete copies of this repeat in vole Xist(Huang and Miller 1991, Benson 1999). However, five variously truncated copies of repeat D were identified in the homologous Xistregion, which we named D core. Another four truncated copies were found in a region surrounding D core, making up the total number of D repeats in the region to nine (Fig. 6b,c,e). We used the same software to search for truncated versions of D repeat in mouse and humanXist/XIST. Five copies were identified in the D core region and another five in surrounding sequences of mouse Xist. Eighteen truncated copies of D repeat were found in the humanXIST region adjacent to D core region in addition to the eight copies reported previously (Fig. 6b,c,e).
Repeat E has the highest variability and is amplified to a different degree in vole, mouse, and human. Three components could be distinguished in the region: E1, a tandem repeat of a low complexity CT-rich motif, varying in length between monomers and between species; E2, a sequence particular to each species, containing fragments of E1 monomers without any obvious regularity; and E3, an imperfect simple TG repeat, which also embodies fragments of E1 monomer. The major variability of repeat E between species is accounted for by the E1 component.
A search for repetitive elements in vole Xist allowed the identification of another repeat region (F) situated between 5′ (A) and C-rich (B) repeats. Five complete copies with the consensus AGTCTTGGC GGGCTTT were found in M. kirgisorum, M. rossiaemeridionalis, and M. transcaspicus; four copies were found in M. arvalis. A slightly truncated version of this repeat was found in two copies both in mouse and human (Fig. 6d). This repeat is located at the start site of the mouse major somatic promoter P2 and contains a binding site (T/C)TT(C/G)(G/C)CG(C/G) for cell cycle factor E2F (Campanero et al. 2000) and, thus, potentially could be involved in Xist regulation.
DISCUSSION
We have cloned and sequenced the Xist gene in four species of common vole. Our analysis shows that vole Xist RNA consists of eight exons and has a gene structure that is similar to the mouse. It is transcribed from a major transcription initiation start site, P1, which is well conserved between the four vole species and human, and is homologous to mouse minor promoter P1. SeveralXist variants were detected for vole, including a short alternatively spliced transcript and long transcripts terminated at three major sites. As in mouse and human, the vole Xisttranscript is female specific and coats the inactive X chromosome throughout the cell cycle (Duthie et al. 1999). Comparative analysis reveals relatively poor Xist sequence conservation between vole and human Xist/XIST, as well as between vole and mouse, suggesting a low evolutionary pressure for maintenance of the primary gene sequence. Our data indicate that the repetitive nature of the gene rather than its primary sequence may be important for gene function.
X Inactivation in Voles
We have previously reported preferential inactivation of the M. rossiaemeridionalis, M. transcaspicus, or M. kirgisorum X chromosome in interspecific female hybrids withM. arvalis, but random inactivation in all other combinations of crosses (Zakian et al. 1987, 1991). The phenomenon is similar to primary nonrandom X inactivation caused by heterozygosity at theXce locus in mice (Cattanach et al. 1969, 1970; Cattanach 1975; Johnston and Cattanach 1981). An inverse correlation between the strength of the Xce allele and the amount of Xist RNA in a cell has been reported in mice (Brockdorff et al. 1991; Buzin et al. 1994). However, no such correlation was found in vole, a similar level ofXist RNA being found in all four species analyzed (data not shown).
Xce alleles are thought to represent variants at the X inactivation center (Xic), although the sequences responsible have not yet been identified. Our comparative analysis of Xist and its 5′region in four vole species has revealed a single base change in theM. arvalis promoter region and a reduced copy number for the repeat F, encompassing a cell cycle factor E2F binding site. Additional experiments are required to clarify whether these M. arvalis Xist-specific sequence features are responsible for the skewing of X-inactivation in interspecific hybrids. Also, we cannot exclude that a putative choosing element, or vole Xce locus, is situated outside the analyzed sequence. The latter is consistent with the mapping of the mouse Xce locus at least 100 kb downstream from the Xist gene (Simmler et al. 1993).
Evolutionary Conservation of Xist Gene
The comprehensive sequencing data obtained for vole Xistincreases the number of species involved in comparative analysis, allowing a more rigorous examination of Xist evolution and possible functional domains. We have shown that a high level ofXist conservation is maintained only between closely related vole species belonging to the same genus. These species are separated from each other by approximately 0.5–0.6 million years of independent evolution (Mazurok et al. 2001). The average level of Xistidentity between these species is estimated to be 91%–93%, variations being accounted for mostly by short deletions/insertions and nucleotide substitutions. The analysis has revealed a similar rate of mutagenesis in exon and intron regions, which might indicate nearly neutral evolution of the majority of Xist sequence.
A low degree of sequence constraint for XIST/Xist was suggested previously on the basis of human and mouse comparative analysis data (Hendrich et al. 1993). Primates and rodents are separated from each other by ∼100–110 myr (Britten 1986; Li et al. 1990; Novacek 1992; Hedges et al. 1996), and it was reasonable to expect a similar level of Xist sequence divergency for human/vole to that for human/mouse. Indeed, Xist/XIST average homologies between these species were found to be similarly low, in the range of 48%–49%. A surprising finding came from the comparison of Xist sequences between mouse and vole, two representatives of the order Rodentia that are separated from each other by 15–25 MYR (Lindsay 1978; Jaeger et al. 1985; Catzeflis et al. 1989). Despite a comparatively recent time of evolutionary divergence, a relatively low level of sequence conservation was observed for theXist gene between these species. The overall homology between mouse and vole Xist genes is estimated as 57%, versus 93% determined for vole species.
These numbers are significantly lower than the average percent of identity for genic coding regions: A comparison of 1880 unique rodent/human mRNA sequence pairs gave an average of 85% (Makalowski and Boguski 1998). Taking into account that Xist does not have any protein-coding potential, a comparison of the degree of sequence identity with 5′ and 3′ untranslated regions may be more meaningful: For 5′UTR the estimates vary between 67% and 79%; for 3′UTR, between 69% and 74% (Makalowski and Boguski 1998; Mallon et al. 2000). Genomic sequence comparison of another untranslated gene, H19, revealed a level of homology of 66% between human and mouse, 68.5% between human and rat, and 85.7% between mouse and rat. These data indicate a much higher mutational rate for Xist in comparison with other genes analyzed to date. A high predisposition toward mutagenesis in this region is in line with the insertion of species-specific SINEs into the Xist gene and its neighboring sequences detected in each species.
Xist Neighborhood
A characteristic feature of the sequences surrounding Xistin all species studied is a saturation with various repetitive elements (Fig. 5). On average, 37% of vole and mouse upstream sequence is occupied by SINE (27%) and LINE (10%) elements. The analogous human upstream region contains approximately the same number of SINE elements as rodents (29%), but the contribution of LINE elements is much greater (37%; Fig. 5f). A similar result is observed for the 3′ end sequences, in which SINEs dominate the mouse region and LINEs the human one (see Fig. 5d,e).
The distribution of SINE and LINE elements throughout the genome varies considerably, but generally SINEs occupy predominantly G-light gene-rich bands (R bands), and LINEs inhabit G-dark gene-poor bands (Boyle et al. 1990). This is reflected in the finding that SINEs generally prevail over the other interspersed repeats in genomic sequences of gene-rich autosomal clusters (Mallon et al. 2000). In contrast, the X chromosome is especially enriched for LINE elements (Boyle et al. 1990; Bailey et al. 2000), as illustrated by the X-linked region Bpa/Str, in which LINEs occur with significantly higher frequency than SINEs both in mouse and human (Mallon et al. 2000). However, some X-linked regions (such as the Btk locus) show a repeat distribution similar to autosomal gene clusters (Oeltjen et al. 1997).
LINE (L1) repeats were recently hypothesized as potential candidates for the role of “way stations”, which sense and boost the X-inactivation signal along the X chromosome (Lyon 1998). Evidence in support of this hypothesis has come from a study showing that the human X chromosome is enriched for LINE sequences (26%), especially around the XIC region (45%; Bailey et al. 2000). In line with these data, we found an exceptionally high number of LINE repeats in the humanXIST 5′ and 3′ regions. Sequence analysis of the analogous mouse regions also revealed their highly repetitive nature, although LINE contribution is minor and represented by short fragments only (compare Fig. 5d,e). Previously-reported high enrichment of mouse Xic region with LINEs (Boyle et al. 1990) obviously does not apply to the 130 kb of Xist/Tsix surrounding region. This observation is surprising considering the major role for Xist/Tsix locus in X-inactivation. Together with previous data on the Xist RNA localization (Duthie et al. 1999), our findings indicate that other repetitive elements apart from L1 may likely be involved in the putative spreading function.
Detailed comparison between the human and mouse 3′ Xistregions does not reveal any extended homology. Notably, no homology was found for the promoter region and start site of the mouse Tsixgene (Fig. 5d,e). It remains possible that there may be antisense transcription during human embryogenesis because LTR/LINE/SINE elements are known to have promoter activity (Matera et al. 1990; Sessaman et al. 1997; Medstrand et al. 2000). However, we consider this unlikely, because of the different pattern of Xist expression in early human embryogenesis (Daniels et al. 1997; Ray et al. 1997). It will be interesting to determine whether the 3′ region downstream fromXist is conserved in voles and shares the Tsixpromoter/sequence and Xist regulation.
The analysis of Xist/XIST 3′sequence indicated that three regions, situated ∼40 kb downstream from the end of exon 8, show a significant homology with the mouse Tsx gene. Our comparative data indicate that as in the mouse, the human Tsx homolog is situated in the antisense orientation relative to XIST. Although mouse Tsx is 10 kb, the human homologous sequence is scattered over 45 kb, because of insertion of multiple copies of LINE elements covering over 40 kb. We were not able to find conservation of exons 1 and 2, but it is very likely that they are conserved and situated further downstream from the analyzed region. Thus, the result confirms that human TSX gene is within the large inverted region encompassing Xpct-Xist-Tsx-Brx-Cdx4 and Bpxcluster of Xic genes (Debrand et al. 1998). The extensive invasion of the human region by LINE/LTR elements allows us to reconsider the origin of size differences in Xic/XIC regions, assigning them mainly to repeat expansion in human XIC during independent evolution from rodents rather than deletions and other rearrangements in the mouse.
Tandem Repeats
Despite the low level of Xist sequence conservation between different species, the overall structure of the gene remains very similar, including the exon/intron structure and the position of the transcription start site. Apart from this, the most striking similarity between species is the conservation of the position ofXist-specific tandem repeats. Six types of repeats were described for human, mouse, and vole Xist, and a good consensus was found for each repeat. Repeat C is differentially amplified in mouse only; repeats D and E show high variability in copy number and monomer sequence in each individual species. Repeats A and B are the most interesting, because they are the most conserved elements of Xist. Repeat F, which includes a binding site for cell cycle factor E2F, was found at the position of the mouse major start site P2, and a consensus is conserved between all species. Our analysis shows that various tandem repeats occupy the majority ofXist sequence. Over a third of the length of rodentXist RNA (36%–39% in voles and 45% in mouse) and nearly half of the human homolog (47.5%) are composed of tandem repeats.
The results of comparative analysis of Xist and its surrounding sequences between several representatives of order Rodentia and human emphasize the earlier observation that this region is relatively free from evolutionary sequence constraint (Hendrich et al. 1993; Simmler et al. 1996; Debrand et al. 1998). A high number of repetitive elements in Xist and surrounding sequences, multiple inversions, and other rearrangements in the region, together with a very low level of Xist primary sequence conservation between various species, draw special attention to the features that remain conserved, that is, overall gene structure and the tandem repeat composition. The data obtained strongly support the hypothesis of involvement of repeats in the function of the gene, either as putative binding sites for DNA- or RNA-binding proteins (Brown et al. 1992) or as a chromatin organizing region through changing the conformation of DNA on transcription (Brockdorff et al. 1992).
METHODS
Animal Stocks and Cell Cultures
Four species representing the group of common vole, M. arvalis, were studied. M. arvalis and M. rossiaemeridionalis are found in Eurasia, whereas M. kirgisorum and M. transcaspicus are endemic to Middle Asia. Animals were trapped in their natural habitats and bred in the vivarium of the Institute of Cytology and Genetics (Novosibirsk, Russia). The relationships between species studied were described previously (Nesterova et al. 1998). Fibroblast cell cultures were established as described previously (Nesterova et al. 1994). Cell cultures used for making RNA were at passage 20–25.
Libraries and Probes for Screening
Genomic phage libraries were constructed for M. arvalis(male), M. rossiaemeridionalis (female), M. kirgisorum (female), and M. transcaspicus (female) by cloning partially Sau3A1-digested liver genomic DNA intoBamHI-digested vector λDASH II (Stratagene). The average size of cloned fragments was 16–20 kb. Unamplified libraries were screened for Xist-containing clones. Initially a single clone was isolated from a M. rossiaemeridionalis library using mouse cDNA clone W7d as a heterologous Xist probe (Brockdorff et al. 1992). Other vole clones were selected from the libraries using DNA from the 5′ or 3′ end of the isolated M. rossiaemeridionalishomologous sequence.
Oligo(dT)-primed cDNA library was generated according to the manufacturer instructions from female M. arvalis poly A+ RNA (Stratagene, ZAP-cDNA Synthesis and Cloning kits). Total RNA for the library was extracted from M. arvalis liver using RNAzolB (Biogenesis), and poly A+ mRNA was isolated with Oligotex kit (QIAGEN). cDNA library was screened with probes for the 3′ end of M. arvalis Xist exons 7 ( +15294–+16162) and 8 ( +20780–+21055).
Screening with mouse probes was performed in dextran buffer (10% dextran sulfate, 1% SDS, 5×SSC, 100 μg/mL of sonicated salmon sperm DNA) at 55°C overnight. After low stringency washes (2×SSC, 1% SDS) at room temperature the filters were exposed with X-omat film (Kodak) with intensifying screens overnight at −70°C. Hybridization with vole probes was performed at 65°C overnight following high stringency washes (0.2×SSC, 1% SDS) at 65°C.
DNA Sequencing and Sequence Analysis
DNA sequencing was performed using the T3/T7 Sequenase v.2.0 kit and the Thermo Sequenase radiolabeled terminator cycle sequencing kit (both Amersham Life Science). M. rossiaemeridionalis Xist gene was sequenced on both strands; Xist genes from the other species were sequenced only on one strand, except for regions of compressions and ambiguity results for which both strands were analyzed. DNA sequence analysis was performed usingDNASTAR software (DNASTAR Inc.), BLAST(Altschul et al. 1990), and FASTA (Pearson et al. 1988). Human (U80460) and mouse (X99946) sequences for comparative analysis were obtained from the GenBank database. Quantitative sequence alignment was accomplished with the CLUSTAL program (Higgins et al. 1988), and the comparative alignment of two sequences was made by applying LALIGN (Huang and Miller 1991) from the FASTA package. Low-gap penalty values were used for comparison of extended sequences. The statistical significance of homology between two sequences was tested with the RSS program from theFASTA package. For repeated DNA fragment searches, human and rodent databases were screened (Jurka et al. 2000). The comparison of long genomic fragments was performed using PipMaker(http://bio.cse.psu.edu; Schwartz et al. 2000). For PIP analysis the parameter “chaining” was used.
RNA Analysis
Ten micrograms of kidney total RNA was used for slot blot hybridization analysis. RNA was denatured in two volumes of deionized formamide, 0.7 volume 37% formaldehyde, 0.1 volume 20×SSC at 68°C for 15 min and then chilled on ice. Two volumes of 20×SSC were added to the denatured RNAs before immobilization on GeneScreen membrane (DuPont). Two ng of vole Xist λ DNA was used as a control. The membranes were hybridized with radiolabeled probes in 50% formamide, 10% dextran sulphate, 5×SSC, 1% SDS, 0.5×Denhardt solution, 100 μg/mL sonicated salmon sperm DNA at 42°C overnight. Filters were washed in 2×SSC at room temperature and then in 2×SSC, 1% SDS at 65°C for 15 to 30 min. Quantification of the hybridization signal was performed on PhosphorImager (Molecular Dynamics; Imagequant). The data were normalized to signal for 28S rRNA for loading control and to Xist λ signal for hybridization efficiency. The probes used were M. rossiaemeridionalis VP1 (−910–−562), VP2 ( +253–+803), and VP4 ( +1934–+2356).
Northern blot hybridization of 20 μg of total RNA to the exon 1 probe, Rx8Pst2 ( +4225–+6118), was performed as described elsewhere (Sambrook et al. 1989). Nuclease protection was performed using the S1 Nuclease Protection Assay Kit (Ambion) with modifications described previously (Johnston et al. 1998). Probes used were M. rossiaemeridionalis VR1 (−266–+265), VR2 ( +1174–+1678), VR3 ( +15881–+16160), and VR4 ( +18229–+18523). RT-PCR analysis and preparation of cDNA were performed as described by Kay et al. (1993). 3′ RACE was performed on total fibroblast RNA (M. arvalis andM. kirgisorum) or on poly A+ RNA (M. rossiaemeridionalis) using SMART RACE kit according to the manufacturer's instructions (Clontech). Primers 1f (cccacaacatcattgcccacaaca gag), 2f (cacttagtgtgacttacggatgccctg), and 3f (gtcacctccccaaccaactgc gaacga) were used in combination with UPM (universal primer mix) from the kit to amplify the specific RACE products. Hot start PCR was used to assure the high specificity of the products. The amplification conditions were as follows: 5 cycles of 94°C, 30 sec; 72°C, 3 min; 5 cycles of 94°C, 30 sec; 70°C, 30 sec; 72°C, 3 min; 25 cycles (20 for poly A+ RNA) of 94°C, 30 sec; 68°C, 30 sec; 72°C, 3 min. For primer 2f the first two steps were omitted because of the lower melting temperature of the primer, and PCR was performed for 25 cycles at 94°C, 30 sec; 68°C, 30 sec; 72°C, 3 min. Negative controls were performed for each individual primer. The specificity of the PCR fragments was checked by blot-hybridization with probe R31 ( +19948 to +20883, M. arvalis).
For the RNA secondary structure analysis, MFOLD (Mathews et al. 1999) and GeneBee-NET (Brodsky et al. 1995) programs were used.
Acknowledgments
We are grateful to the members of the X inactivation group for the discussion and valuable comments during preparation of this manuscript. This work was supported by the grants from the Russian Foundation for Basic Research (97-04-49231) and INTAS (94-2877 and 99-00284) and by the Medical Research Council of Great Britain. T.B.N. was supported by an international development award from the Wellcome Trust (UK).
The publication costs of this article were defrayed in part by payment of page charges. This article must therefore be hereby marked “advertisement” in accordance with 18 USC section 1734 solely to indicate this fact.
Footnotes
-
↵3 Corresponding author.
-
E-MAIL tatyana.nesterova{at}csc.mrc.ac.uk; FAX 44-(0)-208-383-8303.
-
Article and publication are at www.genome.org/cgi/doi/10.1101/gr.174901.
-
- Received December 11, 2000.
- Accepted February 27, 2001.
- Cold Spring Harbor Laboratory Press


