
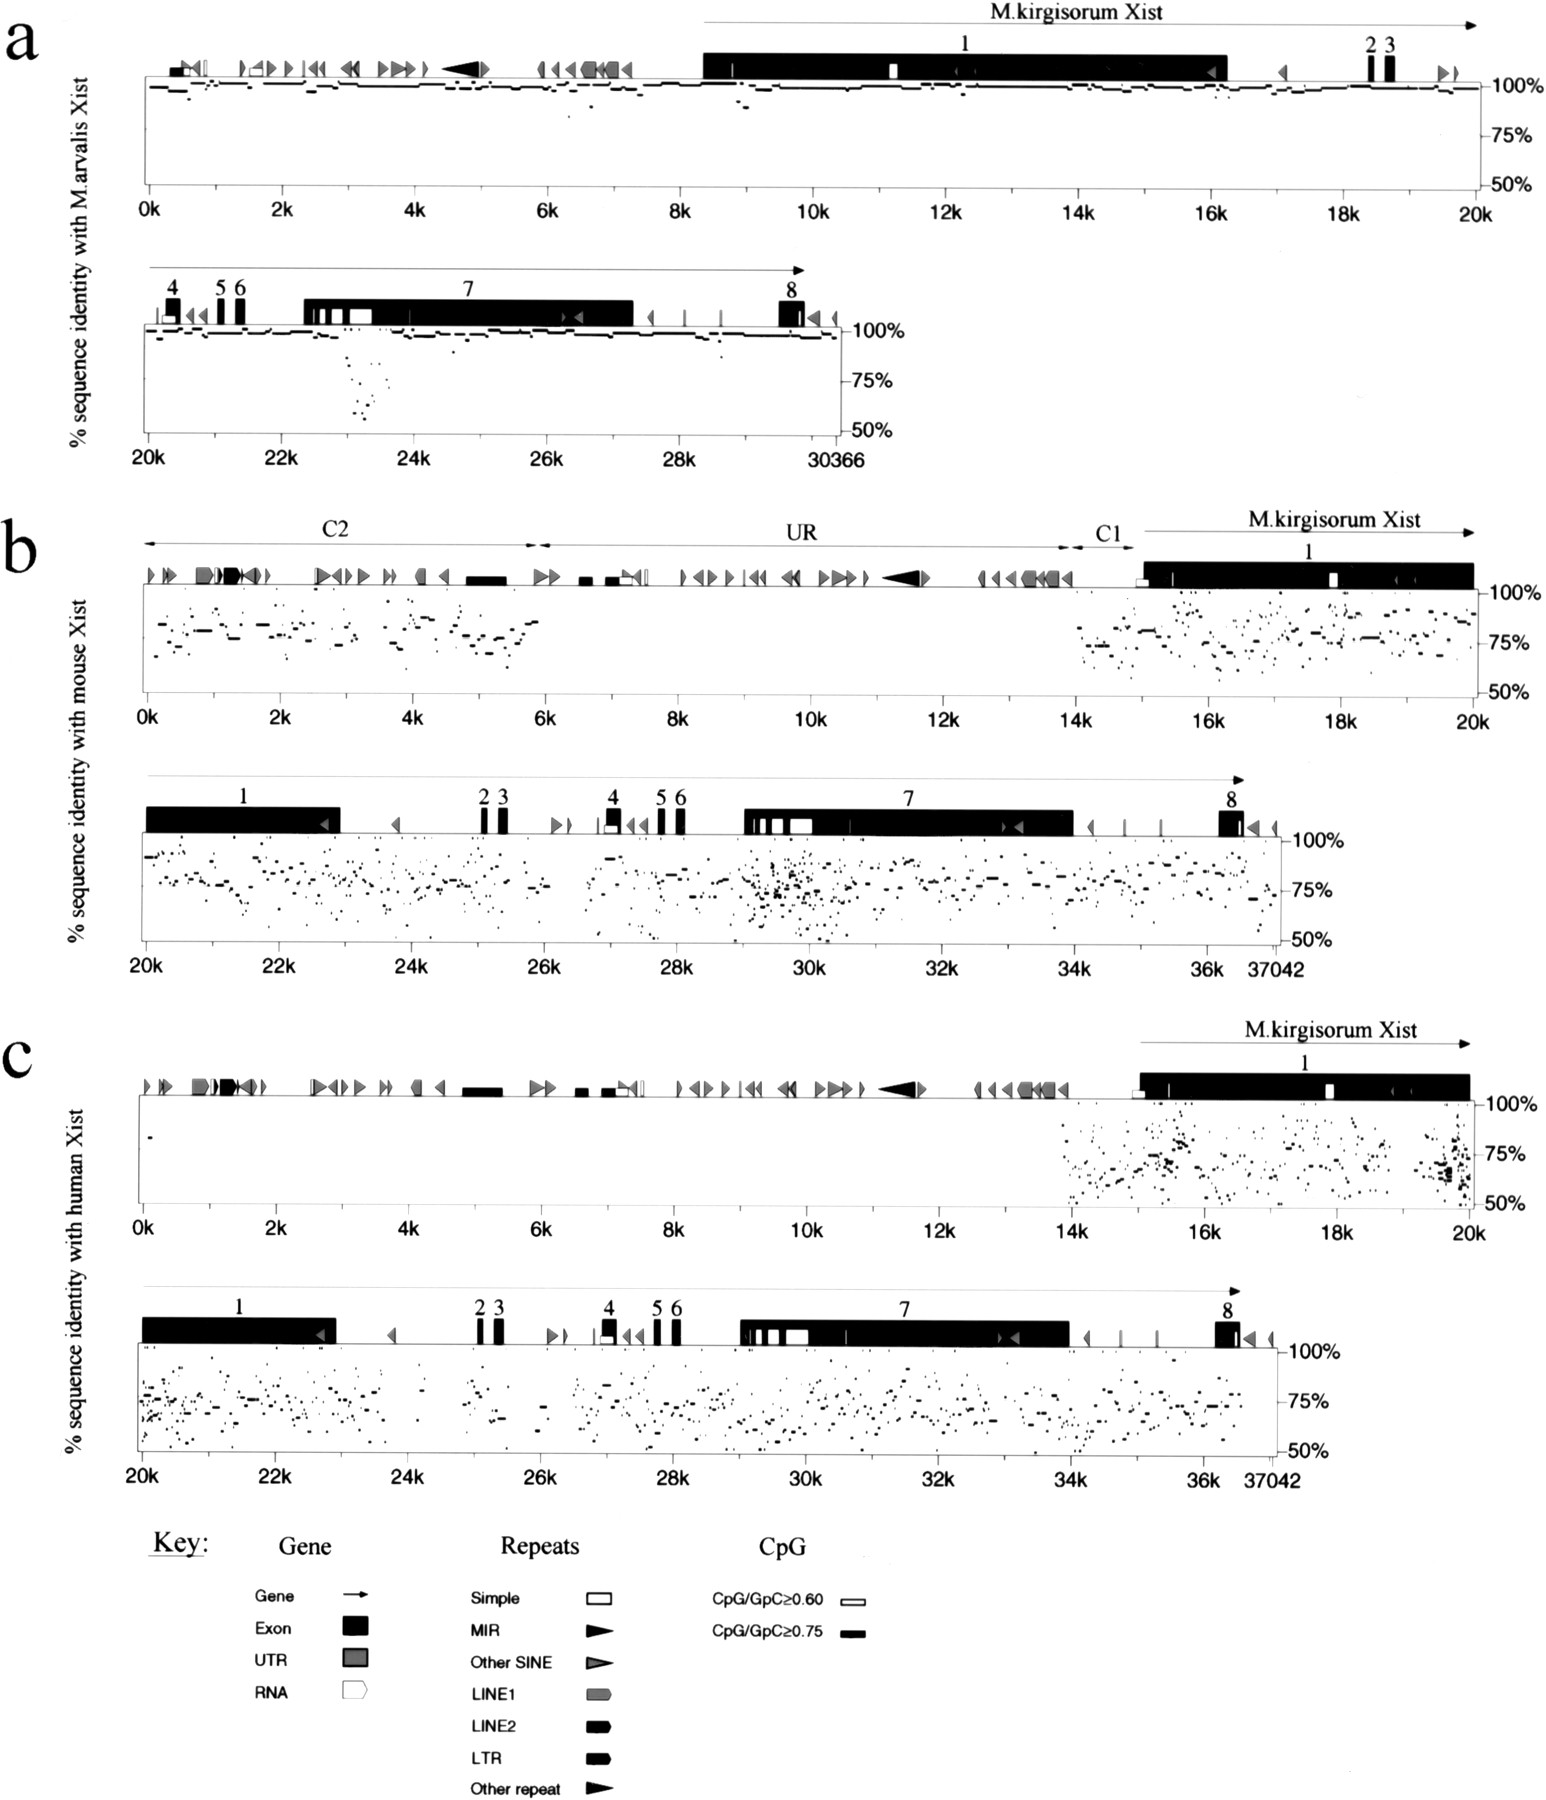
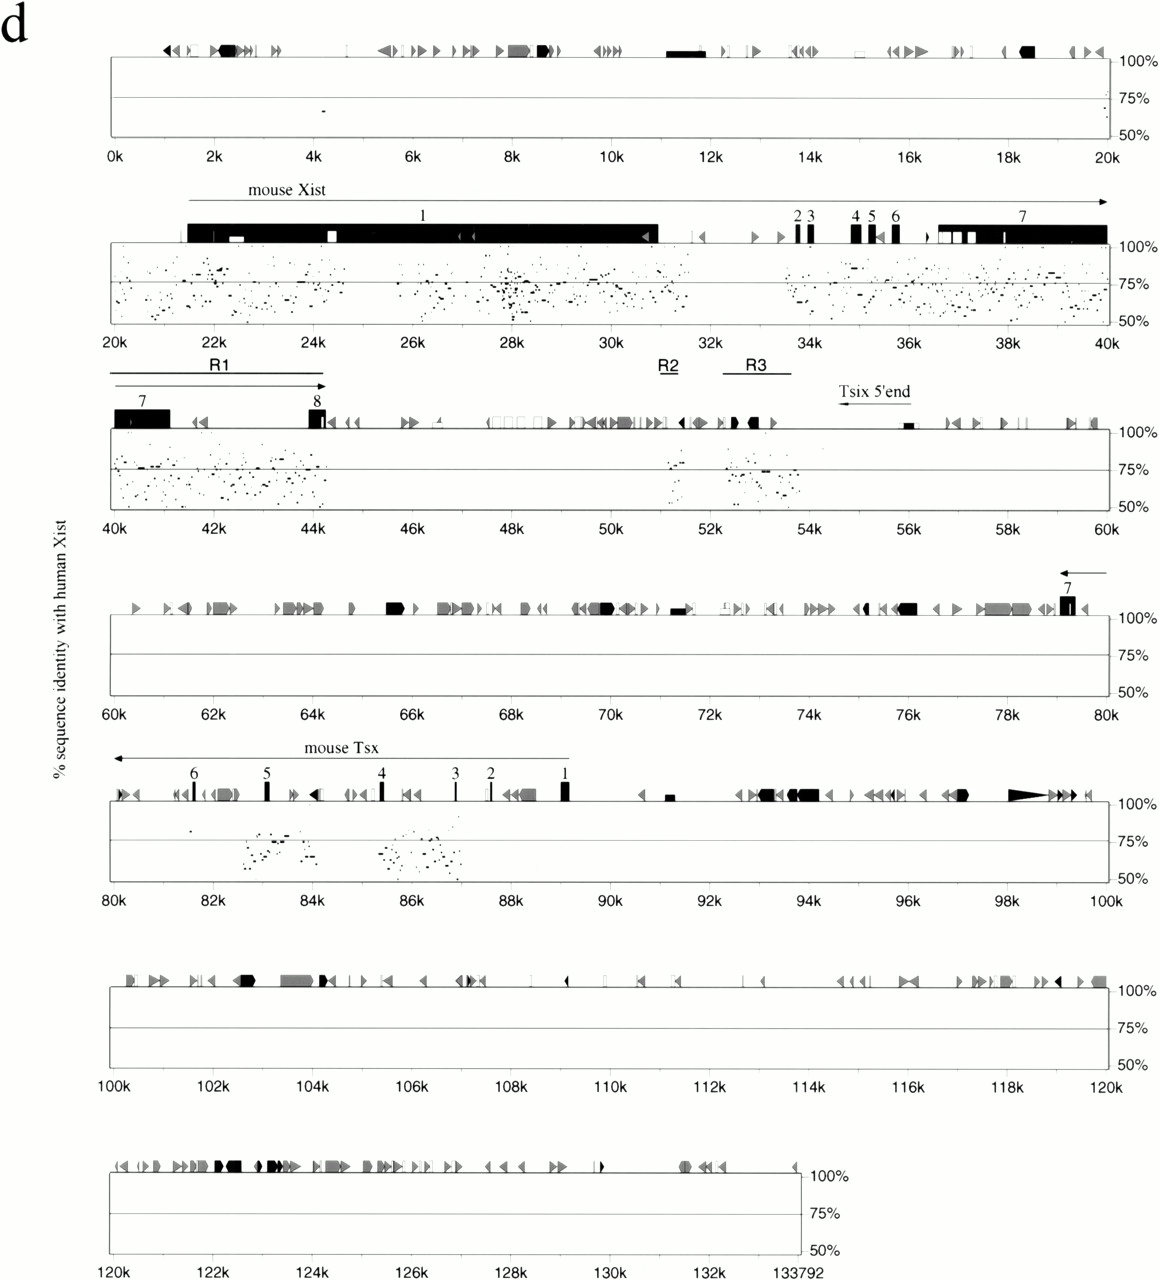

Comparative analysis of Xist gene in vole, mouse and human. (a) Percent identity plot (PIP) of M. kirgisorum Xistrelative to M. arvalis Xist. M. kirgisorum genomic sequence is shown on the X axis, and the percentage of its identity (50%–100%) to M. arvalis Xist is shown on theY axis. Black boxes illustrate Xist exons; the other sequence features and repeat elements are indicated with shape and shade coded icons (see annotation underneath Figure, panel c). (b) PIP of M. kirgisorum Xist (X axis) relative to mouse Xist (Y axis). (c) PIP ofM. kirgisorum Xist (X axis) relative to humanXist (Y axis). (d) PIP of mouseXist (X axis) relative to human Xist(Y axis); regions 1, 2, and 3 (Lee et al. 1999) are marked as R1, R2, and R3, respectively. (e) PIP of human Xist(X axis) relative to mouse Xist (Y axis); regions 1, 2, and 3 (Lee et al. 1999) are marked as R1, R2, and R3, respectively. (f) Comparison of SINE, LINE, LTR elements and total interspersed repeat representation in the Xist upstream sequence of M. arvalis (A), M. rossiaemeridionalis(R), M. transcaspicus (T), M. kirgisorum (K), M. musculus (M), and H. sapiens (H). The Y axis represents the percentage of genomic Xist upstream sequence occupied by repeat elements. (Figure continues on following page.)


