
Spatially Restricted Hypopigmentation Associated with an Ednrbs -Modifying Locus on Mouse Chromosome 10
- Hyangshuk Rhim1,2,
- Karen J. Dunn1,
- Anna Aronzon1,
- Susanna Mac3,
- Mickie Cheng3,
- M. Lynn Lamoreux4,
- Shirley M. Tilghman3, and
- William J. Pavan1,5
- 1Genetic Disease Research Branch, National Human Genome Research Institute, National Institutes of Health (NIH), Bethesda, Maryland 20892-4472 USA; 2Research Institute of Molecular Genetics Catholic Research Institutes of Medical Science, The Catholic University, Seoul, Korea; 3Department of Molecular Biology and The Howard Hughes Medical Institute (HHMI), Princeton University, Princeton, New Jersey 08544 USA; 4Texas A & M University, Department of Veterinary Pathobiology, College Station, Texas 77843 USA
Abstract
We have used the varied expressivity of white spotting (hypopigmentation) observed in intrasubspecific crosses ofEdnrbs mice (MayerEdnrbs/Ednrbs and C3HeB/FeJEdnrbs/Ednrbs ) to analyze the effects of modifier loci on the patterning of hypopigmentation. We have confirmed that an Ednrbs modifier locus is present on mouse Chromosome 10. This locus is now termed k10, using the nomenclature established by Dunn in 1920. Thek10Mayer allele is a recessive modifier that accounts for almost all of the genetic variance of dorsal hypopigmentation. Using intercross analyses we identified a second allele of this locus or a closely linked gene termedk10C3H . The k10C3H allele is semidominant and is associated with the penetrance and expressivity of a white forelock phenotype similar to that seen in Waardenburg syndrome. Molecular linkage analysis was used to determine that thek10 critical interval was flanked by D10Mit10 andD10Mit162/D10Mit122 and cosegregates with mast cell growth factor (Mgf). Complementation crosses with aMgfSl allele (a 3–5-cM deletion) confirm the semidominant white forelock feature of the k10C3H allele and the dorsal spotting feature of K10Mayer allele. MgF was assessed as a candidate gene fork10Mayer and k10C3H by sequence and genomic analyses. No molecular differences were observed between the Mayer and C57BL/6J alleles of MgF; however, extensive genomic differences were observed between the C3HeB/FeJ and C57BL/6J alleles. This suggests that alteration of MgF expression in C3H mice may account for the k10C3H action on white forelock hypopigmentation. Crosses of Ednrbs withKitWJ-2 (the receptor for MGF)-deficient mice confirmed the hypothesis that synergistic interaction between the Endothelin and MGF signaling pathways regulates proper neural crest-derived melanocyte development in vivo.
Epidermal melanocytes are responsible for pigmentation of skin and hair. They are one of several distinct cell types derived from an early embryonic and multipotent structure called the neural crest. Proper pigmentation of the skin and hair is a complex process that requires spatial and temporal molecular interactions (Jackson et al. 1994). The subset of neural crest cells that are precursors of melanocytes (melanoblasts) can first be identified at the dorsal ridge of the developing embryo (Opdecamp et al. 1997). Subsequently, melanoblasts proliferate and migrate along a dorsal–lateral pathway to populate the embryo in a dorsal-to-ventral pattern (Rawles 1947). Coinciding with the dorsal-to-ventral migration is a migration of melanoblasts from the mesenchymal layer to the embryonic ectoderm (Mayer 1973). Subsets of melanoblasts enter invaginating hair follicles and differentiate into melanin-producing cells; others remain in the epidermis and dermis of the skin.
Abnormalities in any step of the neural crest–melanocyte differentiation pathway result in absence of melanocytes in portions of the skin, hair, and inner ear (Barsh 1996; Jackson 1997). This condition is referred to as white spotting in mouse and hypopigmentation in humans. Lack of melanocytes in the inner ear results in deafness (Steel and Barkway 1989; Cable and Steel 1991). More than 20 different mouse mutants exist that display hypopigmentation defects (Silvers 1979). The mutants provide tools to dissect the genetic interactions that are required for proper melanocyte development. The proteins encoded by the genes altered in these mutants range from transcription factors to ligand/receptor signaling molecules. The transcription factors include Mitf in micropthalmia mice (Hodgkinson et al. 1993), Pax3 in Splotch mice (Epstein et al. 1991), and Sox10 in Dominant megacolon mice (Southard-Smith et al. 1998). Mutations have also been identified in tyrosine kinase and seven-transmembrane receptors. Disruption of either Mast cell growth factor (Mgf) in Steel mice or its tyrosine kinase receptor, Kit, in Dominant spotting mice results in pleiotropic abnormalities that include hypopigmentation, anemia, and sterility (Chabot et al. 1988; Geissler et al. 1988;Copeland et al. 1990; Huang et al. 1990; Zsebo et al. 1990). Mutations in the seven-transmembrane receptor, Endothelin receptor B (piebald or Ednrbs ), one of its ligands, Endothelin 3 (lethal spotting or Edn3ls ), or Endothelin-converting enzyme 1 result in hypopigmentation and loss of enteric ganglia (Baynash et al. 1994; Hosoda et al. 1994; Yanagisawa et al. 1998).
Mutations have also been found in the human orthologs of these genes in patients with neural crest diseases (neurocristopathy). One neurocristopathy is Hirschsprung disease [HSCR, Online Mendelian Inheritance in Man (OMIM) no. 142623]. HSCR is characterized as a lack of neural crest-derived enteric ganglia in a variable portion of the distal colon. HSCR can also be associated with hypopigmentation caused by a lack of melanocytes in restricted portions of the skin. This disorder is referred to as Waardenburg–HSCR (or WS-4, OMIM no. 277580). The hypopigmentation in WS-4 often presents as a white forelock and can be associated with deafness.
Mutations in EDNRB have been identified in human individuals with HSCR and WS-4 (Puffenberger et al. 1994). The variable hypopigmentation and deafness seen in HSCR individuals demonstrates incomplete penetrance and variable expressivity. This has been proposed to be caused by gene dosage as some individuals heterozygous forEDNRB mutations have HSCR, whereas those homozygous forEDNRB mutations have WS-4 (Puffenberger et al. 1994). However, there is also evidence that the variability may arise from unlinked genetic modifiers (Puffenberger et al. 1994). In this scenario, theEDNRB mutation sensitizes the system by reducing the melanocyte population close to the threshold level required for complete pigmentation. Coinheritance of modifier loci that may not be sufficient to cause hypopigmentation alone reduces the melanocyte population below the threshold, thereby resulting in hypopigmentation.
One powerful approach to identify genes that modify the severity or patterning of genetic defects is using quantitative tract loci (QTL) analysis with intersubspecific crosses of mice (Frankel 1995). A modifier of hypopigmentation in EDNRB mutant mice would be a candidate locus for a WS-4 modifier in humans. Work initiated by Dunn in 1920 demonstrated that the severity of hypopigmentation in “pied” (now referred to as piebald orEdnrbs/Ednrbs ) mutant mice is dependent on the contribution of multiple genes having quantitative effects (Dunn 1920, 1937; Dunn and Charles 1937). By selectively breeding forEdnrbs/Ednrbs mice that exhibited large variations in the severity of hypopigmentation, a set of modifiers was described, termed the k-complex.
In an effort to identify k-complex genes, we set out to map loci that are responsible for modifying the severity and patterning of hypopigmentation in two strains ofEdnrbs/Ednrbs mice that display different amounts of hypopigmentation in their coats (Fig. 1). The C3H Ednrbs/Ednrbs mice have a white patch of hair on the head very similar to the white forelock associated with WS and a hypopigmented patch on the abdomen, but they have very few white patches on the dorsal surface. In contrast, the Mayer strain of Ednrbs/Ednrbs mice exhibits extensive hypopigmentation on both the dorsal and ventral surfaces yet lacks the white forelock. Using QTL linkage analysis we demonstrated that the variations in the severity and patterning of hypopigmentation were due to the presence of multiple recessive modifiers unlinked to theEdnrb locus (Pavan et al. 1995). A 25-cM region on Chromosome 10 accounted for almost half of the genetic variance when homozygous for the Mayer allele, yet its contribution to hypopigmentation on the dorsal surface was greater than on the ventral surface. Mgf is located within this 25-cM interval and was proposed as a candidate gene for this modifier locus. This study examines the Chromosome 10 modifier locus in more detail and assesses Mgf as the gene responsible for the spatial effects of hypopigmentation associated with these mouse strains.
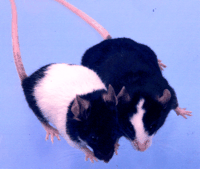
The two strains of Ednrbs/Ednrbs mice used in this study. The Mayer Ednrbs/Ednrbs mice (left) exhibit a high degree of spotting with a sharp delineation between the pigmented and nonpigmented areas of the coat yet lack a white forelock. The C3HEdnrbs/Ednrbs mice (right) exhibit a reduced amount of spotting on both dorsal and ventral surfaces yet have a prominent white forelock.
RESULTS
Phenotype Distributions of a BC1 Cross
To screen for modifiers of neural crest development and WS-4 phenotypes, we are analyzing loci that modify the severity and patterning of hypopigmentation using the Ednrbs mouse model of WS-4. Our studies use two strains ofEdnrbs/Ednrbs mice that display different amounts and patterns of hypopigmentation in their coats (Fig. 1). Ninety-one BC1 mice were generated using stocks of MayerEdnrbs/Ednrbs and C3HEdnrbs/Ednrbs colonies that were established following rederivation at the National Institute of Health (NIH) mouse facilities to provide confirmation of linkage and verify that the Chromosome 10 modifier was still segregating in the rederived Mayer Ednrbs/Ednrbs stock (Table 1; Fig.2).
Distribution of Phenotypes in Parental Strains and Crosses
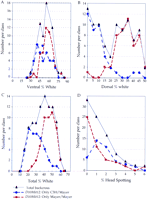
Distribution of the 91 backcross progeny genotypes at the k10modifier locus. The severity of hypopigmentation was expressed as a percentage of the total surface area. These data were placed into 5% increments of hypopigmentation and plotted against the number of animals in each class. (A–D) Distribution of hypopigmentation in 91 backcross progeny on the ventral, dorsal, total, and head surfaces, respectively. Total backcross distribution is represented by the gray line. The red and blue broken lines represent the distribution of animals that are homozygous and heterozygous for the Mayer allele at k10 locus, respectively.
Phenotypic analysis of the ventral hypopigmentation in BC1progeny revealed similar results to our initial studies (Table 1). In contrast, the distribution of dorsal hypopigmentation in the 91 BC1 mice was now bimodal (Fig. 2) (not skewed unimodal), suggesting another locus that affects dorsal hypopigmentation was lost during rederivation. The bimodal distribution is consistent with a single, major, modifier locus accounting for the majority of the dorsal hypopigmentation.
Linkage Analysis Confirms the Presence of a Hypopigmentation Modifier Locus, k10, on Mouse Chromosome 10
Inheritance of mouse Chromosome 10 in the 91 BC1 progeny derived from the Mayer and C3H strains was determined by genotype analysis using three polymorphic microsatellite markers: two flanking loci (D10Mit10 and D10Mit103) and one locus that is closely linked to the putative modifier locus (D10Mit12) (Pavan et al. 1995). There was a significant increase in dorsal hypopigmentation in animals that were homozygous for the Mayer allele of D10Mit12 (P < 0.0001) (Table 2; Fig.2). Comparison of the phenotypic versus genotypic distributions demonstrates almost complete overlap of the bimodal distributions for both dorsal hypopigmentation and homozygosity for the Mayer allele of D10Mit12 (Fig. 2). This result confirms our hypothesis that a locus modifying hypopigmentation inEdnrbs/Ednrbs mice exists near this marker. This locus accounts for almost all of the dorsal genetic variance yet only a small portion of the ventral variance. The contribution of this locus to ventral hypopigmentation is most likely secondary to effects on dorsal surface (see below).
k10 Demonstrates Spatially Restricted Effects on Hypopigmentation
Dunn proposed that some of the pied modifier loci are themselves spotting genes in the absence of the major pied mutation. Mice that are homozygous for the Mayer allele of D10Mit12 and are wild type at the Ednrb locus exhibit a small ventral spot (n = 3/3; data not shown), suggesting that the modifier is not a major spotting gene but can cause hypopigmentation in the absence of the sensitizing Ednrb mutation. This falls into the definition of the k-complex established by Dunn (1920). We call this locus k10, for the inheritance of the Chromosome 10 allele of a k-complex gene. The Mayer allele of this locus is referred to ask10Mayer .
The k10 Locus Has Spatially Restricted Effects on Head and Dorsal Hypopigmentation
As seen previously (Pavan et al. 1995) there was no significant difference in the relative increase in dorsal versus ventral hypopigmentation in the entire backcross. However, animals scoringk10Mayer/k10Mayer demonstrated a significantly greater influence on hypopigmentation on the dorsal as opposed to the ventral surfaces ofEdnrbs/Ednrbs mice (P < 0.0001). Detailed analysis of the phenotypic variation in these crosses allowed us to identify a third spatial variation in hypopigmentation, a white forelock, which was significantly linked to the k10 locus (Table 2 and Fig. 2). Interestingly, the increased hypopigmentation was associated with inheritance of the C3H allele and not the Mayer allele. This is also apparent in the parent strains (Fig. 1 and Table 1). Thus two distinct spatial effects on hypopigmentation are associated with k10: In the k10Mayer/k10Mayer genotype there is increased dorsal but a decreased forelock hypopigmentation; in thek10C3H/k10Mayer genotype there is decreased dorsal and increased forelock hypopigmentation. These spatially restricted effects on hypopigmentation could result from actions by two alleles of one gene or from altered activities in two closely linked loci.
Intercross Analyses Are Consistent with the C3H Allele ofk10 Locus, or a Closely Linked Locus, Being Associated with Head Hypopigmentation
To assess the inheritance of the white forelock phenotype in more detail, we used an intercross of mice derived from mating of (C3H Ednrbs/Ednrbs × MayerEdnrbs/Ednrbs ) F1 mice. The distribution of hypopigmentation in these crosses is consistent with contribution by modifier loci (Table 1; Fig. 3). In contrast to the bimodal distribution of dorsal hypopigmentation seen in the backcross progeny, the distribution of dorsal hypopigmentation in the intercross progeny is distributed in a skewed curve to low hypopigmentation, consistent with the hypothesis of a recessive modifier locus affecting dorsal hypopigmentation. Linkage analysis with these intercross mice using the closely linked marker D10Mit12demonstrated significant linkage with dorsal, however not with ventral hypopigmentation (Table 3). Analysis of the three possible genotypes for dorsal hypopigmentation demonstrated thatk10Mayer/k10Mayer is significantly whiter than k10Mayer/k10C3H andk10C3H/k10C3H , which were indistinguishable in hypopigmentation. This result is consistent with the hypothesis that the k10Mayer allele is recessive in its effect on dorsal spotting and that its subtle effects on ventral spotting are likely to be secondary to its effects on dorsal spotting.
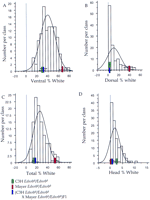
Distribution of hypopigmentation in 113 intercross progeny. Data is represented as described for the 91 backcross progeny outlined in the legend to Fig. 2. Colored blocks placed on the x-axis represent the mean percent hypopigmentation of C3HEdnrbs/Ednrbs (green) and MayerEdnrbs/Ednrbs (red) parental strains andEdnrbs/Ednrbs F1 hybrids (blue) with one s.d. indicated by parallel lines.
Genetic Analysis of the k10 Locus Using Intercross Progeny
Results from these analyses also confirm the significant association of head hypopigmentation with the k10C3H allele (Table3). Animals k10C3H/k10C3H demonstrated a significantly larger white forelock thank10C3H/k10Mayer animals. Both of these genotypes had significantly larger white forelocks thank10Mayer/k10Mayer animals. Therefore, in contrast to the recessive mode of action of enhanced dorsal hypopigmentation with the k10Mayer allele, thek10C3H allele acts as a semidominant modifier. Specifically, k10C3H increases the penetrance and size of the anterior white forelock inEdnrbs/Ednrbs mice while decreasing the posterior dorsal hypopigmentation. The use of this intercross panel confirms our previous observations of two alleles at the same locus or two tightly linked loci affecting spotting on the anterior–posterior axis, k10C3H enhancing the white forelock, andk10Mayer enhancing dorsal hypopigmentation.
Linkage Analysis Implicates MgF as a Candidate Gene for Variations in Dorsal Hypopigmentation and White Forelock
Comparison of the location of D10Mit12 to the mouse genome consensus map implicated Mgf as a candidate gene for the spatially restricted alterations in pigmentation observed at thek10 locus. To further refine the genetic interval that contains the k10 modifier locus, and to assess Mgf as a candidate gene, we performed additional linkage analyses using the 291 animal backcross progeny (Fig. 4). Nine polymorphic microsatellite markers and a PCR-based, size variation assay for Mgf (see Methods) were typed on progeny that were recombinant between D10Mit10 and D10Mit103. Assessment of linkage was accomplished using Mann-WhitneyU-test (not shown) and interval mapping (Fig. 4) was accomplished using Map Manager QTB6 (http://mcbio.med.buffalo.edu/mmQT.html). As would be predicted from the high correlation between phenotype and the k10 locus, significant linkage was observed using both methods. The k10locus colocalized with five loci: four microsatellite markers (D10Mit12, D10Mit96, D10Mit178,D10Mit170) and Mgf. Linkage decreased significantly using markers progressively further away on each side of this locus. The k10 locus is flanked by D10Mit10 proximally andD10Mit162/D10Mit122 distally. These results are consistent with Mgf being a candidate gene for the k10 locus.
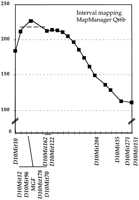
Interval mapping of the k10 modifier locus. The 46 backcross progeny that were recombinant between D10Mit10 andD10Mit151 were genotyped using 9 additional SSLP markers andMgf. The relative position of the k10 locus to these markers was determined using the Map Manager QTB6 interval-mapping program (Manly 1998; Manly and Olson 1999; K.F. Manly and R.H. Cudmore, unpubl.) (http://mcbio.med.buffalo.edu/mapmgr.html). Thex-axis represents relative order and distance between marker in cM. The y-axis represents the score of linkage. Four markers and Mgf colocalize with k10. The heavy broken line represents a decrease of 10 in the statistic value.
Comparative Analysis of Mgf
To assess Mgf as a candidate, comparative analysis of the cDNA and genomic structure was undertaken. Two isoforms have been described for Mgf, a soluble and a transmembrane form, that arise from alternative mRNA splicing (Huang et al. 1992). RT-PCR analysis using RNA isolated from lung, testes, and embryo of MayerEdnrbs/Ednrbs and C3HEdnrbs/Ednrbs animals demonstrated that both isoforms of Mgf were present in these samples (data not shown). No sequence variations were identified between Mgf in Mayer and the wild-type C57BL/6J sequence (GenBank accession no.U44725). However, the ORF sequence of the C3H allele of Mgfhas three nucleotide variations (Brannan et al. 1992). These include T250C silent, G971T silent, and G803T Ala–Ser. It is possible that the Ala-207–Ser amino acid substitution, located at the carboxyl terminus extracellular domain (amino acids 25–214), is responsible for the subtle effects on hypopigmentation observed in C3H mice. However, this is unlikely because position 207 is variable between species: Ser in rat, pig, cow, and dog; Pro in man and cat; Asn in chicken; and Glu in sheep and horse.
Extensive alterations were apparent in the genomic structure and genomic sequence of C3H Mgf as determined by a combination of Southern blot analysis, genome PCR, and DNA sequencing (Fig.5). Twelve restriction enzymes were used to assay for genomic polymorphisms between Mayer and C3H genomic DNA. All enzymes demonstrated at least one restriction fragment length polymorphism (not shown). No polymorphisms were observed using Ednrb andEdn3 as hybridization probes suggesting that widespread sequence diversity is not present (not shown). A partial restriction map of the Mgf locus was assembled usingEcoRI to determine the positions of the poly-morphisms relative to the Mgf gene structure. Comparison of the maps determined that polymorphisms were detected in introns 1, 2, and 3 (Fig. 5). Interexon PCR also identified a size polymorphism in intron 7 with extensive sequence divergence between the strains (Mayer = C57BL/6J ≄′ C3HeB). These results suggest that the C3H allele is evolutionarily divergent from the Mayer and B6 alleles.
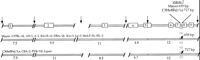
Genomic organization of Mgf. Partial EcoRI restriction map. Arrows indicate sites of EcoRI restriction enzyme sites. Numbered and intervening boxes represent exons and introns, respectively. Gaps between boxes indicate that additional sequences could be located within this region as total genomic DNA and not a physical clone was used for mapping. Therefore, all fragments may not be identified by Southern blot analysis. Open boxes below represent the structure seen in C57BL/6J/Mayer and C3H, respectively. Numbers below open boxes represent the size of the EcoRI restriction fragments observed for the given fragments. A size polymorphism exists in intron 7 consisting of a repeat expansion and extensive sequence diversity.
To explore further whether any of the alterations in genomic sequence and/or structure were likely to be responsible for the variations in hypopigmentation patterning, we determined the prevalence of these polymorphisms in several other inbred strains of mice using Southern blot analysis with EcoRI and PCR analysis (Fig. 5). To our surprise, the Mayer strain shared its sequence and structure with most other inbred strains. C3H was relatively unique, sharing its structure with only CBA/J, FVB/NJ, and Lipari (Fig. 5). Comparison of theMgf alleles to the predicted origins of strains (Strong 1942;Atchley and Fitch 1985, 1991), indicated that the Mayer allele ofMgf was found in several strains of mice that are predicted to have arisen from different founders (data not shown). In contrast to the Mayer Mgf allele, the C3H Mgf allele is relatively rare, found in more closely related strains (data not shown). Therefore, if an alteration in the Mayer allele of theMgf gene accounts for the increased dorsal hypopigmentation, it is in an as-yet-unidentified mutation in the noncoding region of the gene. However, the C3H-associated white forelock phenotype may be due to altered MGF function caused by the coding polymorphism G803T Ala–Ser, or by altered expression resulting from any of the genomic structure polymorphisms we observed in the C3H strain.
Crosses with a Mutant Allele of MGF Confirms the Spatially Restricted Hypopigmentation with Both k10Mayer and k10C3H Alleles
To further examine the spatial action of the k10 alleles and to test the hypothesis that functionally polymorphic alleles ofMgf exist in the C3H and Mayer strains, we used complementation analysis (Bedell et al. 1996a) with a deletion allele of Mgf (MgfSl ) that arose and has been maintained on the C3H background. The extent of the deletion was determined by molecular analyses (Fig. 6). Results from this analysis indicate that three microsatellite markers (D10Mit178, D10Mit70, and D10Mit162) are deleted in addition to Mgf. However, proximal k10critical region markers, D10Mit12 and D10Mit96, are not deleted in this Mgf allele. Comparison of the deletion map with the distance estimated by the consensus maps for mouse Chromosome 10 (http://www.informatics.jax.org/bin/ccr/contents?&year=1999&chr=10) indicates that the MgfSl deletion is 3–5 cM (Fig. 6). Therefore it is certain that additional genes are deleted at this locus. However, this deletion only covers approximately one-half of the k10 critical region.
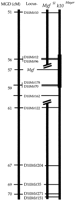
Summary of the region deleted in MgfSl allele. Marker types and distances were obtained from MGD (http://www.informatics.jax.org/bin/ccr/contents?&year=1999&chr=10) and are indicated in the left bar. Markers deleted inMgfSl are indicated in the middle bar. These were scored by loss of heterozygosity for a C3H B6 polymorphism in MgfSl /B6 mice. D10Mit12 andD10Mit96 colocalize with k10 yet are not deleted inMgfSl mice.
For this genetic analysis, C3H MgfSl mice were crossed to mice segregating the three alleles of k10 and analyzed for the effect of compound heterozygotes on hypopigmentation. Mice included MayerEdnrbs/Ednrbs , C3HEdnrbs/Ednrbs , C3H+/+, C57BL/6J+/+, (Mayer Ednrbs/Ednrbs × C3HEdnrbs/Ednrbs )F1, and (C3H+/+ × C57BL/6J+/+)F1 (Tables 4 and 5; Fig.7). F1control crosses were included to randomize the genetic background thereby reducing the likelihood of having additional, unlinked modifier loci being homozygous in the test crosses. This genetically isolates the analysis to the k10 modifier locus. Three genotypes of mice were compared: MgfSl/k10C3H ,MgfSl/k10Mayer , andMgfSl/k10B6 .
Test Crosses of C3H and Mayer alleles of k10 Using theMgfSl Mutation
Test Crosses of C3H and C57BL/6J Alleles of k10 Using theMgfSl Mutation
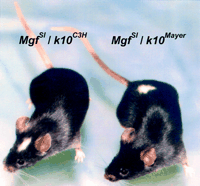
Spatially restricted hypopigmentation caused by the k10complex alleles. (Left)MgfSl/k10Mayer mice demonstrated a lack of white forelock and a clearly demarcated dorsal back spot. (Right) MgfSl/k10C3H mice lack the dorsal back spot but present with a white forelock.
The mice were scored for head spots and dorsal spots. We found that allMgfSl/k10C3H mice exhibited head spots whereas none of theMgfSl/k10B6 orMgfSl/k10Mayer exhibited head spots (Tables 4 and 5). In contrast,MgfSl/k10Mayer mice demonstrated a new phenotype, a dorsal midline spot (Fig. 7) in 50%–73% of the animals. This dorsal hypopigmentation region never occurred inMgfSl/k10C3H orMgfSl/k10B6 mice. Neither of these hypopigmentation patterns required animals to be homozygous for the Ednrbs allele. The white forelock phenotype did not require mice to be heterozygous for Ednrbs indicating that no genetic interaction of the MgF and Ednrballeles is required for the head spotting phenotype in these mice. These test crosses confirmed our initial finding of divergent affects of k10Mayer and k10C3H on modifying the severity and anterior–posterior pattern of hypopigmentation in spotted mice.
DISCUSSION
Evidence that mouse breeders used selective breeding to obtain desired coat spotting patterns can be found in publications from the 1700s (Koide et al. 1998). In fact, spotted rodents were the first experimental organisms used to study quantitative trait loci (Bateson 1903; MacCurdy et al. 1907). In a classic study, Dunn (1937) used selective breeding of pied (Ednrbs ) and “variegated white spotting” (KitW ) mice to demonstrate the existence of modifier loci that affect the amounts and patterns of white spotting. Some of these modifier loci had general, nonspecific effects because they acted on both mutations. Other modifiers affected only one of the spotting genes.
Our initial studies used QTL analysis to identify four loci that modify the severity of hypopigmentation in two strains ofEdnrbs/Ednrbs mice (Fig. 1; Pavan et al. 1995). The modifier that accounted for the majority of the genetic variance in dorsal hypopigmentation was linked to D10Mit12 on Chromosome 10; however, the region was defined only to ∼25 cM. This study uses additional backcross and intercross progeny mice to confirm the existence of a modifier locus in this region, to explore its mode of action, and to assess Mgf as a candidate gene. The modifier locus on Chromosome 10 is now termed k10 based on the nomenclature established by Dunn and Charles (1937).
Results from linkage analysis demonstrate that the k10 locus accounts for almost all of the variation in dorsal hypopigmentation contributed by the Mayer strain. The k10Mayer modifier allele is recessive in its effects on dorsal spotting. However it does not directly contribute to increases in ventral hypopigmentation. The manner by which k10Mayer specifically affects dorsal pigmentation is not known. In the melanocyte developmental pathway, the melanoblasts initiate migration at the dorsal surface. Migration proceeds along a dorsolateral pathway to populate the entire surface of the embryo with the ventral surface being the last to be colonized. The adult melanocytes derive from very few melanoblast precursors that must proliferate extensively during development (Mintz 1967). The k10Mayer modifier may act to reduce this initial number of melanoblasts because of a temporally restricted inhibitory action or a lack of a mitogenic action early in development. The remaining melanoblasts might not be subject to further restraints later in development, thereby allowing melanoblast clones to continue proliferating and migrating to the ventral surface and filling in the empty spaces in the skin. Evidence to support this theory comes from coculture recombination experiments (Mayer 1965, 1967a,b) where neural tubes and skin were combined from mutant and normal embryos. Mayer identified a melanocyte inhibitory effect when skin was from 11.0 days post coitum (dpc) MayerEdnrbs/Ednrbs embryos but not C57BL/6J embryos. This inhibitory effect was transient, not seen using 16.5 dpc Mayer Ednrbs/Ednrbs embryonic skin.
An alternative hypothesis is that the k10Mayer modifier effects are caused by spatially restricted action. The locus may specifically restrict hypopigmentation to the dorsal surface by directed misexpression or lack of expression of an essential factor on the dorsal or ventral surface. This type of action on melanocyte function is seen in one allele of the agouti locus (black and tan,at ) (Dunn 1928). The agouti gene is involved in determining the switch in pigment synthesis between a black/brown pigment and yellow pigment in melanocytes (Bultman et al. 1992). Theat allele results in mice with a black dorsum but a tan ventrum (Poole and Silvers 1976; Bultman et al. 1994). Molecular analysis of the agouti gene was used to determine that this dorsal-to-ventral difference in pigmentation is caused by disruption of regulatory regions that are located 100 kb apart (Bultman et al. 1994;Michaud et al. 1994). A similar type of mutation in Mayer mice could be envisioned for the k10Mayer allele.
A highly plausible candidate gene for the k10Mayer is Mgf, which colocalizes with k10 in our crosses. Mice that are deficient for this gene completely lack melanocytes, probably because of a lack of secondary migration of melanoblasts, which require the MGF signal for survival (Steel et al. 1992; Mackenzie et al. 1997). Similar to Agouti, Mgf expression is controlled by regulatory regions that are hundreds of kilobases away from the structural gene (Bedell et al. 1995, 1996b). Therefore it is conceivable that a minor perturbation in Mgfexpression/function, when combined with a sensitizing Ednrbmutation, would result in decreased pigmentation. However, no differences were observed between the sequence or genomic structure ofMgf between Mayer and C57BL/6J strains.
To test the hypothesis that k10Mayer is a hypomorphic allele of Mgf we used complementation analysis (Bedell et al. 1996a) (Fig. 7). Given the variations that occur in hypopigmentation due to modifiers in different backgrounds of mice, we used a null allele of Mgf (MgfSl ) that arose and has been maintained on the C3H background.MgfSl is null, as it is a deletion of 3–5 cM surrounding this locus (Fig. 6). WhenMgfSl was placed in combination with thek10Mayer or k10B6 ,MgfSl/k10Mayer resulted in dorsal hypopigmented spot but no forelock, andMgfSl/K10B6 resulted in no dorsal hypopigmentation at all. Interestingly,k10Mayer/k10Mayer;Ednrbs /+ mice demonstrated no dorsal spotting (n = 5/5; data not shown) indicating that being homozygous for k10Mayer is not sufficient to increase dorsal spotting; but either being homozygous for Ednrbs or being compound heterozygous withMgfSl can increase dorsal hypopigmentation. These results are consistent with the association ofk10Mayer with an increase in dorsal spotting but not head hypopigmentation. BecauseMgfSl/k10Mayer;Ednrbs /+ mice are more white thank10Mayer/k10Mayer;Ednrbs /+ mice, our results are also consistent with partial noncomplementation of a hypomorphic allele. Additional analyses are needed to determine whether the effects of k10Mayer are due to alterations in MGF function or allelic interactions between two closely linked but distinct genes.
We have also determined that the expressivity of a white forelock is influenced by a modifier locus attributed to Chromosome 10. However, it is the C3H allele of k10 that we previously ascribed to increasing pigmentation on the dorsal surface ofEdnrbs/Ednrbs mice. This locus, termedk10C3H , is either allelic tok10Mayer or Mgf and/or is a closely linked locus. The k10C3H allele is semidominant, but unlikek10Mayer, k10C3H requires a sensitizing mutation such as Ednrbs to result in hypopigmentation. The penetrance of the white forelock was increased when the K10C3H allele was placed in combination with MgfSl even in the absence ofEdnrbs mutations. However, the Mgf deletion allele used in this study arose on the C3H strain. Therefore, it is also possible that we are not monitoring noncomplementation of head hypopigmentation of a semidominant allele, but instead homozygosity of a closely linked gene in C3H that lowers the threshold for melanocyte deficiencies in the presence of Mgf or Ednrbheterozygous mutations. This is unlikely as heterozygosity fork10C3H increases the penetrance of head spotting in another mouse spotting mutant, Dominant megacolon,Sox10Dom in a B6 background (Southard-Smith et al. 1999). In addition, a third allele of Mgf (Steel-Dickie,MgfSl-D ) that arose on the DBA background, has the C57BL/6J Mgf structure. Mice that areMgfSl-D/K10C3H exhibit a white forelock, whereas MgfSl-d/K10B6 lack a white forelock (M. Bedell, unpubl.).
The existence of modifiers that control melanocyte and melanoblast numbers has been described (Hirobe 1982, 1988). Hirobe has examined melanocyte and melanoblast numbers in neonatal mice using a combined DOPA–ammoniacal silver nitrate staining. The C57BL10 strain had significantly higher numbers of melanocytes and melanoblasts than the C3H strain. The F1 animals had intermediate numbers, backcrosses to either parental strain had a 1:1 ratio of high/low, and the intercross population had a 1:2:1 distribution. These results are consistent with a single semidominant gene acting to control the size of the melanocyte populations in C57BL10 and C3H animals. Hirobe suggests that this difference is due to reduced mitotic index (proliferation) in the C3H strain. Although the C57BL10 strain has more melanocytes than C57BL/6J (Hirobe 1992), linkage analysis with these samples would be useful to determine if the locus identified by Hirobe cosegregates with k10.
Although Hirobe's experiments focused on the genetic variation of melanocyte numbers, others have focused on the basis for the pigmented patterns that occur in predictable areas of spotted mice (Dunn and Charles 1937; Mintz 1967; Schaible 1969; Lamoreux and Russell 1979;Lamoreux 1981; Pavan et al. 1995). In Schaible's theory, there are melanoblast centers located in specific regions of the embryo. The absence of the progenitor melanoblast for a center leads to a specific white spot at that area. We have proposed a modification of this theory (Pavan and Tilghman 1994) in which these melanoblast centers are actually sites of high dopachrome tautomerase-positive (Dct+) cell numbers early in embryogenesis. It is the failure of expansion of these areas that leads to regions devoid of melanocytes. We observed that many Dct+ cells are located around the eyes, otocysts, and snout at 11.5 dpc where pigmented patches often remain in mutants. We propose that between 11.5 dpc and birth, melanoblasts migrate into or differentiate into melanocytes in the forehead region. A delay in migration or differentiation would cause spotting. A reduced proliferative capacity of melanoblasts in C3H mice (Hirobe 1988) could therefore cause this white forelock phenotype in a sensitized strain such as the Ednrbs, Sox10Dom , orMgfSl mice.
Mgf is also a candidate for k10C3H . Unlike what was seen in Mayer Ednrbs/Ednrbs , extensive variation was demonstrated in the genomic locus of Mgf in C3H mice. We can only postulate that a dominant alteration of Mgfmay be responsible for this phenotype. However, results from in vitro studies using neural crest explants are consistent with synergistic interactions between the Endothelin and MGF–KIT signaling pathways (Murphy et al. 1992; Reid et al. 1995, 1996; Opdecamp et al. 1997; Ono et al. 1998). Addition of both EDN3 and MGF to explant cultures results in a synergistic increase in melanocyte numbers in part because of an increase in proliferation of KIT+ melanoblasts (Reid et al. 1996;Opdecamp et al. 1997). Both factors are needed for the increased number of pigmented melanocytes, as addition of MGF without EDN3 results in nonpigmented melanocytes (Reid et al. 1996; Opdecamp et al. 1997; Kos et al. 1999) and the increase in melanocyte numbers seen by addition of EDN3 in neural crest cultures is dependent on the presence of MGF (Ono et al. 1998).
If there are synergistic interactions between the EDNRB and MGF signaling pathways, increased hypopigmentation would be expected in mice that carry mutations in EDNRB and in the MGF receptor KIT. Dunn and Charles describe synergistic effects of combining Kit and Ednrb mutations (Dunn 1937; Dunn and Charles 1937) however, they were not done using inbred mice. To examine synergy between these mutant loci, C57BL/6J Ednrbs/Ednrbs mice were crossed with C57BL/6J KitWJ-2 /+ mice and examined at weaning for the severity of hypopigmentation in comparison to parental controls (data not shown). C57BL/6J Ednrbs /+;KitWJ-2 /+ animals were significantly whiter than either Ednrbs /+ or KitWJ-2 /+ mice (58.1% ± 19.49%, 0% ± 0%, and 8.5% ± 4.59%, respectively). C57BL/6J Ednrbs /+;KitWJ-2 /+ animals were backcrossed toEdnrbs/Ednrbs mice. TheEdnrbs/Ednrbs; KitWJ-2 /+ animals that resulted were almost completely white (99.0% ± 2.81%). This is similar to results obtained by Dunn and Charles, suggesting that the reason for synergism between these two signaling pathways was not the modifier loci. Significantly more white is seen than can be explained by additive effects of both loci. The results demonstrate that alteration in KIT function, when combined with hypomorphic EDNRB signaling, causes profound effects on hypopigmentation. This result is consistent with our hypothesis of functional synergistic interactions between the EDNRB and MGF–KIT signaling pathways in vivo. Therefore, it is feasible to assume that a combination of a reduction of Endothelin signaling in Ednrbs/Ednrbs mice combined with altered MGF–KIT signaling because of a subtle reduction in MGF during critical times (Nishikawa et al. 1991; Okura et al. 1995) could explain the increase in hypopigmentation.
Our experiments support the notion that allelic differences in the Mayer and C3H alleles of k10 cause the spatially diverse hypopigmentation patterns in piebald mice. However, whetherk10 is allelic to Mgf or is a closely linked gene has not been formally established. Additional linkage analysis and expression studies are needed to determine ifk10Mayer and k10C3H and/orMgf can be separated genetically. The correlation of a modifier locus with a white forelock in mice may be relevant to human diseases, as not all HSCR patients with mutations in EDNRB or SOX10 exhibit the white forelock phenotype or have auditory defects. Auditory system defects have also been observed in EDNRB mutant mice (Deol 1967). Human 12q22, the location of human MGF, should be tested for association with the hypopigmentation and auditory function observed in these individuals. Analysis of loci that modify the auditory defects in Ednrbs/Ednrbs mice may also help to identify additional candidate loci responsible for deafness in individuals with WS-4.
METHODS
Strains of Mice Used for These Studies
Three strains of Ednrbs mice were used for these studies. The strain C3HeB/FeJLe a/a Ednrbs/Ednrbs (C3H Ednrbs/Ednrbs ) was provided by Dr. Nancy Jenkins (NCI-FCRDC, Frederick, MD). MayerEdnrbs/Ednrbs mice were kindly provided by Dr. Thomas C. Mayer (1965). The MayerEdnrbs/Ednrbs strain was originally generated by selecting highly spottedEdnrbs/Ednrbs mice on an unknown genetic background. These mice have been selectively bred for a high percentage of hypopigmentation for >20 years. For this study, the MayerEdnrbs/Ednrbs strain was rederived from Princeton University into the NIH facility using two breeder pairs. This process resulted in a bottleneck of the population prior to expansion of the colony. The third strain, C57BL/6JEdnrbs/Ednrbs (B6Ednrbs/Ednrbs ), was obtained on the C57BL/6J background from The Jackson Laboratory and maintained by M.L. Lamoreux with occasional backcrosses to C57BL/6J.
The Steel deletion allele of MGF (MgfSl ) arose spontaneously at the Oak Ridge National Laboratory in the C3H strain and has been maintained on a C3HeB background (Wolf 1978;Copeland et al. 1990). C3HeB/FeJLe a/a and C57BL/6J mice, as well as DNA from strains listed in Figure 6, were obtained from The Jackson Laboratory. C57BL/6J KitWJ-2 arose as a spontaneous mutation on the C57BL/6J background, was obtained by M.L. Lamoreux (Jackson Laboratory), and maintained for >20 years with occasional backcrosses to C57BL/6J. NIH guidelines for animal care were followed for these experiments.
Phenotypic Analyses
All animals were killed by CO2 asphyxiation at 5–8 weeks of age. For quantitative hypopigmentation analyses, photographs were taken of the dorsal and ventral surfaces, and tail clippings and liver samples were removed for DNA analyses. Photographs were enlarged 200% using a photocopy machine, and a planimeter was used to determine the total and spotted areas on the surfaces of each mouse. For the second backcross of 91 animals and the 133 intercross progeny, the total and spotted areas were determined using NIH image software. To control for variations in size between animals, the percent white (the white area/the total area × 100) was calculated for the dorsal and ventral surfaces of each animal. Total hypopigmentation was calculated as the average hypopigmentation of the dorsal and ventral surfaces. To determine whether the k10 locus increased hypopigmentation in a spatially restricted pattern, the absolute values of percent hypopigmentation were converted to the increase in percent hypopigmentation relative to the mean value of the entire sample population, regardless of genotype. Therefore, the relative increase or decrease in hypopigmentation between the two regions can be analyzed using a paired comparison.
Descriptive statistics and analyses of variance were generated using the Statview statistical analysis program (Abacus Concepts, Inc.). For graphical representations of the data in Figures 2 and 3, mice were placed into 5% incremental categories of percent white. However for all calculations and genotype determinations, exact values were used.
Genotype Analysis
Genomic DNA for genotype analyses by PCR was prepared from mouse tail clippings. Aliquots of DNA were diluted 1:30 with H2O, and 5 μl (∼50 ng) was used in a 20-μl PCR reaction containing 1.5 mm MgCl2, 50 mmKCl, 10 mm Tris-HCl (pH 8.3), 3 pmoles each of a primer pair, 0.2 mm dNTP, 0.5 units of AmpliTaq. The thermocycling temperatures used were 94°C for 15 sec, 55°C for 45 sec, and 72°C for 1 min for a total of 30 cycles. The PCR products were resolved by nondenaturing conditions as indicated [Map pair/% Acrylamide/mAmpheres/time (hr)]: D10Mit12, D10Mit96,D10Mit10/10/65/1; D10Mit178, D10Mit12,D10Mit35/15/55/2; D10Mit70, D10Mit162,D10Mit204/18/55/2.5. To genotype for the Mgf locus, PCR was done using primers SlF (forward primer), 5′-TTCGCTTGTAATTGGCTTTG-3′, and SlD (reverse primer), 5′-CTGCCCTTGTAAGACTTGACTG-3′. This product spans intron 7 and is polymorphic in part because of a size variation in a dinucleotide repeat. Standard PCR conditions were used with the following cycling characteristics: 94°C for 1 min, 55°C for 1 min, and 72°C for 3 min, for 30 cycles.
Mgf Genomic Organization Using Southern Blot Analysis
Genomic DNAs were digested with restriction endonucleases (BgII, BgIII, EcoRI, EcoRV,HindIII, KpnI, NcoI, PstI,PvuII, SacI) to identify restriction fragment length polymorphisms. Reaction mixtures (30 μl) containing 10 μg of mouse genomic DNA, 2.5 mm spermidine, appropriate endonuclease reaction buffer, and 30 units of a restriction endonuclease were then incubated for 16 hr at 37°C. DNA fragments were separated on a 0.6% agarose gel containing 0.5× TBE buffer (45 mm Tris-borate and 1 mm EDTA at pH 8.3) electrophoresed for 24 hr at 50 V. Denatured DNA fragments were transferred to Hybond N+ membrane (Amersham) and hybridized with uniformly labeled 32P probes. Hybridization was performed at 55°C in Church buffer containing 500 mm sodium phosphate buffer at pH 7.2, 1 mm EDTA, 1% BSA, and 7% SDS (Church and Gilbert 1984). Blots were washed with 2× SSC (1× SSC = 150 mm NaCl and 15 mm sodium citrate at pH 7.0) and 0.5% SDS for 30 min at 55°C. Radiolabeled probe was removed from the membrane prior to hybridization with the second probe by incubation in 0.4 n NaOH for 30 min at 45°C and then twice in 0.1× SSC, 0.1% SDS, 0.2 m Tris-HCl at pH 7.5.
pWP4 a plasmid that contains a full-length Mgf cDNA (W.J. Pavan, unpubl.), was used as a template to generate exon-specific probes by PCR (see below). Random priming reaction mixtures contained 20 ng of the PCR-amplified template, 4.5 nmoles of p(dNTP)6(Pharmacia), 20 μm of dATP, dGTP, and dTTP, 50 mm Tris-HCl (pH 8.0), 5 mm MgCl2, 10 mm β-mercaptoethanol, 200 mm HEPES–NaOH buffer (pH 6.6), 0.4 mg/ml BSA, 30 μCi [α-32P]dCTP (3000 Ci/mmole, Amersham), and 2 units of Klenow fragment (BRL) and then incubated at 37°C for 2 hr. The 32P-labeled probe was purified by a G-25 column.
Acknowledgments
We thank Dr. Thomas Mayer for insightful discussions on melanocyte development in piebald mice and providing his strain of mice. Dr. Nancy Jenkins generously provided the C3HEdnrbs/Ednrbs mice and theMgfSl mutant. We thank Dr. Ken Manly for Map Manager qtb6 and helpful advice on its use. We also thank Drs. Mary Bedell, Heinz Arnhieter, Leslie Biesecker, Anthony Wynshaw-Boris, Tim O'Brien, Soumitra Ghosh, and members of the Pavan laboratory for helpful discussions. A.A. was a HHMI Scholar. M.L.L. acknowledges support from NIH grant EY10233. S.M.T is an investigator in the HHMI.
The publication costs of this article were defrayed in part by payment of page charges. This article must therefore be hereby marked “advertisement” in accordance with 18 USC section 1734 solely to indicate this fact.
Footnotes
-
↵5 Corresponding author.
-
E-MAIL bpavan{at}nhgri.nih.gov; FAX (301) 402-2170.
-
- Received September 9, 1999.
- Accepted November 3, 1999.
- Cold Spring Harbor Laboratory Press


