
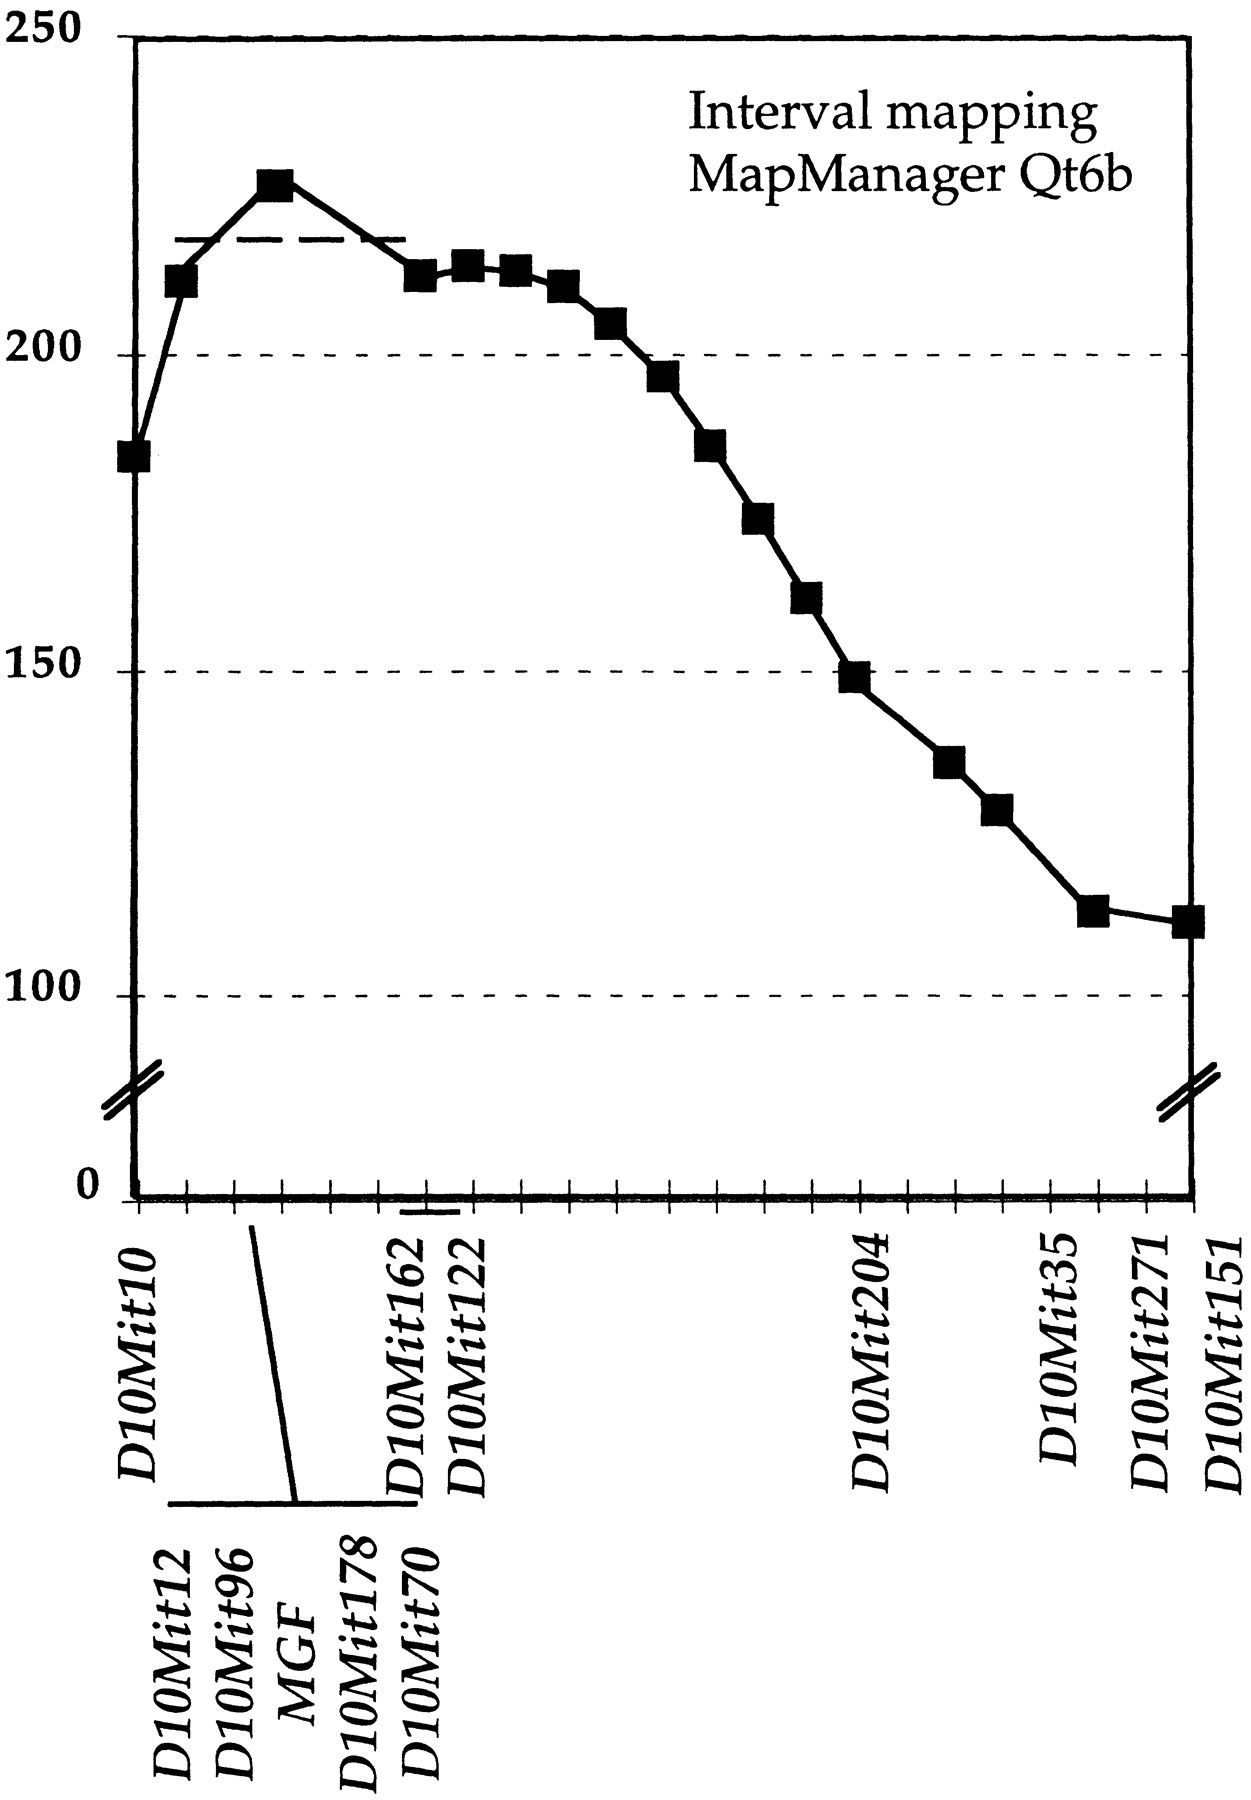
Figure 4.
Interval mapping of the k10 modifier locus. The 46 backcross progeny that were recombinant between D10Mit10 andD10Mit151 were genotyped using 9 additional SSLP markers andMgf. The relative position of the k10 locus to these markers was determined using the Map Manager QTB6 interval-mapping program (Manly 1998; Manly and Olson 1999; K.F. Manly and R.H. Cudmore, unpubl.) (http://mcbio.med.buffalo.edu/mapmgr.html). Thex-axis represents relative order and distance between marker in cM. The y-axis represents the score of linkage. Four markers and Mgf colocalize with k10. The heavy broken line represents a decrease of 10 in the statistic value.


