
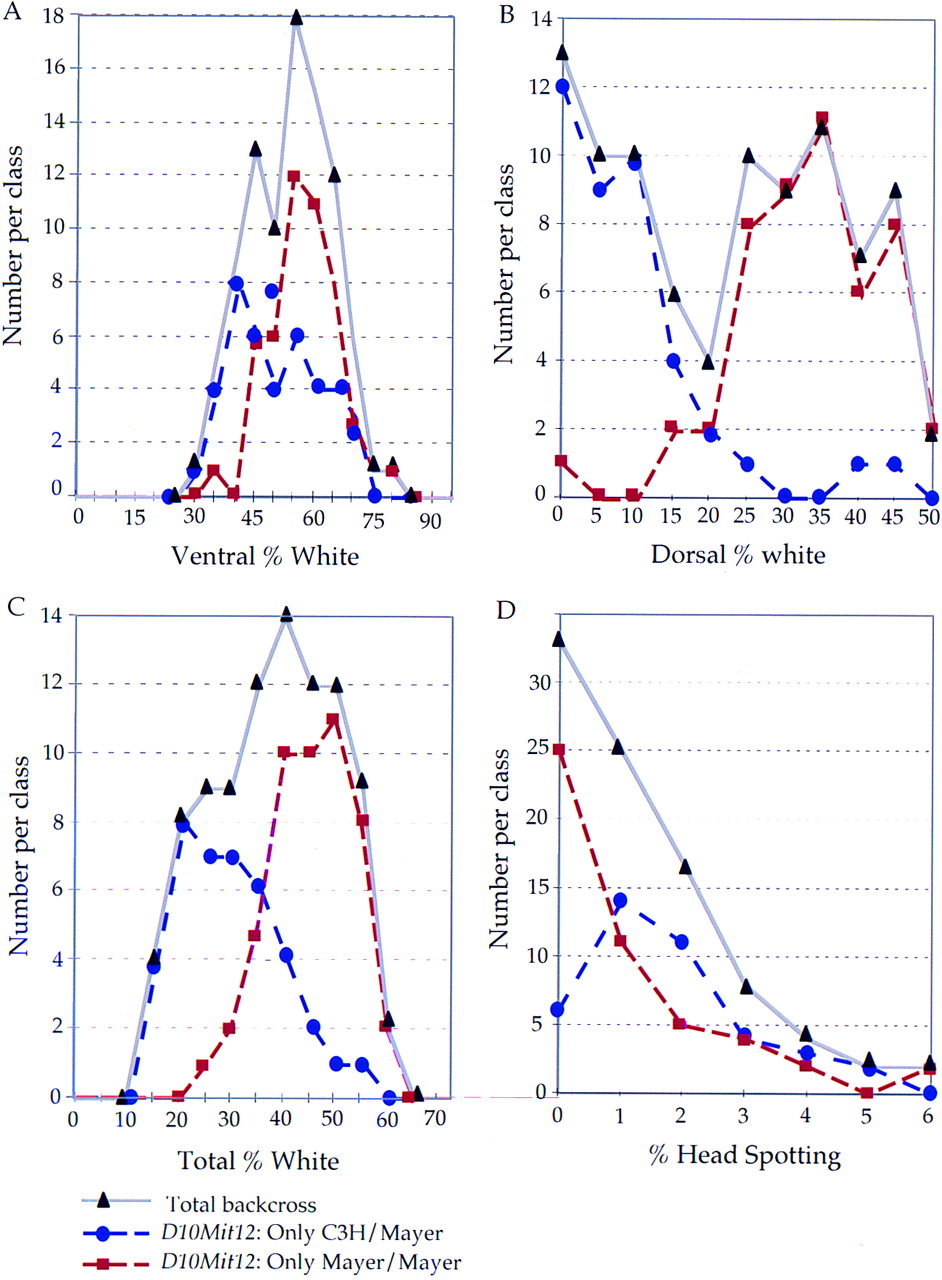
Figure 2.
Distribution of the 91 backcross progeny genotypes at the k10modifier locus. The severity of hypopigmentation was expressed as a percentage of the total surface area. These data were placed into 5% increments of hypopigmentation and plotted against the number of animals in each class. (A–D) Distribution of hypopigmentation in 91 backcross progeny on the ventral, dorsal, total, and head surfaces, respectively. Total backcross distribution is represented by the gray line. The red and blue broken lines represent the distribution of animals that are homozygous and heterozygous for the Mayer allele at k10 locus, respectively.


