
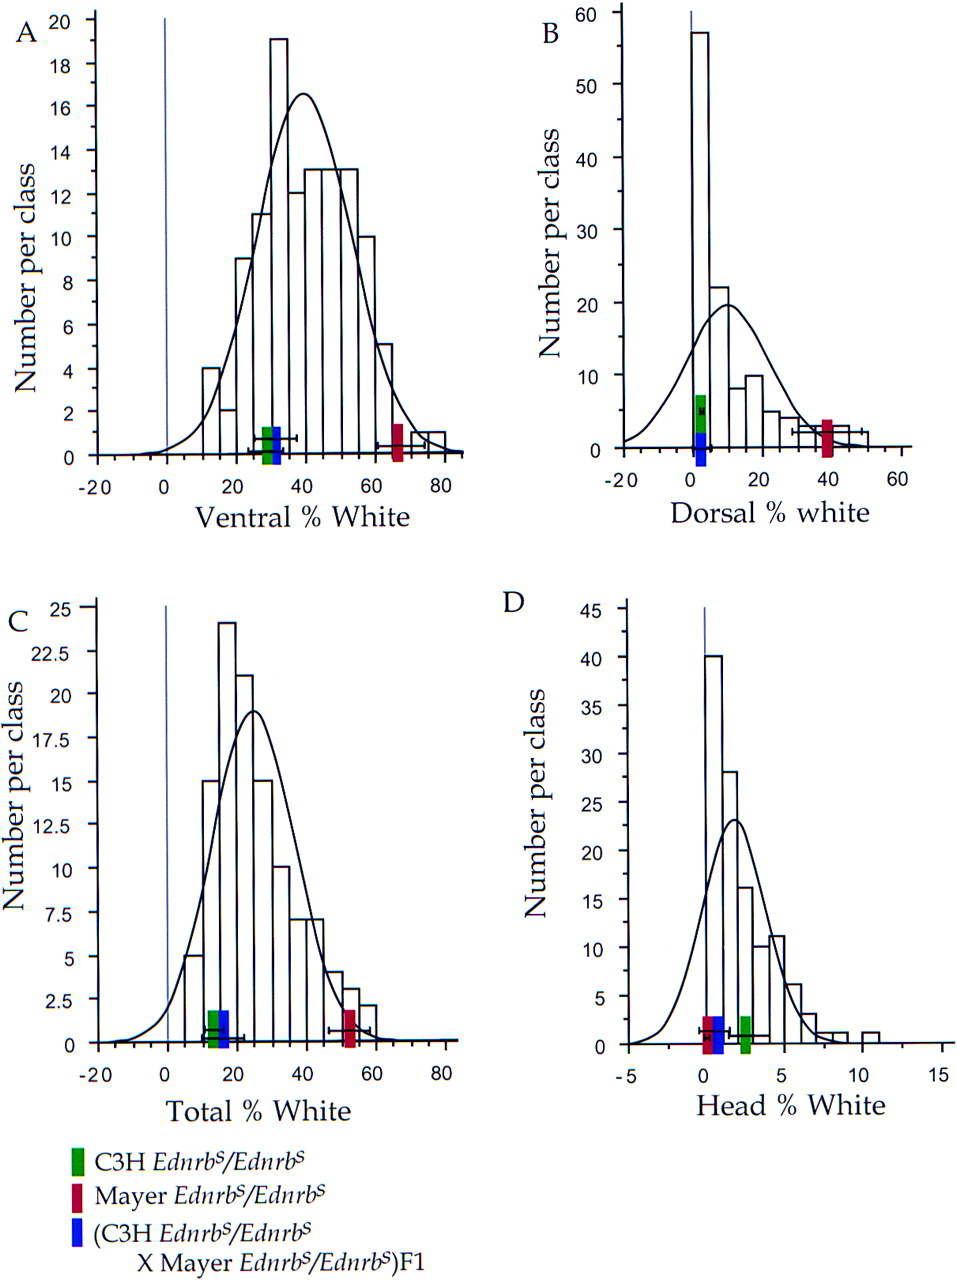
Figure 3.
Distribution of hypopigmentation in 113 intercross progeny. Data is represented as described for the 91 backcross progeny outlined in the legend to Fig. 2. Colored blocks placed on the x-axis represent the mean percent hypopigmentation of C3HEdnrbs/Ednrbs (green) and MayerEdnrbs/Ednrbs (red) parental strains andEdnrbs/Ednrbs F1 hybrids (blue) with one s.d. indicated by parallel lines.


