
Abstract
TILLING (Targeting Induced LocalLesions in Genomes) is a general reverse-genetic strategy that provides an allelic series of induced point mutations in genes of interest. High-throughput TILLING allows the rapid and low-cost discovery of induced point mutations in populations of chemically mutagenized individuals. As chemical mutagenesis is widely applicable and mutation detection for TILLING is dependent only on sufficient yield of PCR products, TILLING can be applied to most organisms. We have developed TILLING as a service to the Arabidopsis community known as the ArabidopsisTILLING Project (ATP). Our goal is to rapidly deliver allelic series of ethylmethanesulfonate-induced mutations in target 1-kb loci requested by the international research community. In the first year of public operation, ATP has discovered, sequenced, and delivered >1000 mutations in >100 genes ordered by Arabidopsis researchers. The tools and methodologies described here can be adapted to create similar facilities for other organisms.
In the genomics era, the availability of gene sequences is the first step to understanding gene function on a whole-genome scale. One prerequisite for this understanding is the development of tools capable of determining gene function in the context of a whole organism and on a large scale. For many model organisms this goal has already been approached through development of a variety of gene knockout strategies (e.g., see Zambrowicz et al. 1998; Liu et al. 1999; Ross-Macdonald et al. 1999; Winzeler et al. 1999; Fraser et al. 2000; Piano et al. 2000; Giaever et al. 2002). In other organisms, the increasing availability of genomic and cDNA sequence information encourages the development of reverse-genetic tools.
For Arabidopsis, the goal of profoundly understanding genomic sequence information has been promulgated by the National Science Foundation with a program to determine the function of all ∼25,000Arabidopsis genes by the year 2010 (http://www.nsf.gov/pubs/2001/nsf0113/nsf0113.htm). InArabidopsis, T-DNA insertional mutagenesis is the main technique for high-throughput whole-genome analysis, and a large number of sequenced T-DNA insertions are now available for in silico analysis (http://www.Arabidopsis.org/links/insertion.html). However, as projects approach completion, returns diminish, and thus targeted methods will be needed to approach the goal of knocking out all of the genes in an organism. This is especially the case for small genes, which present small targets for T-DNA insertion. Furthermore, many genes are essential, and insertions in these genes will predominantly cause lethality, necessitating the generation of less severe mutations to understand gene function. Indeed, an allelic series that provides a range of phenotypic severity is often desirable, because it can allow a relatively sophisticated understanding of gene function.
TILLING (Targeting Induced LocalLesions in Genomes) is a general reverse-genetic method combining random chemical mutagenesis with PCR-based screening to identify point mutations in regions of interest (McCallum et al. 2000a). We have described the use of the mismatch cleavage endonuclease CEL I and gel electrophoresis in TILLING to provide a low cost, high-throughput platform for mutation discovery (Colbert et al. 2001). In high-throughput TILLING, regions of interest are amplified by PCR. Heteroduplexes between wild-type fragments and fragments harboring an induced mutation are formed by denaturing and reannealing PCR products. These heteroduplexes are cleaved by CEL I. Cleaved products are then resolved using denaturing polyacrylamide gel electrophoresis. To increase throughput, samples are pooled eightfold. Following discovery in a pool, individual DNAs from the pool are rescreened, thus identifying the mutant plant and the approximate position of the mutation along the sequence. Sequencing to complete the analysis is greatly aided by the mapping information gained from determining the electrophoretic mobilities of the cleavage products. As TILLING produces an allelic series of induced point mutations, including missense and truncation lesions, it is useful both in organisms, such as Arabidopsis, with sophisticated gene knockout methods, and in organisms lacking practical reverse-genetics tools, where a knockout would be highly desirable.
We have developed high-throughput TILLING as a service to theArabidopsis community known as the ArabidopsisTILLING Project (ATP, http://tilling.fhcrc.org:9366/) and report here the results of our first year of public operation.
RESULTS AND DISCUSSION
Overview
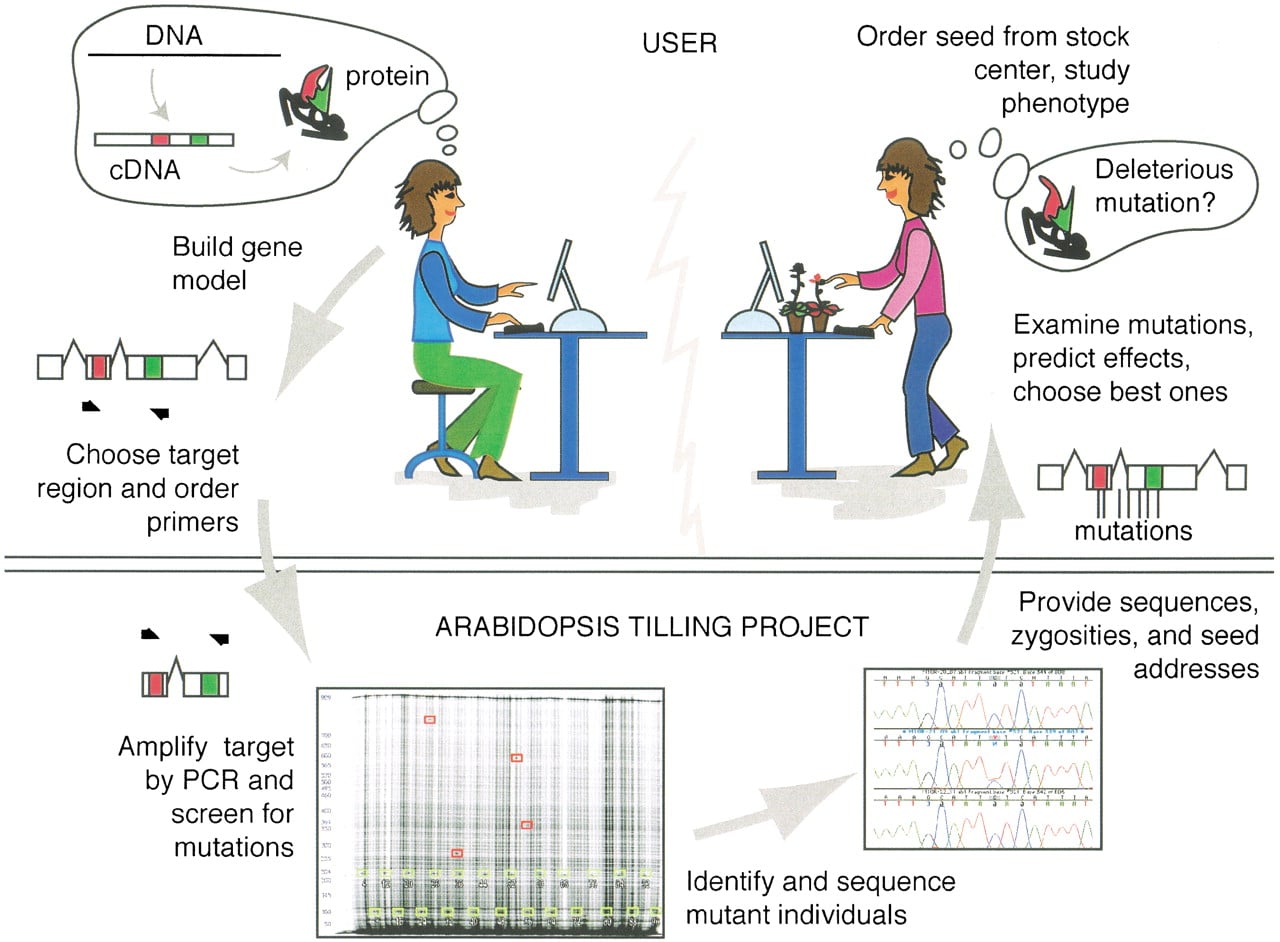
TILLING through ATP is a four-step process (Fig.1). In the first step, users choose primers that amplify an ∼1000-bp region in a gene of interest and place their order with ATP. Orders to initiate a screen are placed through an automated Web-based “front end” system. Users begin with the CODDLE input utility to obtain gene models and protein conservation models (http://www.proweb.org/input/), continue with choosing the best region for TILLING using CODDLE (http://www.proweb.org/coddle/), choose optimal primers, and end with placing an order. All components of this front-end system are integrated such that placing an order from start to finish is performed within the Web browser. Once an order has been placed, an automated confirmation is sent to the researcher along with a form to purchase primers directly from our primer supplier. Primers ordered and paid for by an ATP user are shipped directly to the high-throughput facility in Seattle.
Outline of steps involved in the Arabidopsis TILLING Project. A user of the service builds a model for the target gene including conserved coding regions (red and green boxes) and chooses primers for a 1-kb region where she would like to find mutations. As part of our automated ordering system, we have developed tools for gene model and protein homology model assembly (CODDLE Input,http://www.proweb.org/input/), and for scoring genes to determine the regions with the highest probability of discovering deleterious changes (CODDLE, http://www.proweb.org/coddle/). Primers are ordered and paid for by the user and shipped directly from the oligonucleotide supplier (MWG Biotech) to the TILLING facility. Upon receipt of primers, 3072M 2 plant DNAs are screened in eightfold pools for induced mutations. The individuals harboring identified mutations are tracked down, and these samples enter a sequencing queue. For each mutation, the nucleotide change, its position, and its zygosity are determined by standard dye-terminator sequencing. Mutations are stored in a public database, and the researcher who placed the order is sent an E-mail message summarizing the mutations discovered. To aid the researcher in deciding which mutations to characterize, mutations are automatically analyzed by the PARSESNP program (http://www.proweb.org/parsesnp/), which provides information on the location and severity of mutations and provides information on the creation or loss of restriction sites caused by the induced polymorphisms (see Fig. 3). Hyperlinks are provided from each mutation to the Arabidopsis Information Resource (TAIR) for obtaining seed stocks from the Arabidopsis Biological Resource Center.
Upon receipt of primers at ATP, mutations are identified in DNA from ethylmethanesulfonate (EMS)-mutagenized Arabidopsis using the TILLING method described below (see Fig.2). Briefly, mutations are first discovered in eightfold pools, followed by identification of the individual harboring the mutation. Mutations are then sequenced. Mutation information for an order is deposited in our database, and the user is automatically sent a response with the sequences of identified mutations (http://tilling.fhcrc.org/parsesnp/; Fig.3). For each mutation identified, a hyperlink to the corresponding seed stock at the ArabidopsisBiological Resource Center facilitates ordering.
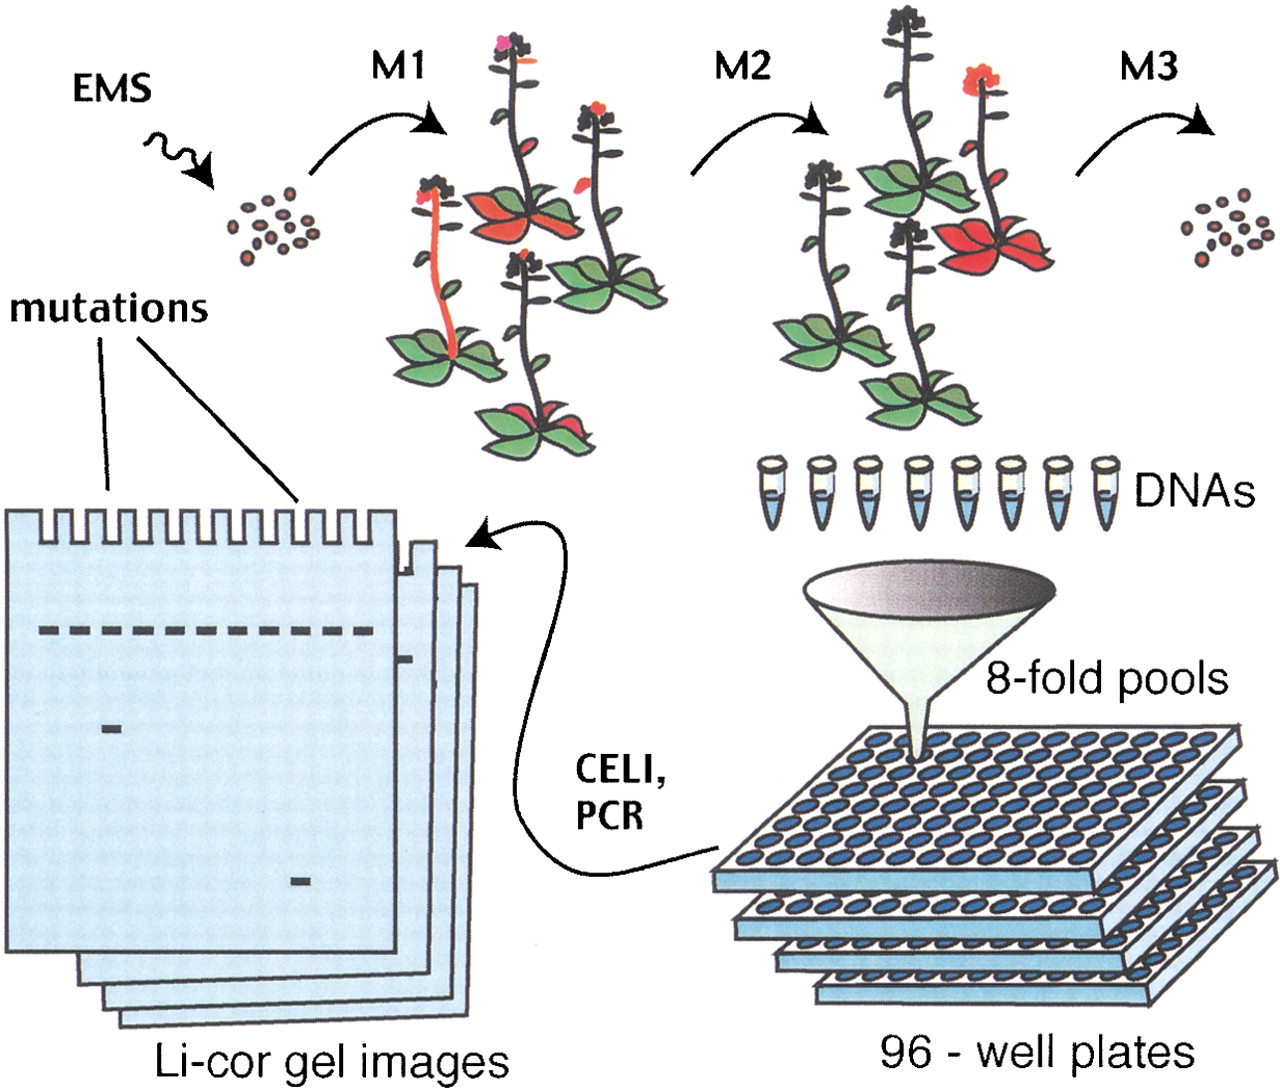
High-throughput TILLING of Arabidopsis. Seeds are mutagenized with EMS, which causes G/C-to-A/T point mutations. To avoid ambiguities caused by chimerism of mutant plants in the first (M 1) generation, they are self-fertilized, andM 2 progeny from single seed descent are used for screening. Tissue is collected from each M 2 plant, and DNA is extracted. Plants are self-fertilized, and theM 3 seed is collected and shipped to theArabidopsis Biological Resource Center for distribution. For screening, DNAs are pooled eightfold to maximize the efficiency of mutation detection. PCR is performed using 5′-end-labeled gene-specific primers to target the desired locus, and heteroduplexes are formed by heating and cooling the PCR products. CEL I nuclease is used to cleave at base mismatches, and products representing induced mutations are visualized with denaturing polyacrylamide gel electrophoresis. SeeColbert et al. (2001) and Till et al. (2003) for details.
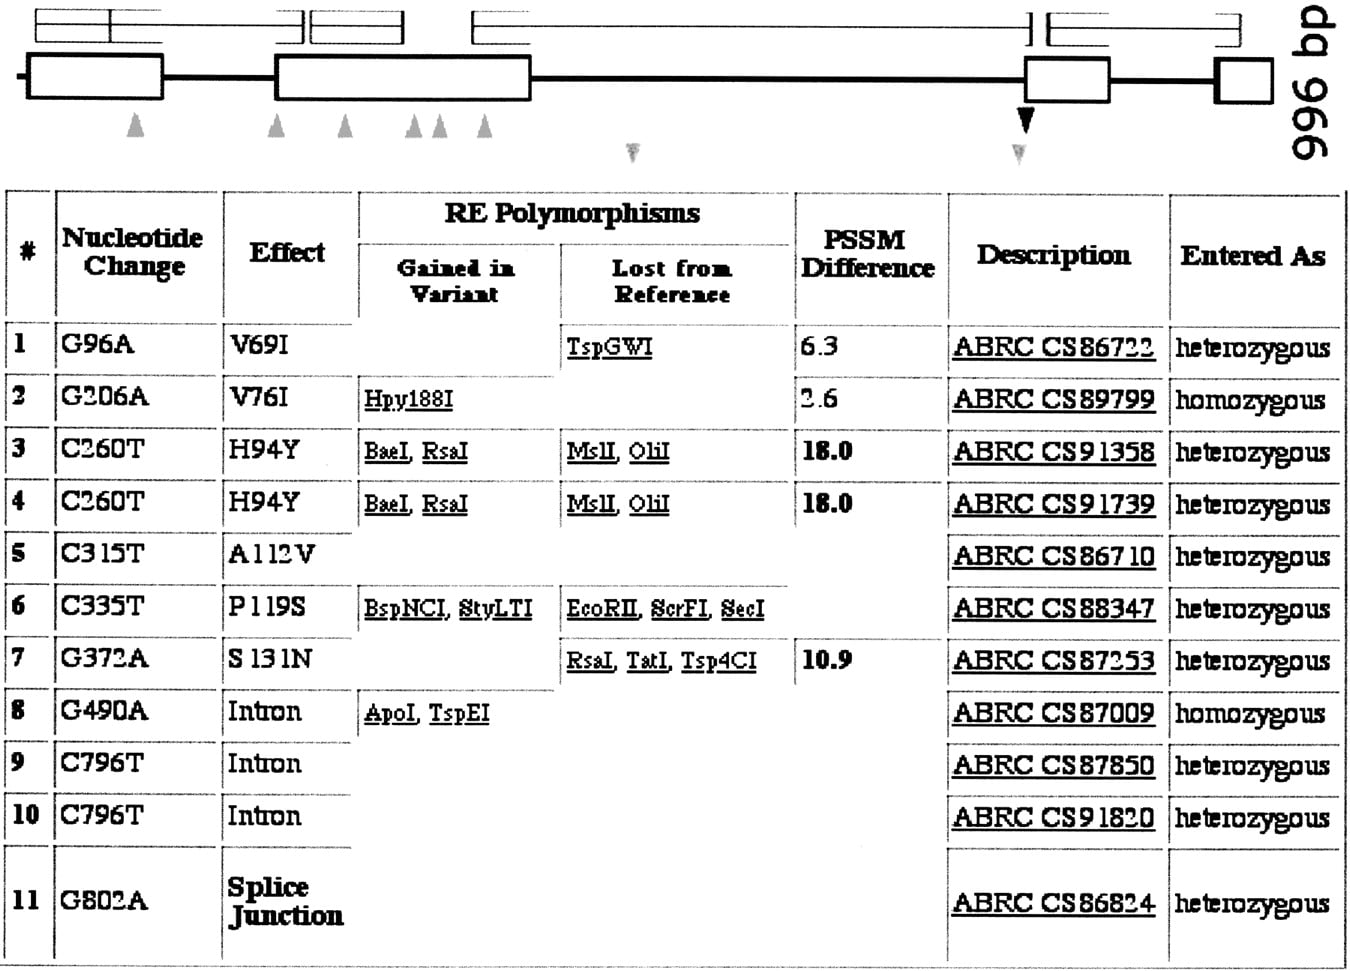
PARSESNP output for a typical ATP order. Users are provided a link to PARSESNP, which automatically analyzes mutations discovered. The graphical and tabular output from PARSESNP is shown. Near the top is a graphical view of the gene model; (boxes) exons, (lines) introns. Above the gene model is a Blocks protein conservation model. Below the gene model, triangles represent the location and type of induced change. These data are also summarized in tabular form below and on the nucleic acid sequence itself (data not shown). The effect of each nucleotide change is listed in the table. Missense changes are provided with a PSSM difference score by PARSESNP, in which mutations predicted to be damaging to the protein have positive scores, based on a scoring matrix generated from the protein conservation model (seehttp://www.proweb.org/glossary.html for a description of scoring missense changes). The restriction sites either gained or lost because of the induced polymorphism are listed. These sites serve as a tool for downstream genotyping applications.
Mutagenesis
One key element for establishing TILLING in any organism is the frequency of mutations in the population to be screened, and this depends on the trade-off between the effect of the mutagen on the germinal tissue and the toxicity and/or sterility that is a side effect of the treatment. We have found it beneficial to try a range of mutagen concentrations and calibration techniques for comparison with actual mutation frequency as determined by TILLING before preparing a single large population.
For Arabidopsis, we have used the degree of embryo lethality assayed in the siliques of M 1 plants as an indicator of mutation frequency. To determine this rate, mutagenized seeds were sown and M 1 plants were grown. For each mutagenesis treatment, 10 mature siliques were removed from each of 10 individual plants. Siliques were grouped into one of three classes based on the visual determination of the number of defective embryos, which have collapsed seed coats. Class A siliques have normal and defective embryos in a ratio of 3:1; Class B, 4:1–20:1; and Class C, greater than 20:1 (near normal). Only treatments producingM 1 plants with <40% C class siliques were used for screening. The C class scores for M 1 plants whose progeny became screening stocks are listed in Table1. There appears to be a trend of higher mutation rates giving lower embryo lethal C class scores.
Mutations Identified in Pool Screens
| Screening plate | No. of fragments | No. of mutations | Mutations per fragment | Total screened fragment length | Total bases screened (Mb) | Predicted mutations perM 2 plant | Mean embryo lethal C class score |
| 91 | 31 | 102 | 3.29 | 25,656 | 19.2 | 663 | NA |
| 103 | 34 | 113 | 3.32 | 28,395 | 21.3 | 663 | NA |
| 115 | 29 | 96 | 3.31 | 24,288 | 18.2 | 659 | NA |
| 127 | 11 | 35 | 3.18 | 9338 | 7.0 | 625 | NA |
| 139 | 95 | 346 | 3.64 | 78,906 | 59.2 | 731 | 14 |
| 151 | 86 | 293 | 3.40 | 70,782 | 53.1 | 690 | 38 |
| 163 | 88 | 329 | 3.73 | 72,741 | 54.6 | 754 | 38 |
| 175 | 86 | 341 | 3.96 | 71,450 | 53.6 | 795 | 22 |
| 187 | 24 | 119 | 4.95 | 20,481 | 15.4 | 968 | 10 |
| Total | 1774 | 301.6 | |||||
| Average | 3.64 | 728 |
[i] Each screening plate represents ∼750 uniqueM 2 individuals pooled eightfold in a 96-well plate. For each pool plate, the number of ∼1-kb gene fragments screened is listed. For each gene order, at least four pool plates were screened. The number of total mutations identified and the average number of mutations identified on a particular plate are listed (not every mutation identified in this table has been sequenced). The total screened fragment length represents the sum of gene fragment lengths screened minus ∼140 bp per target (compensating for the regions near primers where mutation detection is less efficient). The total bases screened is calculated by the total screened fragment length times the number of plants screened (750). This number represents the total number of bases interrogated per screening plate. The number of predicted mutations per M 2 plant is calculated as the total genome size (125 Mb)/(total bases screened/total mutations). This calculation assumes an even distribution of EMS mutagenesis in both genic and intergenic regions and does not compensate for differences in GC content throughout the genome. The mean embryo lethal C class score is a measure of the percent “normal” siliques in theM 1 generation of each population. Embryo lethal C class scores are not available (NA) for pool plates 91–127 as individuals represented on these plates derive from multiple different mutagenesis trials.
Screening for Mutations
ATP started accepting orders from the Arabidopsis community on 8/31/2001 following a 4-mo beta test period in which six selected outside laboratories and three members of the TILLING team were asked to place orders for genes of interest to them. Each screen begins with PCR amplification of the requested target using gene-specific primers chosen by the user. Screening is performed on DNAs that have been arrayed in 96-well microtiter plates and pooled eightfold to maximize screening efficiency (Fig. 2). Target fragments are amplified using 5′-end-labeled primers on DNA extracted from EMS-mutagenizedM 2 plants, and products are heated and cooled to form heteroduplexes between wild-type and mutant fragments. Heteroduplexes are cleaved at the mismatched base with the nuclease CEL I, and cleaved products are identified on denaturing polyacrylamide slab gels as previously described (Colbert et al. 2001; Till et al. 2003). We have applied this method to organisms with larger genomes by increasing the amount of input genomic DNA for PCR (data not shown).
For each order placed, ∼3000 pooled plants are screened. About 10,000 plants, or three genes per day, can be screened every 8 h in our facility by performing two runs each on six Li-cor gel analyzers with robotic loading of 96-tooth membrane combs. For each mutation detected in a pool, the individual harboring the mutation is identified from among the eight in the pool using essentially the same procedure. For identification of individuals, an equal amount of wild-type reference DNA is added prior to amplification to allow the formation of mismatched heteroduplexes for both homozygotes and heterozygotes. Mismatch cleavage and electrophoretic gel sizing localize mutations to within ±15 bp, which greatly facilitates their identification when templates are sequenced, especially for heterozygotes.
More than 90% of primers ordered by users through our Web-based primer design and ordering system have proved to be suitable for TILLING. For those cases in which a primer pair fails to amplify, the user is sent an automated response requesting submission of a nonoverlapping primer set, and the screen is repeated.
Mutation Frequency
Table 1 summarizes mutations identified in eightfold pool screens during the first year of public operation. More than 100 genes, scattered throughout all five chromosomes, were screened for induced mutations. Every screening plate represents ∼750 uniqueM 2 plants, and the target screening fragment size is 1000 bp. In the first year of operation, we screened >300 Mb ofArabidopsis sequence for mutations. With a target fragment size of 1 kb, we discovered an average of 3.6 mutations per ∼750 plants. Based on the number of mutations detected per nucleotides screened, we estimate an average of ∼700 different induced mutations per M 2 plant in our present screening populations. This number may be slightly inflated because of increased GC content in the coding region and occasional errors.
Mutation Analysis
Users of the Arabidopsis TILLING Project receive results via an automated response system that includes the PARSESNP program output for the analysis of mutations discovered (Fig. 3). In addition to a graphical summary of the location and types of changes identified, PARSESNP provides a list of restriction endonuclease sites either gained or lost as a result of the induced polymorphism; a useful tool for downstream genotyping of populations. Mutations can be broadly grouped into three classes. Induced mutations that either change a codon to a stop codon or disrupt the canonical splice site donor/acceptor GU:AG site are considered truncation changes that generally eliminate protein function. Changes that fall outside the coding region, within an intron, or changes that do not alter the amino acid coding are presumed to be functionally silent. Induced mutations that alter an amino acid are scored as missense. These missense changes can be further categorized as either tolerated or deleterious and can be scored with protein conservation information that is obtained via CODDLE.
A representative subset of 25 genes TILLed by ATP is summarized in Table 2. For each gene ordered, at least 3072 plants were screened for induced mutations. Among the 1063 sequenced mutations, truncations account for 4.5% and missense for ∼50% of mutations, as would be expected from random mutagenesis of these gene fragments. More than 98% of mutations are GC/AT transitions. This is as predicted for EMS mutagenesis, which alkylates G residues at the O6 position, thus forcing mispairing with T (Ashburner 1989). A more detailed analysis of induced mutations and their distribution will be reported elsewhere (E.A. Greene, C.A. Codomo, N.E. Taylor, J.G. Henikoff, B.J. Till, S.H. Reynolds, L.C. Enns, C. Burtner, J.E. Johnson, A.R. Odden, L. Comai, and S. Henikoff, in prep.).
Summary of First 1063 Mutations Discovered and Sequenced by ATP
| Fragment identifier ∼1 kb | Total | Truncations | Missense | Silent |
| atapp1 | 10 | 2 | 4 | 4 |
| atapm1 | 7 | 1 | 3 | 3 |
| athsp7 | 10 | 0 | 4 | 6 |
| lmwptp | 4 | 0 | 1 | 3 |
| versuc | 7 | 2 | 2 | 3 |
| cpl1 | 7 | 0 | 1 | 6 |
| atapl1 | 7 | 1 | 5 | 1 |
| fagpt2 | 9 | 0 | 6 | 3 |
| cip8 | 8 | 1 | 6 | 1 |
| parpc1 | 10 | 1 | 5 | 4 |
| nph3 | 9 | 0 | 6 | 3 |
| troubl | 12 | 0 | 7 | 5 |
| chubby | 8 | 1 | 4 | 3 |
| tubby | 11 | 1 | 5 | 5 |
| athsp | 8 | 1 | 3 | 4 |
| arp | 7 | 0 | 2 | 5 |
| lec1 | 5 | 0 | 4 | 1 |
| abf3-1 | 10 | 1 | 6 | 3 |
| 175 | 5 | 1 | 2 | 2 |
| abp1 | 11 | 1 | 7 | 3 |
| c7a107 | 7 | 0 | 5 | 2 |
| at_wrn | 9 | 1 | 3 | 5 |
| recq12 | 6 | 0 | 4 | 2 |
| pif2 | 16 | 0 | 7 | 9 |
| cyk8 | 14 | 0 | 10 | 4 |
| For the first 110 orders | ||||
| Average | 9.6 | |||
| Range | 4–33 | |||
| Total | 1063 | 48 | 528 | 487 |
| Percent | 4.5 | 49.7 | 45.8 | |
[i] For purposes of illustration, only the first 25 completed screens are individually represented. The average, range, totals, and percentages in the table are for all 110 loci screened during the first year of public operation. For each gene fragment, the total number of mutations sequenced is listed. Mutations are divided into three categories; truncations represent changes causing a premature stop codon or changes altering the canonical intron donor/acceptor splice sites. Missense changes are any nucleotide changes in coding regions that change the amino acid coded. Silent changes represent mutations falling outside the coding region, within an intron, or changes in codons not altering the encoded amino acid. Users have the option to request additional screens should more mutations be desired.
A backlog of orders developed within a few months after the public project was announced, and hence the decision was made to deliver only a minimum allelic series to reduce turnaround time. Therefore, only 8–12 mutations per gene discovered in the screening step were initially rearrayed for individual analysis and sequencing. By February 2002, because efficiency had improved and turnaround time was reduced to ∼2 mo, most of the remaining mutations discovered in the screening were rearrayed and sequenced. Even then, ATP was screening fewer than half of the available mutagenized population of 6912 plants to meet the demand. The additional 3840 plants were reserved for screening whenever an insufficient allelic series resulted from the first screening, for example, when a gene was small or had relatively large introns. Generally, the same primers could be used for the second round of screening. With the available screening population, an average of ∼36 mutations is expected per 1-kb region. We estimate the probability of finding at least one truncation mutation in this population to be 81%. Considering that about half of missense mutations are expected to be damaging to a typical protein (Markiewicz et al. 1994), we estimate that about 8 of the 16 expected missense mutations in the average 1-kb region will be useful for phenotypic analysis.
Availability
The Arabidopsis TILLING Project has a policy of immediate public release of data. Mutations in 1-kb regions already screened can be identified via BLAST search athttp://tilling.fhcrc.org:9366/search.html. ATP data are provided to The Arabidopsis Information Resource (TAIR,http://www.arabidopsis.org) for general release as part of their polymorphism and mutation resource for display on Arabidopsisgenetic and sequence maps.
A key feature of TILLING is that it is a general tool that can be applied to almost any organism. To facilitate the establishment of TILLING in other organisms, ATP hosts regular training sessions in which qualified individuals can get an in-depth view of the high-throughput TILLING operation at no charge. Visitors attending the workshops receive detailed protocols for high-throughput TILLING and CEL I extraction and programs for handling data. CODDLE, SIFT, and PARSESNP are freely available on the Web.
Concluding Remarks
We have established a reverse-genetic service for the model organismArabidopsis thaliana using high-throughput TILLING. As the TILLING methodology identifies polymorphisms regardless of phenotypic consequence, the mutations described here represent the most comprehensive data set on EMS mutagenesis in Arabidopsis to date. It is clear from this initial analysis that TILLING using EMS-mutagenized populations allows for the discovery of induced polymorphisms in all targets attempted regardless of gene size or chromosomal location. Thus TILLING provides a complementary tool along with available insertional methods for the ultimate goal of determining the function of every gene in Arabidopsis.
The goal of the Arabidopsis community to understand gene function will be shared by many other groups as their favorite organisms transition from the genomic to the postgenomic category as a result of the many sequencing projects presently in progress. High-throughput TILLING is a general reverse-genetic method allowing the direct examination of gene function. Using ATP as a model, we aim to facilitate the transfer of TILLING to other organisms as a public service to the broader community of biologists.
METHODS
EMS Mutagenesis, Tissue Collection, DNA Extraction, Quantification, and Pooling
A single Arabidopsis thaliana plant (“Big Mama”) provided seeds for mutagenesis. Big Mama was from the third backcross (BC 3 F 3) generation to the Columbia ecotype of the original er105 fast-neutron-induced mutant (Torii et al. 1996). The erecta mutation causes a compact growth habit that facilitates greenhouse cultivation of the plants and minimizes cross-contamination of seed. erecta105 is a strong allele similar in phenotype to that found in Landsberger. Seeds were mutagenized for 17 h in small batches of 50 mg of seeds using concentrations of EMS that ranged from 20 mM to 45 mM (McCallum et al. 2000a).
To produce each M 2 line, seeds were collected from a single silique of an M 1 plant and sown in a single pot, then thinned to a single individual. Each M 1plant was used for only a single M 2 line, so that each genome screened must ultimately have descended from a different mutagenized parental genome. A 200-mg sample of tissue was collected and stored at −80°C until seed set. Plants producing >2500M 3 seeds were selected for DNA isolation. DNA was extracted using the Q-Biogene FastDNA kit as previously described (Colbert et al. 2001), and quantified on a 1.5% agarose gel using λ DNA as a concentration reference (GIBCO). DNA from all samples was normalized to a final concentration of 3 ng/μL. Only plants providing >600–700 ng of DNA were included in screens. Following extraction, DNA samples were arrayed and pooled eightfold in a 96-well format as previously described (Colbert et al. 2001). Pooled DNAs were diluted to 0.015 ng/μL for screening. A population of 6912 arrayed DNAs from mutagenized individuals is presently available for screening. Each individual in our production population has producedM 3 seed and enough DNA for >10,000 screens.
Primer Design and Public Orders
Orders for screens from ATP described here were placed through our automated ordering system. The CODDLE input utility (http://www.proweb.org/input/) takes sequence information in a variety of formats and generates a gene model (intron/exon position) and a protein conservation model by searching the Blocks Database (Henikoff et al. 2000) for similarity to a Blocks family. Additional Blocks may be generated using SIFT (Ng and Henikoff 2001), which is incorporated into our automated ordering system.
Once a gene model and a protein conservation model are assembled, CODDLE (http://www.proweb.org/coddle/) presents candidate regions that are most likely to cause deleterious mutations given the mutational spectrum of EMS (McCallum et al. 2000b). After an ∼1000-bp region is chosen for screening, the order proceeds to primer design, in which candidate primers are chosen using the Primer3 program (Rozen and Skaletsky 2000) with the following parameters: product size, minimum = 725 bp, maximum = 1100 bp; primer size, minimum = 20;T m, minimum = 67°C, optimum = 70°C, maximum = 73°C. The user chooses a primer pair, provides contact information, and places the order. Prior to approving the order, the chosen 1-kb fragment is searched against a nonredundant version of theArabidopsis genomic sequence (ecotype Columbia; Tompa et al. 2002) using BLASTN (Altschul et al. 1990), and the order is accepted if it matches the first hit at >99% of aligned residues and does not overlap a preexisting order by >500 bp. The user is automatically sent an E-mail message confirming or rejecting the order along with a form for purchasing primers from our oligonucleotide supplier (MWG Biotech). Primers are ordered at the following scale: unlabeled primers, 0.01 μM; left primer 5′-labeled with IRD 700 (0.2 μM); right primer labeled with IRD 800 (0.2 μM). Once a user fills in the appropriate billing information, the order is placed and primers are delivered directly to the TILLING facility.
Screening for Induced Mutations
PCR was performed in a 10-μL volume with 0.075 ng of genomic DNA either pooled eightfold (for pool screens) or mixed 1:1 withArabidopsis Columbia wild-type DNA (for identification in individuals). PCR and CEL I reactions were carried out as described (Colbert et al. 2001; Till et al. 2003).
The UNIX programs squint and pick were used for entry of pool screen data (Till et al. 2003). These programs have been modified to enter data for gels containing individual samples (msquint) and for the generation of a template for a 96-well sequencing plate containing multiple gene targets (mpick).
DNA Sequencing
For DNA sequencing, amplifications were performed with 0.005 ng of genomic DNA in a 20-μL final volume following the manufacturer's suggestions for Ex-Taq polymerase (Takara). The following cycling program was used: 95°C for 2 min; Loop 1 for 8 cycles (94°C for 20 sec, 73°C for 30 sec, reduce temperature 1°C per cycle, ramp to 72°C at 0.5°C/sec, 72°C for 1 min); Loop 2 for 45 cycles (94°C for 20 sec, 65°C for 30 sec, ramp to 72°C at 0.5°C/sec, 72°C for 1 min); 72°C for 5 min; hold at 8°C. Only unlabeled primers were used. Prior to sequencing, free primers and dNTPs were removed/inactivated using the SeqDirect 96 PCR Cleaning Kit (Q-BIOgene). Cycle sequencing reactions were performed in a 10-μL volume with 5–40 ng of purified DNA template, 3 pmole primer, 0.8% dimethylsulfoxide, and 4 μL of ABI Big Dye version 3 terminator mix (Applied Biosystems). The following cycle sequencing program was used: 95°C for 5 min; Loop 1 for 25 cycles (ramp to 95°C at 1°C/sec, 95°C for 10 sec, ramp to 50°C at 1°C/sec, 50°C for 5 sec, ramp to 60°C at 1°C/sec, 60°C for 4 min); ramp to 8°C at 1°C/sec; hold at 8°C. Samples were run on ABI 3100 capillary sequencing machines operated by the Fred Hutchinson Cancer Research Center's Biotech facility. Sequence trace analysis was performed using Sequencher 4.1 software (Gene Codes). Both heterozygous and homozygous mutations were confirmed using the mapping information gathered in the CEL I screens.
WEB SITE REFERENCES
http://tilling.fhcrc.org:9366/; Arabidopsis TILLING Project (ATP).
http://tilling.fhcrc.org:9366/search.html; ATP BLAST search to identify mutations in 1-kb Arabidopsis regions already screened.
http://tilling.fhcrc.org/parsesnp/; Analysis of identified mutations.
http://www.arabidopsis.org; The Arabidopsis Information Resource (TAIR).
http://www.Arabidopsis.org/links/insertion.html; sequencedArabidopsis T-DNA insertions available for in silico analysis.
http://www.nsf.gov/pubs/2001/nsf0113/nsf0113.htm; National Science Foundation program to determine the function of all ∼25,000Arabidopsis genes.
http://www.proweb.org/coddle/ and http://www.proweb.org/input/; CODDLE input utility to obtain gene models and protein conservation models.
http://www.proweb.org/glossary.html; Descriptions of scoring missense changes.
We thank past members of the high-throughput TILLING team, including Trenton Colbert, Rachel Tompa, Michael Steine, Terri Bryson, Nina Accornero, and Rebecca Lechalk. We also thank Elisabeth Spitzer, Emily Kerr, Tracy Cunningham, Bill Orr, Elisabeth Schnackenberg, Cresanna Puffer, Angela Jacobs, Laura Vasquez, Steve Hentel, Ernest Cho, Sabrina Anderson, Paul Beeman, Michelle Acupanda, Brianna Borders, Amy Holmes, and Amber Kost for planting, harvesting, and preparing the DNA samples. We are grateful to the laboratories of Janet Braam, George Haughn, Zhongchi Liu, Barbara Moffatt, Natasha Raikhel, and Patricia Springer for participating in our beta test. This work was supported by a grant from the National Science Foundation Plant Genome Research Program.
The publication costs of this article were defrayed in part by payment of page charges. This article must therefore be hereby marked “advertisement” in accordance with 18 USC section 1734 solely to indicate this fact.
Notes
[3] Corresponding author.
Notes
[4] E-MAIL [email protected]; FAX (206) 667-5889.
[5] Article and publication are at http://www.genome.org/cgi/doi/10.1101/gr.977903.
REFERENCES
- ↵S.F. AltschulW. GishW. MillerE.W. MyersD.J. Lipman(1990) Basic local alignment search tool. J. Mol. Biol. 215:403–410.
- ↵M. Ashburner(1989) Drosophila. (Cold Spring Harbor Laboratory Press, Cold Spring Harbor, NY).
- ↵T. ColbertB.J. TillR. TompaS. ReynoldsM.N. SteineA.T. YeungC.M. McCallumL. ComaiS. Henikoff(2001) High-throughput screening for induced point mutations. Plant Physiol. 126:480–484.
- ↵A.G. FraserR.S. KamathP. ZipperlenM. Martinez-CamposM. SohrmannJ. Ahringer(2000) Functional genomic analysis of C. elegans chromosome I by systematic RNA interference. Nature 408:325–330.
- ↵G. GiaeverA.M. ChuL. NiC. ConnellyL. RilesS. VeronneauS. DowA. Lucau-DanilaK. AndersonB. Andre(2002) Functional profiling of the Saccharomyces cerevisiae genome. Nature 418:387–391.
- ↵J.G. HenikoffE.A. GreeneS. PietrokovskiS. Henikoff(2000) Increased coverage of protein families with the blocks database servers. Nucleic Acids Res. 28:228–230.
- ↵L.X. LiuJ.M. SpoerkeE.L. MulliganJ. ChenB. ReardonB. WestlundL. SunK. AbelB. ArmstrongG. Hardiman(1999) High-throughput isolation of Caenorhabditis elegans deletion mutants. Genome Res. 9:859–867.
- ↵P. MarkiewiczL.G. KleinaC. CruzS. EhretJ.H. Miller(1994) Genetic studies of the lac repressor. XIV. Analysis of 4000 altered Escherichia coli lac repressors reveals essential and non-essential residues, as well as “spacers” which do not require a specific sequence. J. Mol. Biol. 240:421–433.
- ↵C.M. McCallumL. ComaiE.A. GreeneS. Henikoff(2000a) Targeted screening for induced mutations. Nat. Biotechnol. 18:455–457.
- ↵(2000b) Targeting induced local lesions in genomes (TILLING) for plant functional genomics. Plant Physiol. 123:439–442, ibid.
- ↵P.C. NgS. Henikoff(2001) Predicting deleterious amino acid substitutions. Genome Res. 11:863–874.
- ↵F. PianoA.J. SchetterM. MangoneL. SteinK.J. Kemphues(2000) RNAi analysis of genes expressed in the ovary of Caenorhabditis elegans. Curr. Biol. 10:1619–1622.
- ↵P. Ross-MacdonaldP.S. CoelhoT. RoemerS. AgarwalA. KumarR. JansenK.H. CheungA. SheehanD. SymoniatisL. Umansky(1999) Large-scale analysis of the yeast genome by transposon tagging and gene disruption. Nature 402:413–418.
- ↵S. RozenH. Skaletsky(2000) Primer3 on the WWW for general users and for biologist programmers. Methods Mol. Biol. 132:365–386.
- ↵B. TillT. ColbertR. TompaL. EnnsC. CodomoJ. JohnsonS. ReynoldsJ. HenikoffE. GreeneM. Steine(2003) High-throughput TILLING for functional genomics. in Plant functional genomics: Methods and protocols, ed E. Grotewald(Humana Press, Totowa, NJ) (in press)..
- ↵R. TompaC.M. McCallumJ. DelrowJ.G. HenikoffB. van SteenselS. Henikoff(2002) Genome-wide profiling of DNA methylation reveals transposon targets of CHROMOMETHYLASE3. Curr. Biol. 12:65–68.
- ↵K.U. ToriiN. MitsukawaT. OosumiY. MatsuuraR. YokoyamaR.F. WhittierY. Komeda(1996) The Arabidopsis ERECTA gene encodes a putative receptor protein kinase with extracellular leucine-rich repeats. Plant Cell 8:735–746.
- ↵E.A. WinzelerD.D. ShoemakerA. AstromoffH. LiangK. AndersonB. AndreR. BanghamR. BenitoJ.D. BoekeH. Bussey(1999) Functional characterization of the S. cerevisiae genome by gene deletion and parallel analysis. Science 285:901–906.
- ↵B.P. ZambrowiczG.A. FriedrichE.C. BuxtonS.L. LillebergC. PersonA.T. Sands(1998) Disruption and sequence identification of 2,000 genes in mouse embryonic stem cells. Nature 392:608–611.