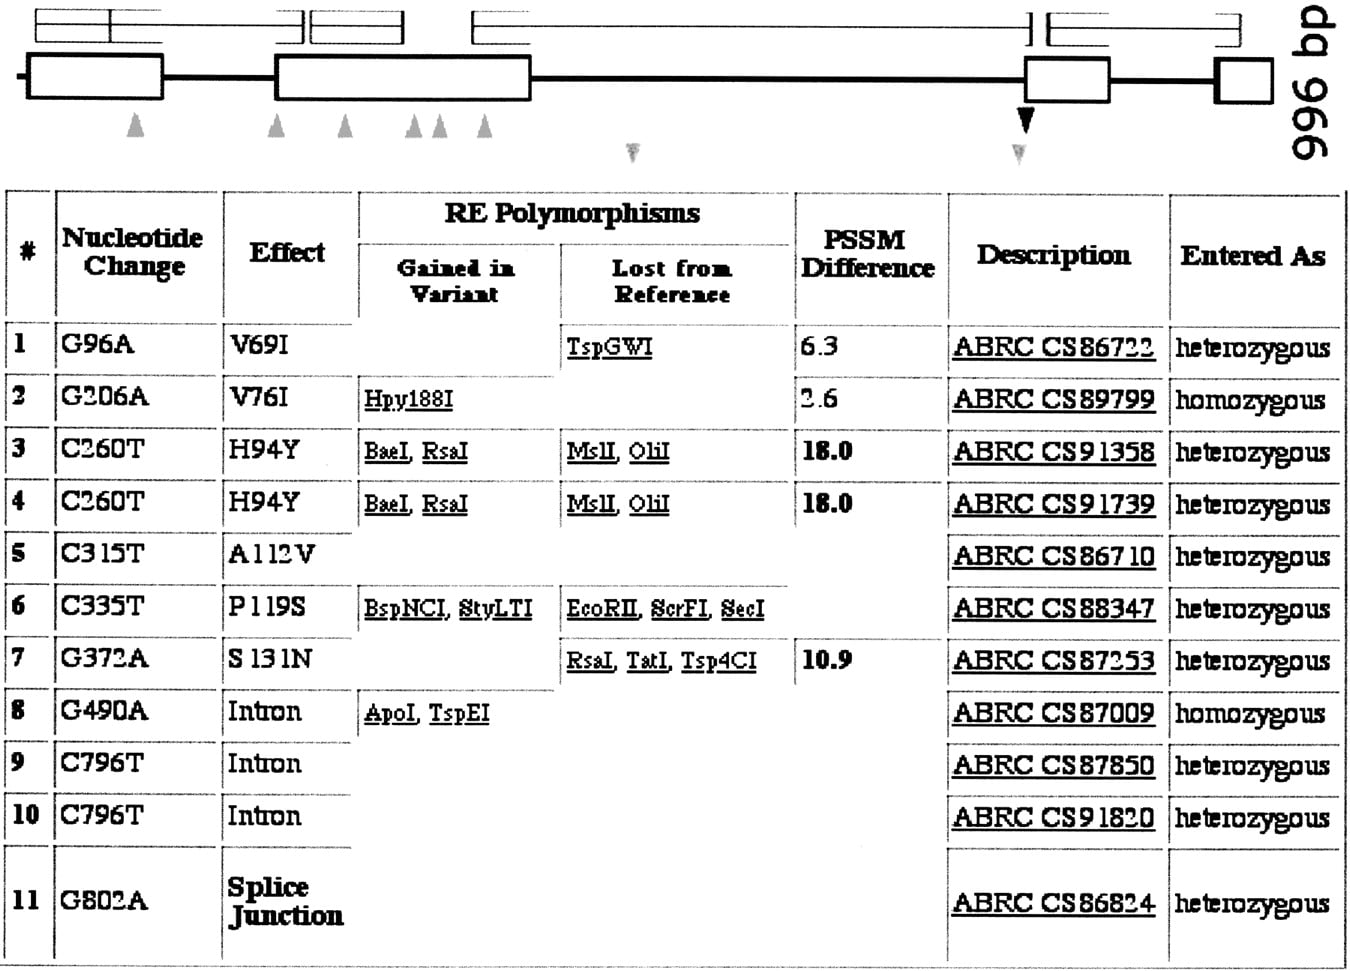
PARSESNP output for a typical ATP order. Users are provided a link to PARSESNP, which automatically analyzes mutations discovered. The graphical and tabular output from PARSESNP is shown. Near the top is a graphical view of the gene model; (boxes) exons, (lines) introns. Above the gene model is a Blocks protein conservation model. Below the gene model, triangles represent the location and type of induced change. These data are also summarized in tabular form below and on the nucleic acid sequence itself (data not shown). The effect of each nucleotide change is listed in the table. Missense changes are provided with a PSSM difference score by PARSESNP, in which mutations predicted to be damaging to the protein have positive scores, based on a scoring matrix generated from the protein conservation model (seehttp://www.proweb.org/glossary.html for a description of scoring missense changes). The restriction sites either gained or lost because of the induced polymorphism are listed. These sites serve as a tool for downstream genotyping applications.