
Abstract
Gene order in prokaryotes is conserved to a much lesser extent than protein sequences. Only several operons, primarily those that code for physically interacting proteins, are conserved in all or most of the bacterial and archaeal genomes. Nevertheless, even the limited conservation of operon organization that is observed can provide valuable evolutionary and functional clues through multiple genome comparisons. A program for constructing gapped local alignments of conserved gene strings in two genomes was developed. The statistical significance of the local alignments was assessed using Monte Carlo simulations. Sets of local alignments were generated for all pairs of completely sequenced bacterial and archaeal genomes, and for each genome a template-anchored multiple alignment was constructed. In most pairwise genome comparisons, <10% of the genes in each genome belonged to conserved gene strings. When closely related pairs of species (i.e., two mycoplasmas) are excluded, the total coverage of genomes by conserved gene strings ranged from <5% for the cyanobacterium Synechocystis sp to 24% for the minimal genome of Mycoplasma genitalium, and 23% in Thermotoga maritima. The coverage of the archaeal genomes was only slightly lower than that of bacterial genomes. The majority of the conserved gene strings are known operons, with the ribosomal superoperon being the top-scoring string in most genome comparisons. However, in some of the bacterial–archaeal pairs, the superoperon is rearranged to the extent that other operons, primarily those subject to horizontal transfer, show the greatest level of conservation, such as the archaeal-type H+-ATPase operon or ABC-type transport cassettes. The level of gene order conservation among prokaryotic genomes was compared to the cooccurrence of genomes in clusters of orthologous genes (COGs) and to the conservation of protein sequences themselves. Only limited correlation was observed between these evolutionary variables. Gene order conservation shows a much lower variance than the cooccurrence of genomes in COGs, which indicates that intragenome homogenization via recombination occurs in evolution much faster than intergenome homogenization via horizontal gene transfer and lineage-specific gene loss. The potential of using template-anchored multiple-genome alignments for predicting functions of uncharacterized genes was quantitatively assessed. Functions were predicted or significantly clarified for ∼90 COGs (∼4% of the total of 2414 analyzed COGs). The most significant predictions were obtained for the poorly characterized archaeal genomes; these include a previously uncharacterized restriction-modification system, a nuclease-helicase combination implicated in DNA repair, and the probable archaeal counterpart of the eukaryotic exosome. Multiple genome alignments are a resource for studies on operon rearrangement and disruption, which is central to our understanding of the evolution of prokaryotic genomes. Because of the rapid evolution of the gene order, the potential of genome alignment for prediction of gene functions is limited, but nevertheless, such predictions information significantly complements the results obtained through protein sequence and structure analysis.
One of the unexpected findings of the first comparisons of complete bacterial genomes has been the near lack of gene order conservation beyond the level of operons (groups of adjacent, coexpressed and coregulated genes that encode functionally interacting proteins) even between relatively close species such asEscherichia coli and Haemophilus influenzae (Koonin et al. 1996; Tatusov et al. 1996). At an even closer evolutionary distance, such as that between Mycoplasma genitalium andMycoplasma pneumoniae, large-scale conservation is seen, but even in this case there are several breakpoints of genome colinearity (Himmelreich et al. 1997). Subsequent comparisons of the sequenced bacterial and archaeal genomes have shown that even most of the operons are extensively rearranged during evolution. Only a few operons, typically coding for physically interacting proteins, are conserved in all or most of the genomes (Mushegian and Koonin 1996; Siefert et al. 1997; Watanabe et al. 1997; Dandekar et al. 1998; Itoh et al. 1999;Huynen and Snel 2000; 2000a). Examples include the ribosomal protein operons, some of which form superoperons (large arrays of genes that include several operons with a complex pattern of regulation) consisting of >20 genes, and are in general the most conserved portions of prokaryotic genomes, proton ATPases, and ABC-type membrane transport cassettes. Many individual pairs of genomes, however, share a significant number of additional operons. In part, the similarity of the gene order between prokaryotic genomes is maintained via horizontal transfer of operons, in some cases between taxonomically distant species (Itoh et al. 1999). Operon transfer is likely to be favored by selection over transfer of individual genes because, in the former case, gene coexpression and coregulation are preserved (Lawrence 1999).
Operon transfer, shuffling, disruption, and perhaps formation are major factors in the evolution of bacteria and archaea (Itoh et al. 1999;Lawrence 1997, 1999), and understanding the evolutionary dynamics of prokaryotic genomes is impossible without a detailed comparison of genome organization. On a more practical plane, conservation of gene order has been considered as one of the important predictors of gene function in prokaryotes under the general paradigm of context analysis, which is becoming increasingly popular with the growth of the collection of genome sequences (Galperin and Koonin 2000; Huynen and Snel 2000; Huynen et al. 2000a). The logic of this approach is straightforward: On one hand, by definition, genes in an operon are coexpressed and encode functionally linked proteins (Jacob et al. 1960); conversely, as indicated above, recombinational gene shuffling in prokaryotes is extensive, which results in very limited conservation of gene order between evolutionarily distant genomes. Hence, if a conserved gene string occurs in two or, better yet, three or more such genomes, there is, for all practical purposes, little doubt that the respective genes comprise an operon and are functionally linked. If one or more of these genes has no known function or has a function defined only in general terms, a prediction becomes possible. Overbeek et al. (1998, 1999) developed a simple method that enumerates conserved gene strings in pairs of genomes and provides material for such predictions. A tool for detecting conserved gene strings in pairs of genomes is also provided by the KEGG database (Kanehisa and Goto 2000).
We were interested in systematically and quantitatively exploring the conservation of gene order among the 25 currently available complete bacterial and archaeal genomes and its dependence on the evolutionary distance between these genomes, and in assessing the potential of such comparisons for identification of previously undetected operons and prediction of gene functions. These systematic genome comparisons revealed major differences between genomes in terms of their coverage with conserved operons and reinforced the notion of rapid evolution of prokaryotic gene order, which puts limits on its utility for functional prediction. Nevertheless, several previously undetected, conserved operons were identified, and functions of ∼90 widespread bacterial and archaeal genes were predicted.
RESULTS AND DISCUSSION
Local Alignments of Gene Strings, Template-Anchored Multiple Genome Alignments, and Evolutionary Conservation of (Predicted) Operons
The principles of gene-by-gene genome alignment employed here were exactly the same as those of the more traditional alignment of nucleotide and protein sequences. In each case, either global or local alignments can be constructed ( Needleman and Wunsch 1970; Smith and Waterman 1981; Altschul and Gish 1996). However, the global alignment approach, which is not practicable even for distantly related protein sequences, is not applicable to genome alignment at all (except, possibly, pairs of very closely related isolates of the same microbial strain) due to a large number of transpositions and inversions that occur during evolution. In practice, therefore, the task is to detect the maximal-length strings of genes with a conserved order, including possible gaps and mismatches. The construction of a gene-by-gene alignment differs from the construction of a sequence alignment in that the former requires the extra step of generating an all-against-all matrix of gene-to-gene sequence comparisons. Typically, this is done by comparing the protein sequences encoded in all genes from the analyzed genomes using, for example, the Smith-Waterman or BLASTalgorithms. Here we compared protein sequences encoded in all completely sequenced prokaryotic genomes using the BLASTPprogram and converted the resulting scores into density values to make the scores independent from protein lengths (see Methods). Scores for gene pairs in a genome-to-genome comparison were then extracted from the sequence comparison matrix by one of two approaches: (1) using either 0 and 1 values only, with a value of1 assigned to all bidirectional genome-to-genome best hits and a value of 0 assigned to all other gene pairs; or (2) using score density values for each protein pair. This is generally analogous to the use of a simple identity matrix versus a residue substitution matrix such as PAM or BLOSUM in protein sequence alignment (Henikoff and Henikoff 2000), but, unlike the sequence case, the genome alignments produced using these two approaches differ not only in extent, but in substance. The alignment constructed using the bidirectional best hits is likely to consist mostly, if not exclusively, of pairs of orthologous genes (Fitch 1970; Tatusov et al. 1997) and, by extension, of orthologous gene strings (potential operons). In contrast, a genome alignment constructed with the use of similarity scores for gene pairs will include paralogous operons, the existence of which is well documented, the ABC-type transport cassettes being perhaps the best example (Tomii and Kanehisa 1998). The two types of alignment appear to be optimal for different purposes and were used accordingly here. An alignment that includes only orthologs is most appropriate when evolutionary conservation of gene order is being explored; in contrast, when the complete coverage of a genome with conserved gene strings is examined and functional predictions are attempted, it is advantageous to include paralogs.
As with sequence alignment, gene-by-gene genome alignment requires that gap and mismatch penalties are introduced, for which no solid theoretical basis is available, and therefore a degree of arbitrariness is inevitable. Typically, protein sequence alignment methods use a relatively high gap-opening penalty and a significantly lower gap-extension penalty; the reasoning behind this is that inserts/deletions affect protein structure and therefore are tolerated only to a limited extent, but once such a mutation is fixed, further changes of the insert length are of lesser consequence, with even very long inserts present in many proteins (Vingron and Waterman 1994;Altschul 1998). These considerations do not apply to genome evolution where the probability of functional association between (formerly) adjacent genes being maintained is expected to decrease rapidly with the increase in the number of inserted genes. Therefore, in the present analysis, we used a gap-opening penalty of zero and a linear function for the gap/mismatch extension penalty (a mismatch, i.e., a pair of genes whose products did not show significant sequence similarity to one another, was treated as equivalent to a gap [Altschul 1998]).
The program Lamarck (see Methods) was used to produce local gene-by-gene alignments for all pairs of bacterial and archaeal genomes using each of the above approaches. The gap/mismatch penalties were selected empirically so that the known large gene clusters that are known to be subject to rearrangement, primarily the ribosomal superoperon, were detected in their entirety. The score cut-off for the detection of conserved gene strings was naturally set at two for the0–1 scoring scheme so that each pair of apparent orthologs in a row was reported, and the cut-off for the information-density-based scheme was similarly adjusted to include pairs of homologs with significant sequence similarity. The statistical significance (expressed as the random expectation [E] value) of the detected strings of homologous genes was estimated using Monte Carlo simulations.
The inherent limitation of this method of gene order analysis is that completely reshuffled, but nevertheless conserved operons will not be identified. For a conserved gene string to be detected, at least one pair of homologous with the same gene order (but possibly with an inserted gene[s]) is required. The method of Overbeek and co-workers for detection of clusters of potential functionally linked genes is, in this respect, more general because conserved clusters are identified on the basis of genes belonging to the same run, regardless of the exact gene order (Overbeek et al. 1999). The latter method, however, involves other, more or less arbitrary assumptions, namely that only genes transcribed in the same direction and separated by a distance not exceeding a certain maximal number of base pairs (300 in this particular study) are considered (see below).
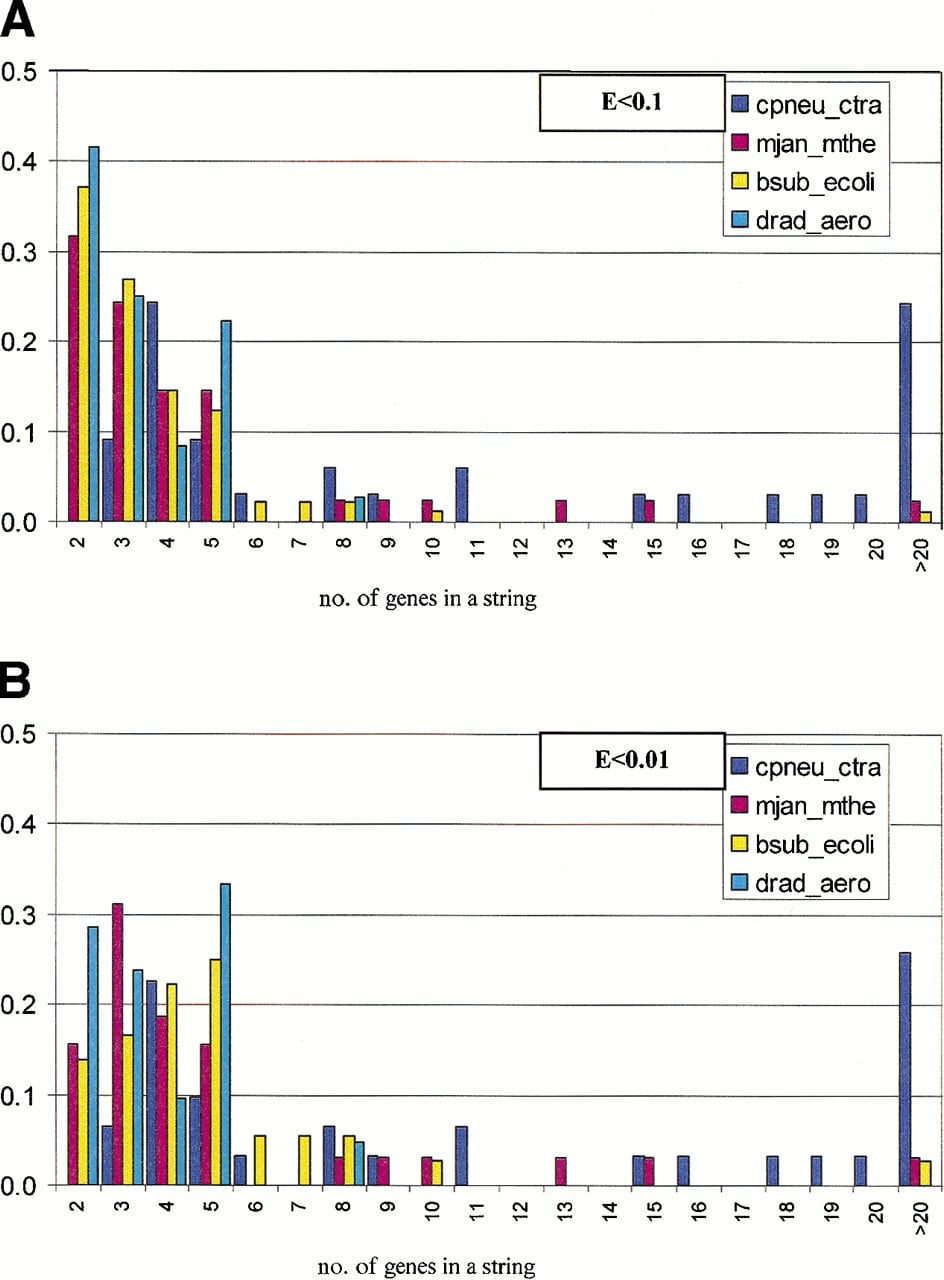
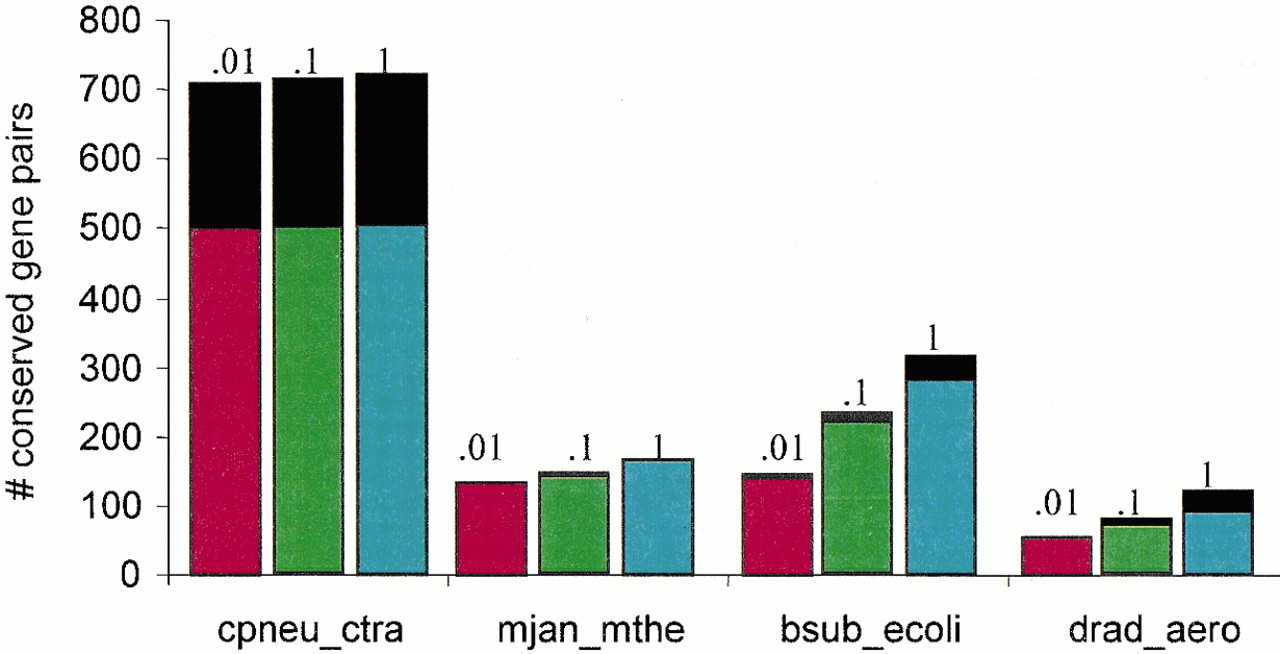
The data in Table 1 show the dependence of the number of detected conserved gene strings and the number of genes in them on the E-value cut-off for the two scoring schemes. Generally, the presence of a pair of adjacent homologous genes in two genomes is not statistically significant because the number of detected pairs is much greater at E < 0.1 than atE < 0.01 (Fig. 1). In other words, many such pairs occur simply by chance, whereas others are functionally and evolutionarily relevant; the two situations can be distinguished by analyzing multiple genomes and/or by examining gene pairs case-by-case. Indeed, if the gene orders in different genomes are considered independent, which for evolutionarily distant genomes might be a reasonable approximation, the probabilities of the occurrence of gene pairs should be multiplied, and accordingly, the presence of a spurious pair of adjacent homologs in four or more genomes is extremely unlikely. The characteristic length of a nonrandom, statistically significant (E < 0.01) conserved gene string in most genome pairs is commensurate with the characteristic operon length, namely 3–4 genes (Fig. 1B). The genome alignment method employed here does not require that genes in a string are transcribed in the same direction or down-weigh gene pair that are transcribed in different directions. Nevertheless, nearly all conserved gene pairs detected in genomes other than closely related ones, particularly atE < .01, are unidirectional ones, which is compatible with the notion that such gene pairs belong to conserved operons (Fig.2).
Conserved Gene Strings in Pairwise Genome Comparisons
| Genome 1 | Genome 2 | # conserved strings / # aligned genes / % in genome 1 / % in genome 2 | |||
| Alignment method | |||||
| All hits (information density) | Bidirectional best hits (orthologs) | ||||
| E < 0.1 | E < 0.01 | E < 0.1 | E < 0.01 | ||
| Ctra | Cpneu | 33/745/83%/71% | 31/738/83%/70% | 35/757/85%/72% | 34/753/84%/72% |
| Tpal | Bbur | 27/161/16%/19% | 27/161/16%/19% | 31/176/17%/21% | 31/176/17%/21% |
| Ecoli | Hinf | 138/566/13%/33% | 80/411/10%/24% | 105/482/11%/28% | 105/482/11%/28% |
| Ecoli | Bsub | 89/322/8%/8% | 36/182/4%/4% | 34/168/4%/4% | 34/168/4%/4% |
| Bsub | Synecho | 16/74/2%/2% | 9/58/1%/2% | 29/94/2%/3% | 9/50/1%/2% |
| Synecho | Aquae | 20/67/2%/4% | 14/53/2%/3% | 9/40/1%/3% | 9/40/1%/3% |
| Aquae | Tmar | 13/56/4%/3% | 7/41/3%/2% | 12/58/4%/3% | 12/58/4%/3% |
| Tmar | Mtub | 30/129/7%/3% | 14/85/5%/2% | 46/150/8%/4% | 17/92/5%/2% |
| Tmar | Drad | 37/148/8%/5% | 27/125/7%/4% | 10/58/3%/2% | 10/58/3%/2% |
| Ecoli | Mjan | 10/30/1%/2% | 5/18/0%/1% | 12/33/1%/2% | 5/19/0%/1% |
| Ecoli | Aero | 54/191/4%/10% | 36/145/3%/8% | 25/56/1%/3% | 5/16/0%/1% |
| Tmar | Mjan | 7/27/1%/2% | 4/19/1%/1% | 26/64/3%/4% | 7/30/2%/2% |
| Tmar | Aero | 58/220/12%/12% | 46/196/11%/11% | 31/85/5%/5% | 12/47/3%/3% |
| Mjan | Aero | 18/68/4%/4% | 17/66/4%/4% | 11/55/3%/3% | 11/55/3%/3% |
| Mjan | Mthe | 41/184/11%/10% | 32/163/10%/9% | 28/148/9%/8% | 28/148/9%/8% |
| Pyro | Aero | 29/122/6%/7% | 17/90/4%/5% | 11/60/3%/3% | 11/60/3%/3% |
Length distribution of conserved gene strings in pairs of prokaryotic genomes. The distributions are for information-density-based alignments; the respective E-value cut-offs are indicated in panels A and B. The vertical axis shows the fraction of aligned gene strings for a given genome pair.
The prevalence of gene pairs transcribed in the same direction among conserved gene strings. For each pair of genomes, the number of unidirectional gene pairs (colored) and gene pairs transcribed in the opposite direction (black) is shown for three E-value cut-offs (indicated on top of each bar).
Most of the pairwise genome comparisons reveal only one long conserved string, which, not unexpectedly, consists of varying substrings of the ribosomal superoperon (Fig. 1, Table 2). In several bacterial–archaeal pairings, however, the super-operon is disrupted to the extent that other operons, such as the archaeal-type ATPase operon, appear as the highest-scoring local alignment, which usually, but not always (because of gaps and mismatches), is also the longest conserved gene string (Table 2). Most of the alignments between distant genomes did not include any strings spanning two or more functionally unrelated operons, which would be interpreted as preservation of the ancestral gene order.
The Most Conserved Gene Strings in Pairwise Genome Comparisons
| Best local alignment, length, number of gaps/mismatches[i] | ||||||
| E. coli | B. subtilis | D. radiodurans | Synechocystis sp. | A. aeolicus | A. pernix | |
| B. subtilis | r-superoperon, 30, 2 | |||||
| D. radiodurans | r-superoperon, 14, 0 | r-superoperon, 19, 1 | ||||
| Synechocystis sp. | r-superoperon, 27, 4 | r-superoperon, 35, 4 | r-superoperon, 13, 0 | |||
| A. aeolicus | r-superoperon, 9, 0 | r-superoperon, 10, 0 | r-superoperon, 10, 0 | r-superoperon, 10, 0 | ||
| A. pernix | Phosphate transport operon, 4, 0 | r-superoperon, 12, 2 | Phosphate transport operon, 5, 0 | r-superoperon, 3, 0 | r-superoperon, 5, 0 | |
| M. jannaschii | Phosphate transport operon, 4, 0 | r-superoperon, 5, 0 | Archaeal-type H+ATPase operon, 8, 0 | r-superoperon, 10, 2 | r-superoperon, 5, 0 | r-superoperon, 16, 1 |
[i] The data are for the information-density-based alignments.
Typically, pairwise genome alignments included a small fraction of genes in each of the compared genomes, on most occasions <10% (Table 1). Only for pairs of closely related genomes, such as two species of Chlamydia or two species of Mycoplasma, the fraction of the genes included in alignments was significantly greater (Table 1). In contrast, some of the pairwise genome alignments, for example, those between some of the bacteria and the archaeonMethanococcus jannaschii, showed an extremely low overlap, with <1% of the genes involved and <10 conserved gene strings (Table 1). It is worth noting that, in some of the comparisons between distantly related genomes, the bidirectional best hit method of alignment construction revealed additional conserved gene strings (e.g., the Bacillus subtilis–Synechocystis andTheomotoga maritima– M. jannaschii comparisons in Table 1). This occurred because under the information-density-based method, strings of orthologous genes with low sequence similarity may not be detected or may fail to pass the E-value cut-off.
Taken together, these findings are in accord with the notion that gene (operon) order is poorly conserved among bacteria and archaea. Moreover, they strongly suggest that, at large evolutionary distances, the genomes are (nearly) homogenized with respect to the operon arrangement, with (virtually) no memory of the ancestral genome organization. A corollary to this conclusion is that statistically significant conserved gene strings can be confidently predicted to form operons. More specifically, this notion is supported by at least five lines of argument: (1) The likelihood that such conserved gene strings are observed by chance is low; (2) there are few of such conserved strings, and all of those that include functionally characterized genes correspond to known or predicted (on the basis of the obviously linked functions of the constituent genes) operons (see the complete results atftp://ncbi.nlm.nih.gov/pub/koonin/genome_align); (3) typical conserved gene strings include 3–4 genes which is also the characteristic size of operons; (4) conserved gene strings that include genes from adjacent, independent operons are extremely rare; (5) nearly all conserved gene strings consist of genes that are transcribed in the same direction.
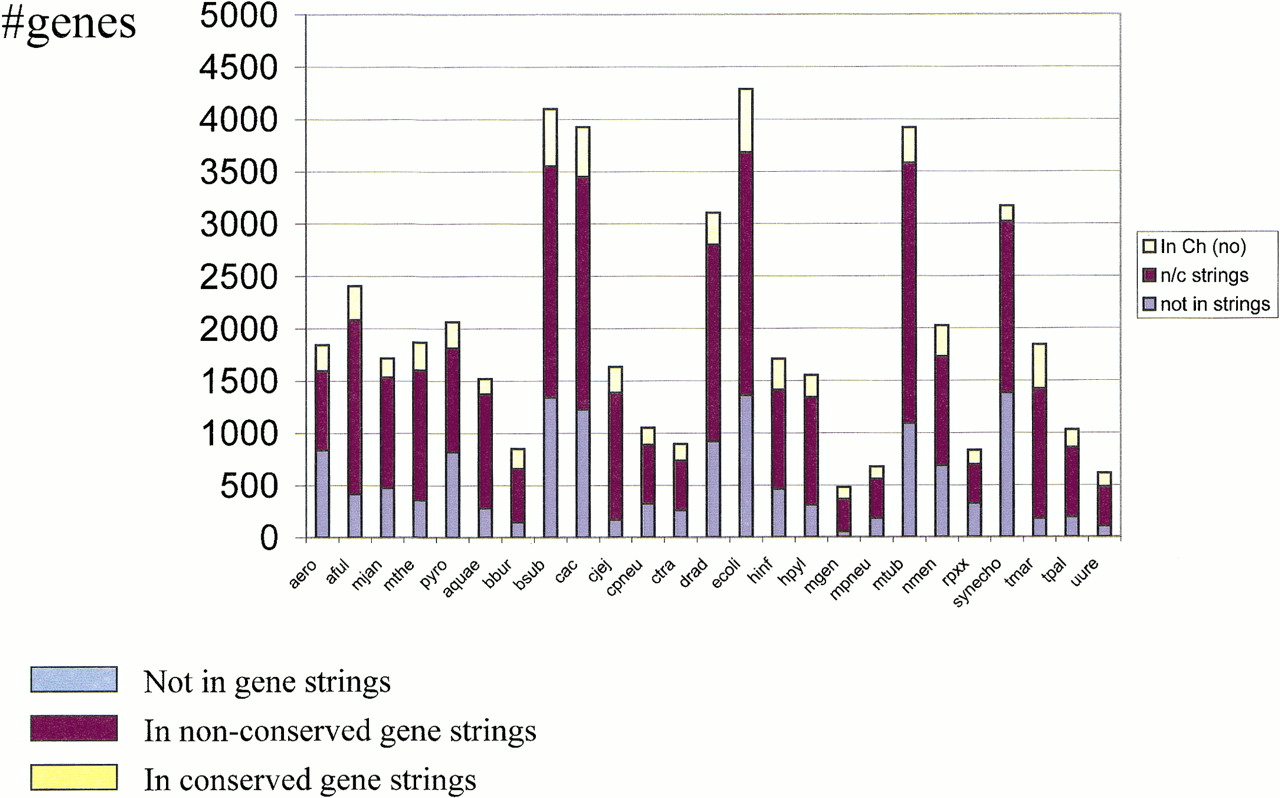
Given the limited conservation of the gene order detected in pairwise genome alignments, we combined them to produce template-anchored multiple alignments for each of the bacterial and archaeal genomes. A template-anchored alignment shows the total coverage of the given genome (the template) with conserved gene strings that comprise each of the pairwise alignments (Fig. 3). Even in these multiple alignments, the total coverage of genomes with conserved gene strings (known and predicted operons) was generally low, but showed a striking range from <5% for the cyanobacteriumSynechocystis sp. to 24% in M. genitalium (the bacterium with the smallest genome) and 23% for the hyperthermophilic bacterium Thermotoga maritima (Fig.4). The paucity of conserved operons inSynechocystis has been noticed previously (Itoh et al. 1999). An attractive recent hypothesis postulates origin of operons encoding macromolecular complexes in ancestral hyperthermophilic prokaryotes under the selective pressure to channel thermolabile substrates (Glansdorff 1999). Under this scenario, it could be expected that genomes of hyperthermophiles would show a greater density of operons than those of mesophiles. Clearly, however, there is no such consistent trend, at least with respect to operons that are conserved in evolution; indeed, whereas T. maritima is among the genomes most densely covered with conserved operons, the other bacterial hyperthermophile, Aquifex aeolicus, is at the lower end of the spectrum (Fig. 4). Archaea also show relatively low coverage in spite of the availability of six archaeal genomes (Fig. 4). Thus the analysis of gene order conservation fails to yield evidence in support of the thermophilic hypothesis of operon origin.
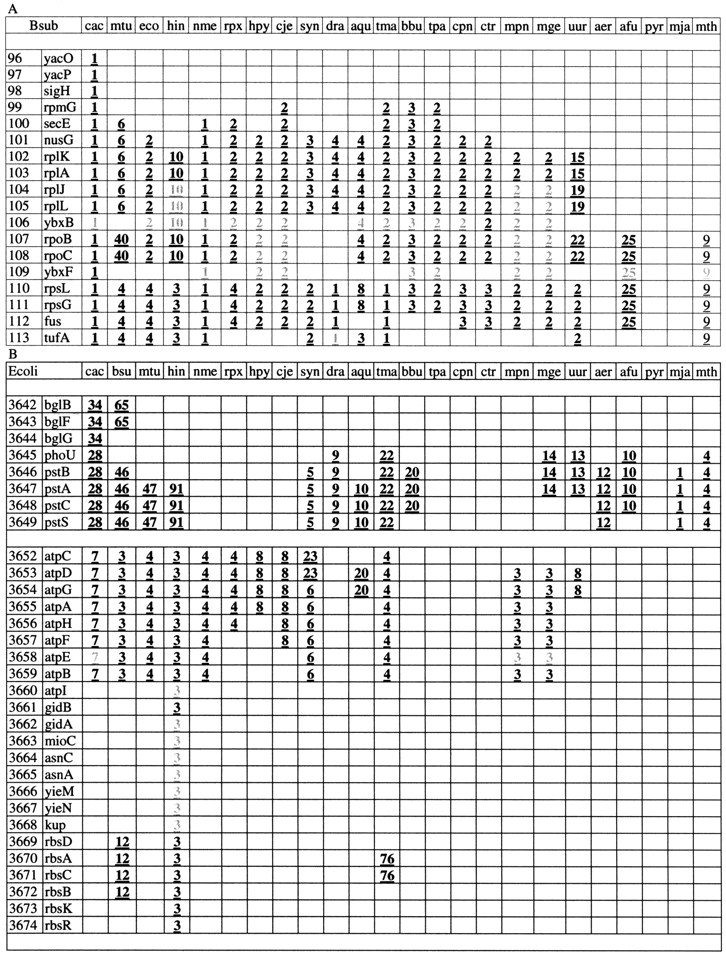
Segments of template-anchored, gene-by-gene genome alignments. (A) Template Bacillus subtilis. A section of the ribosomal superoperon is shown. (B) Template Escherichia coli. Two distinct gene strings separated by blank lines are shown. The top string includes the β-glucosidase operon and the phosphate transport operon. The bottom string includes the H+-ATPase operon, three genes implicated in cell division and potentially forming an operon (gidA, gidB, mioC), the asparagine synthetase operon, the predicted Mg-chelatase operon (yieN-yieM; see Table 3), and the ribose transport operon. The first column shows the number of the respective gene in the genome and the second column shows the gene name. The rest of the columns show the rank of the respective gene string in the corresponding pairwise genome comparison (information density-based alignments;E-value < 0.1). The gray numbers indicate positions with gaps or mismatches in the gene strings.
Coverage of prokaryotic genomes with nonconserved and conserved gene strings. Conserved gene strings were from information-density-based alignments with E < 0.1. The union of nonconserved and conserved gene strings was considered to comprise the set of potential operons (see text). Pairs of closely related genomes, namely C. trachomatis/C. pneumoniae, M. genitalium/M. pneumoniae,B. subtilis/C. acetobutilicum, and M. jannaschii/M. thermoautotrophicum, were disregarded for these calculations.
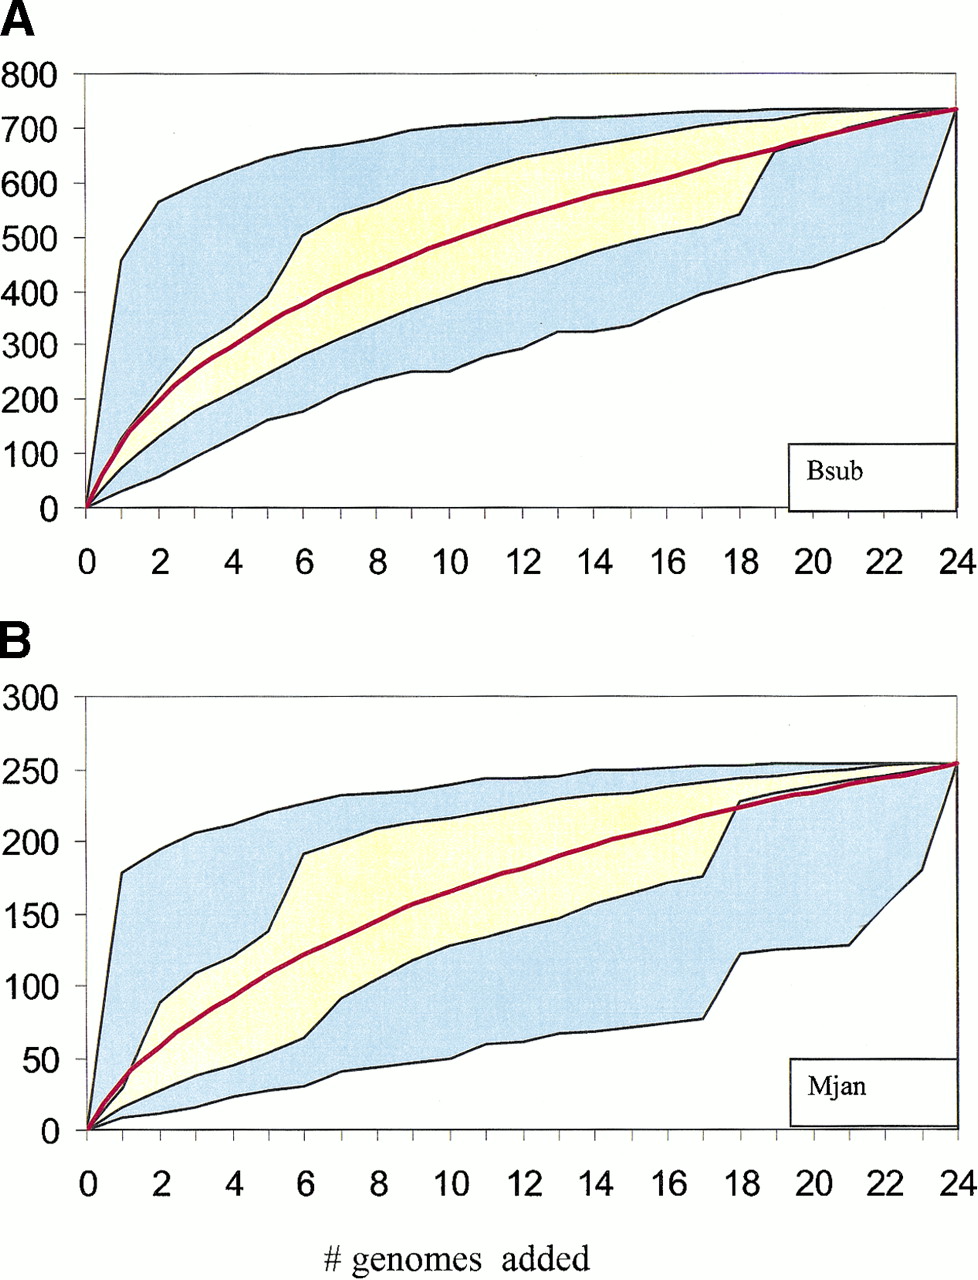
The number of potential operons in a prokaryotic genome may be approximated by a number of gene strings that are transcribed in the same direction (such groups of genes have been aptly dubbed ‘directons’, Salgado et al. 2000) and are separated by (relatively) short untranslated spacers. Under a liberal spacer length cut-off of 100 bp, from 54% (the crenarchaeon Aeropyrum pernix) to 90% (T. maritima) of the genes in each genome belong to tightly spaced directons, or potential operons. A recent estimate based on a detailed analysis of the distributions of spacer lengths between genes within known operons and those between transcriptional units suggested that E. coli could possess ∼700 operons (Salgado et al. 2000), which, with the average number of 3–4 genes per operon, amounts to 2000–2500 (∼55% genes). This is somewhat lower than, but not incompatible with the above estimates based on the number of directons that therefore may be used as a reasonable upper bound on the number of operons in prokaryotic genomes. Obviously, only a relatively small fraction of these potential operons show evolutionary conservation within the presently available sample of genomes (Fig. 4). Thus, either the majority of closely spaced directons are, in fact, not operons or, more likely, most of the operons are relatively unstable in evolution and are conserved only in the genomes of closely related species, or due to horizontal transfer. Retracing and simulating the effect of the accumulation of complete prokaryotic genome sequences on the coverage of genomes with conserved gene strings (predicted operons) seems to corroborate the latter view. On average, each added genome makes an incremental, unique contribution to the coverage (Fig. 5). Clearly, however, coverage grows slower than linearly, and although the available data did not allow a reliable extrapolation, it appears that, unless series of closely related genomes are sequenced, many more distantly related ones needed to approach complete coverage of all potential operons.
Contribution of accumulating genome sequences to the coverage of genomes with conserved gene strings. For a given template genome, the other 24 genomes were added one-by-one in a random order, and the number of genes from the template genome covered with conserved gene strings (information-density-based alignments,E < 0.1) was recorded at each step. The blue area shows the range between the minimal and the maximal coverage obtained in 100 random replications of the procedure. The yellow area shows the range between the 25% and 75% quantiles for each step. The red line shows the average alignment coverage in the 100 replications.
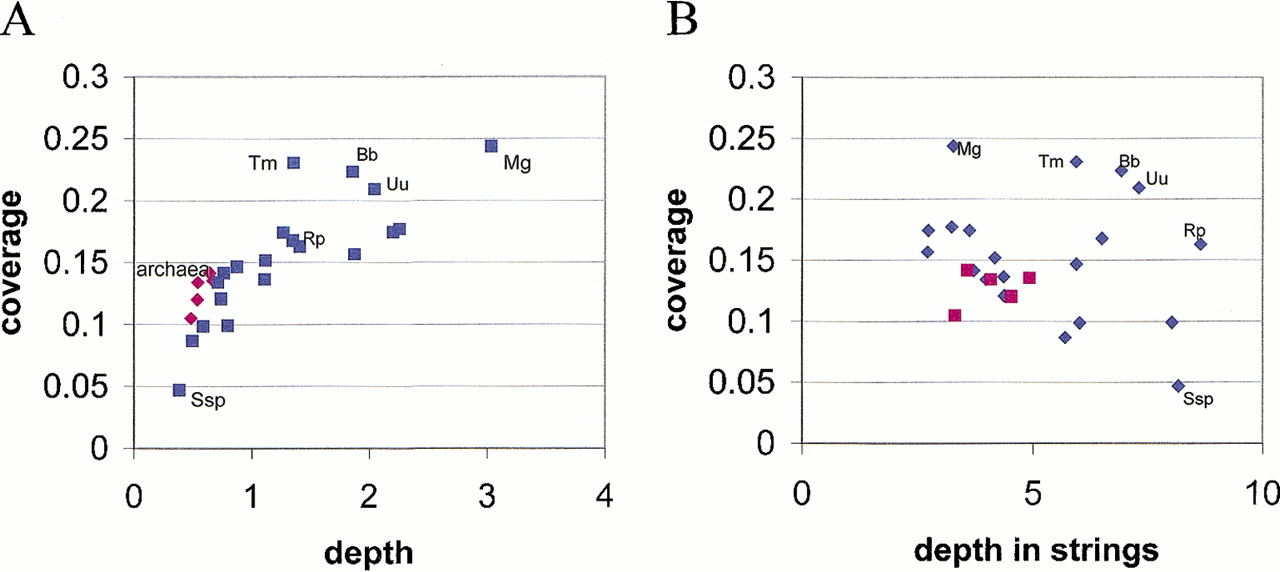
The coverage of a genome with conserved gene strings (predicted operons) is one characteristic of the conservation of genome organization, and the depth of coverage (in other words, the height of the stack of aligned genomes in a template-anchored alignment, as shown in Fig. 2) is another. There is a clear correlation between the two values, with Synechocystis showing the lowest andM. genitalium the highest values of both parameters;T. maritima stands out, with high coverage and low depth (Fig. 6A). When the alignment depth is measured for those genes that belong to conserved gene strings only, an inverse correlation is seen in that the genomes covered sparsely with conserved operons (such as Synechocystis) show high values of relative depth, and vice versa (Fig. 5B). In other words, those genomes that are covered sparsely with conserved gene strings encompass primarily the most common operons. This plot, however, reveals an additional anomaly in a subset of parasitic bacteria with small genomes, namely spirochetes and particularly Rickettsia, which show relatively broad and also deep coverage of the genome with conserved gene strings (Fig. 5B). Notably, the coverage of the archaeal genomes is within the range characteristic of bacteria, albeit close to its lower end (Fig. 5A,B).
Conserved gene strings in prokaryotic genomes: coverage versus depth. Information-density-based alignments (E < 0.1) were used to calculate coverage and alignment depth. The coverage is expressed as the fraction of genes in a genome that are included in conserved gene strings. The depth is expressed as the average number of genes in a column of the template-anchored alignment for the respective genome (A) or the average number of genes in a column that belongs to a conserved gene string (i.e., contains at least one gene) (B). Abbreviations: Bb, Borrelia burgdorferi, Mg,Mycoplasma genitalium; Ssp, Synechocystis sp., Tm,Thermotoga maritima, Uu, Ureaplasma urealyticum.
The present, systematic comparative assessment of gene order conservation in bacteria and archaea indicates that: (1) at large evolutionary distances, genome rearrangement has reached — or at least is approaching — saturation, and what conservation is observed is dictated by functional constraints on operon structure; and (2) prokaryotic genomes differ dramatically in the level of (predicted) operon conservation, with the genome coverage by conserved gene strings varying from <5% to ∼25%; (3) the proportion of conserved gene strings in archaeal genomes is comparable to that in bacteria; however, only a small number of (predicted) operons are shared by archaea and bacteria.
Conservation of Gene Order versus Other Measures of Genome Evolution
Conservation of gene order is one of the genome-scale evolutionary parameters that have become measurable with the availability of multiple complete genome sequences. We examined the relationship between the conservation of (predicted) operon structure and the conservation of gene repertoires and protein sequences themselves. The Clusters of Orthologous Groups of proteins (COGs) were used as the source of data on the conservation of gene repertoires (Tatusov et al. 1997, 2000). Distinct relationships were revealed between gene repertoire conservation and the conservation of gene order for the archaeal–bacterial, bacterial–bacterial and archaeal–archaeal genome comparisons. Figure 7A shows a plot of the co-occurrence coefficients between genomes in the COG set versus those in the set of conserved gene strings (see Methods). The archaeal–bacterial comparison data appear to scatter randomly in terms of gene string conservation, but are clearly separated into three distinct subsets along the COG co-occurrence axis (Fig. 7A). The subset with the lowest co-occurrence in the COGs includes the pairs of archaeal genomes and those of highly degraded bacterial parasites, namely Mycoplasma, Chlamydia, Rickettsia and Spirochetes; the subset with the highest co-occurrence coefficients surprisingly consists of the comparisons between the CrenarchaeonA. pernix and all bacterial genomes; the largest subset, which includes the rest of the interkingdom pairs, significantly overlaps with the bacterial–bacterial comparisons (Fig. 7A). The archaeal–archaeal genome pairs form a distinct set in the upper right part of the plot, with high co-occurrence coefficients in both the COGs and conserved gene strings (Fig. 7A). The bacterial–bacterial genome comparisons span a wide range of values of both measures, and a correlation between the conservation of gene repertoire and that of the gene order was discernible (Fig. 7B).
Measures of genome evolution: operon conservation versus conservation of gene repertoire and protein sequences. Alignments including apparent orthologs (bidirectional best hits) were used in both plots (E < 0.1). (A) Gene string conservation versus co-occurrence in clusters of orthologous genes (COGs). The co-occurrence coefficients for genome alignments and for the COGs were calculated as indicated in Methods. (Dark-blue diamonds) Archaeal-bacterial comparisons, (light-blue crosses) bacterial–bacterial comparisons, (red squares) archaeal–archaeal comparisons. (B) Gene string conservation versus sequence identity level between probable orthologs. Horizontal axis: median fraction of identical amino acid residues among probable orthologs. The other designations are as in A.

The median of the similarity score (in the simplest case, percent identity) distribution among orthologs appears to be a useful measure of genome evolution that can be employed to construct phylogenetic trees (Grishin et al. 2000). When the median percent identity values were plotted against the co-occurrence co efficient in conserved gene strings, a positive correlation was observed, with a clear separation of archaeal–bacterial, bacterial–bacterial and archaeal–archaeal genome pairs (Fig.7B). The general inverse correlation between phylogenetic distance and gene order conservation has been discussed previously (Mushegian and Koonin 1996; Siefert et al. 1997; Watanabe et al. 1997;Dandekar et al. 1998; Itoh et al. 1999).
To summarize, conservation of predicted operons (gene strings) in prokaryotic genomes showed a degree of correlation with the other evolutionary parameters we examined, namely the conservation of gene repertoires and the protein sequences themselves. However, compared to these measures, operon conservation appeared to show less correlation with phylogenetic relationships or the known features of organisms' lifestyles. It is, for example, unclear why the cyanobacterium Synechocystis sp. possesses so few conserved operons, and the hyperthermophilic bacterium T. maritima has so many, whereas the other bacterial hyperthermophile, Aquifex, is among the genomes with the lowest level of operon conservation. If the functional cognates of these and other peculiarities of the patterns of gene order conservation could be identified, this might shed an unexpected light on bacterial and archaeal biology.
Prediction of Gene Functions Using Information Extracted from the Gene Order Conservation
Conservation of operon organization is one of the principal types of context information, which appears to become increasingly important with the growth of the collection of completely sequenced genomes (Galperin and Koonin 2000; Huynen and Snel 2000a; Huynen et al. 2000). The results of the systematic analysis of the conservation of gene order presented here support the notion that most, if not all, gene strings that are conserved in taxonomically distant prokaryotes are indeed operons, rather than remnants of the ancestral gene order. Accordingly, the genes found in such strings, particularly in multiple genomes, can be legitimately assumed to be functionally linked, and the information on gene clustering can be used for functional prediction. However, the very same evolutionary force that seems to ensure the robustness of predictions based on gene order conservation — rampant recombination that leaves intact only gene strings (operons) stabilized through selection — limits the potential of this source of information in terms of functional prediction.
We were interested in benchmarking the approach to gene function prediction based on gene string conservation by examining, in detail, the template-anchored genome alignments. What we sought to identify were not all predictions that could be made on the basis of gene order conservation, but those that appeared to be unique to this approach, i.e., could not be attained (at least not with comparable confidence) by sequence analysis, primarily as encapsulated in the COG database. Furthermore, we took a conservative approach by considering only those predictions that stemmed from operon conservation in at least three genomes, or statistically significant local alignments of two genomes. Only those predictions were considered that appeared to significantly contribute to our understanding of the probable function(s) of the protein in question; predictions of previously undetected functional links between proteins with well-characterized functions were not included unless deemed critical for understanding the central function of a protein. Because of all these restrictions, the set of predictions obtained here should be considered a low bound on the predictive potential of gene order comparisons. As a feedback, the proteins whose functions were predicted or clarified on the basis of operon conservation analysis were subjected to additional, detailed sequence analysis using, primarily, the PSI-BLAST program, to further enhance the predictions.
We found that functional assignments for completely uncharacterized proteins or a major clarification of the probable function were possible for ∼90 COGs, or ∼4% of the 2422 analyzed COGs (Table3). Even with all the qualifications discussed above, this number should be considered an approximation because the decision on what constitutes a major prediction inevitably includes a subjective element. This uncertainty notwithstanding, the yield of unique functional predictions from operon conservation analysis was relatively modest. However, this should not detract from the apparent importance of many of these predictions. Examples include the prediction of several previously undetected components of the translation machinery, such as probable translation factors, ribosome-associated proteins and RNA modification enzymes, and components of the DNA repair machinery (Table 3). The prediction rate was nonuniform across the range of the available genomes, with more predictions attainable for the poorly characterized archaeal genomes than for bacterial genomes. The distribution of the predictions across the range of cellular functions was also nonuniform. In particular, a disproportionately large number of predictions were for translation-related and replication/repair-related functions, apparently because operons coding for components of these systems show greater evolutionary conservation than those coding for other types of cellular functions.
Prediction of Gene Function on the Basis of the Gene Order Conservationa

|

|

|

|
The predictions stemming from gene order conservation differ in character from those made using sequence-structure comparison. The latter tend to predict the biochemical activity of a protein, such as ATPase or nuclease, and even the details of the active center, but is often less informative in terms of pinpointing the protein's actual cellular role. In contrast, analysis of the gene order helps placing an uncharacterized protein in the context of a cellular functional system, such as translation or replication, but may not decipher the exact biochemistry. Combined, the analyses of sequences and structures and of gene order are capable of producing detailed functional predictions. This can be exemplified by four uncharacterized, highly conserved proteins that are predicted to possess GTPase activity on the basis of sequence analysis and are confidently assigned to the translation system on the basis of the genome context (Table 3). One of these GTPases (COG0012) is ubiquitous in all cellular life forms, and two others are present in all or nearly all bacteria (Table 3), which are the phyletic patterns characteristic of the components of the translation machinery. Furthermore, two of these predicted new translation factors (COG0012 and COG0536) additionally contain the tRNA-binding TGS (Threonyl-tRNA synthetase, GTPases, SpoT) domain (Wolf et al. 1999), which further supports the translation connection. These predictions emphasize that fundamental aspects of central cellular functions such as translation still remain to be uncovered, and gene order conservation, its limitations notwithstanding, can be one of the important sources of information for the identification of candidate proteins.
As befits an approach based on the conservation of gene strings, genome alignment analysis resulted in the prediction of several operons that encode for previously undetected functional complexes. These include two distinct restriction-modification systems, two unique helicase-nuclease combinations that probably comprise novel repair complexes, an operon that, on the basis of the predicted activities of the respective gene products, is predicted to encode a previously undetected molecular chaperone complex associated with the translation machinery (see also below), and three predicted operons that encode the probable archaeal counterpart of the eukaryotic exosome (Table 3; the latter finding and its multiple implications are presented in detail inKoonin et al. 2001). Some of the functional predictions that result from the analysis of archaeal operons have the extra benefit of the extrapolation to eukaryotic orthologs of archaeal proteins, for which the data on gene order cannot be used directly; the predicted exosome-proteasome operons are the strongest example (Koonin et al. 2001).
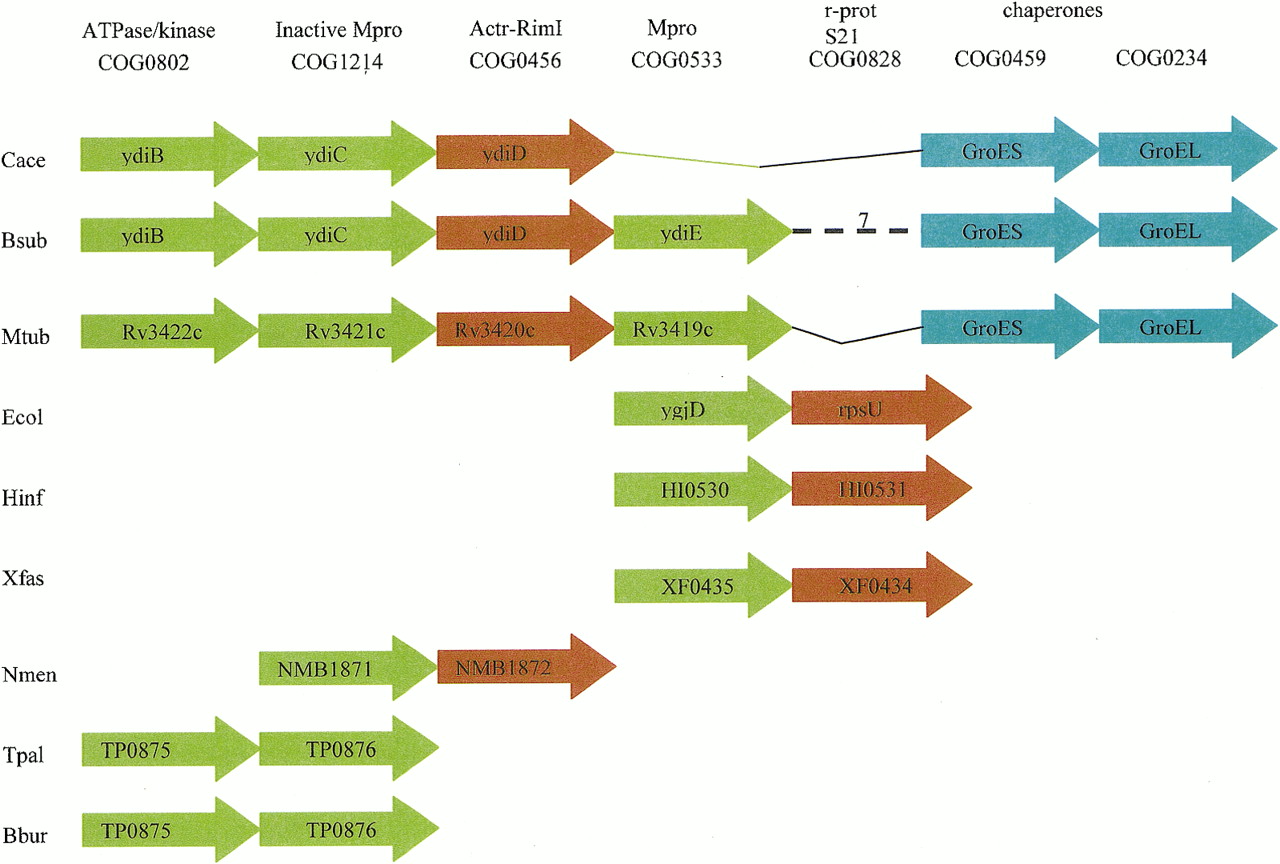
As an example of a gene-order-based functional prediction with multiple implications, we discuss here in some detail the predicted, novel translation-linked chaperone complex. Several overlapping configurations of the predicted operon were detected in multiple bacterial genomes (Fig. 8). The core of the operon includes two genes with predicted chaperone functions, namely the metalloprotease with the HSP70 fold (COG0533) and its diverged paralog in which the catalytic site is disrupted (COG1214). It appears likely that both of these proteins, particularly the inactivated version, function as molecular chaperones (Aravind and Koonin 1999). The adjacency of the genes encoding the GroEL-GroES chaperonin–co-chaperonin pair in Clostridium,Mycobacterium, and (with an insert) Bacillus (Fig. 8) is an additional indication of a chaperone function for the proposed complex. A connection with translation is suggested by the presence of a gene that encodes the RimI acetyltransferase involved in acetylation of ribosomal proteins (Yoshikawa et al. 1987; COG 0456) inClostridium, Bacillus, Mycobacterium, andNeisseria and the gene for the ribosomal protein S21 in Gamma-Proteobacteria (Fig. 8). This case illustrates the complementary contributions of different genomes to functional prediction based on gene order conservation. No single genome contains all the relevant genes within a single string (predicted operon), but the presence of different functionally suggestive gene combinations in different genomes seems to make a strong case for the existence of a previously undetected protein complex with a chaperone-like activity. InClostridium, Bacillus, and Mycobacterium, the subunits of this predicted complex appear to be encoded by a single operon that seems to have undergone various disruptions and rearrangements in other bacteria.
Organization of genes for subunits of the predicted novel, translation-associated chaperone complex in bacterial chromosomes. Genes are shown as arrows (not drawn to scale). Green arrows show genes coding for subunits of the postulated chaperone complex; orange arrows show genes for translation-associated proteins; blue arrows show genes encoding molecular chaperones. The corresponding systematic gene names are indicated. For Clostridium, the genes are provisionally named after their Bacillus orthologs. B. subtilis has a 7-gene insert indicated by a broken line. The (predicted) functions of the gene products and the corresponding COG numbers are indicated above the aligned genes. Abbreviations: Mpro, metalloprotease; Actr, acetyltransferase; r-prot, ribosomal protein.
An additional application of the gene order conservation analysis is the ability to clarify orthologous relationships between genes on the basis of their genomic context. An example of the delineation of a previously unrecognized set of orthologs includes the new COG2890, which consists of predicted rRNA or tRNA methylases that have been previously lumped in a single COG with a variety of other methyltransferases. Furthermore, several new COGs were identified when previously untranslated genes orthologous to genes found in a particular, conserved genomic context were detected, e.g., the new COGs 2888 and 2890.
Conclusions
The systematic comparison of gene order in bacterial and archaeal genomes confirms the notion that there is very little, if any, conservation above the operon level between phylogenetically distant genomes. A corollary is that whenever statistically significant conservation of gene order is observed, it should be considered an indication of operon organization of the respective genes and a legitimate basis for the prediction of functional and potentially physical interactions between genes, which, through ‘guilt by association,’ helps in predicting functions of uncharacterized genes. However, the same evolutionary force that makes conserved gene strings functionally relevant (namely, intensive intragenomic recombination) limits the utility of the gene order data for functional prediction, because only a minority of the potential operons in any given genome are covered by alignments with sufficiently distant genomes from the current collection of complete genomes. It appears that many more genomes need to be sequenced to significantly increase this coverage. Multiple genomes separated by intermediate evolutionary distances such as representatives of different genera within the same bacterial family could be particularly helpful for making the best use of gene order conservation.
A detailed examination of template-anchored multiple genome alignments for all completely sequenced archaeal and bacterial genomes resulted in new functional predictions that have not been attained previously despite detailed sequence analysis, for ∼4% of the ancient conserved protein families represented in the COG collection. Thus, gene order analysis provides for a significant incremental increase in the functional prediction rate for complete prokaryotic genomes, although the contribution of gene order analysis is not comparable to that from direct sequence comparison. These limitations notwithstanding, many potentially important predictions were made, particularly for archaeal genomes. Whereas the ‘genomescape’ of bacterial genomes appears largely familiar and is dominated by well-characterized operons that encode ribosomal proteins, ABC-type transport cassettes, and enzymes of known metabolic pathways, there are many uncharacterized predicted operons that are conserved in archaeal genomes. Examination of these using a combination of gene order comparison and sequence analysis with sensitive methods suggests previously unsuspected aspects of archaeal biology, which may have implications for the functions of eukaryotic homologs of the respective genes.
A rough correlation exists between the conservation of gene order (number of conserved gene strings) and genome-wide measures of evolutionary distance between genomes, such as the conservation of the gene repertoire (defined as the co-occurrence in families of orthologous proteins) and the median level of similarity between orthologs. However, to a much greater extent than these measures, the fraction of the prokaryotic genomes that belongs to conserved operons varies within a wide range without an obvious pattern of correlation with the phylogenetic relationships or the lifestyles of the respective species. The identification of the functional cognates of these major differences in the level of operon conservation could potentially reveal new aspects of bacterial and archaeal biology.
METHODS
Genome Sequences, Databases, and Sequence Analysis
The annotated genome sequences with the accompanying information on the positions and transcription directions of all protein-coding genes were retrieved from the Genomes division of the Entrez system. The following genomes were analyzed: bacteria — Aquifex aeolicus(Aquae), Bacillus subtilis (Bsub), Borrelia burgdorferi (Bbur), Campylobacter jejunii (Cjej),Chlamydia trachomatis (Ctra), Chlamydia pneumoniae(Cpne), Clostridium acetobutilicum (Cace),Deinococcus radiodurans (Drad), Escherichia coli(Ecoli), Haemophilus influenzae (Hinf), Helicobacter pylori (Hpyl), Mycoplasma genitalium (Mgen),Mycoplasma pneumoniae (Mpne), Mycobacterium tuberculosis(Mtub), Neisseria meningitidis (Nmen),Synechocystis PCC6803 (Synecho), Thermotoga maritima(Tmar), Treponema pallidum (Tpal), and Ureaplasma urealyticum (Uure), and archaea — Archaeoglobus fulgidus(Aful), Methanobacterium thermoautotrophicum (Mthe),Methanococcus jannaschii (Mjan), Pyrococcus horikoshii(Pyro) (Euryarchaeota), and Aeropyrum pernix(Aero) (Crenarchaeota). In addition, the genomes ofXylella fastidiosa (Xfas) and Vibrio cholerae (Vcho) that have become available during this work were used for the analysis of some of the conserved gene strings.
For the construction of genome alignments, an all-against-all comparison of the protein sequences encoded in the complete prokaryotic genomes was performed using the BLASTP program (Altschul et al. 1997). The alignment scores were calculated as the information density, i.e., the BLAST score expressed in bits divided by the length of the shorter sequence in the alignment. Additional, iterative database searches for detailed analysis of protein sequences were run against the nonredundant database of protein sequences (National Center for Biotechnology Information, NIH, Bethesda, MD) using the PSI-BLAST program (Altschul et al. 1997;Altschul and Koonin 1998). Protein sequences were also compared to the database of Clusters of Orthologous Groups of proteins (COGs;http://www.ncbi.nlm.nih.gov/COG/) using the COGNITORprogram (Tatusov et al. 1997, 2000), to the database of domain-specific Hidden Markov Models using the SMART program (Schultz et al. 2000), and to the NCBI's CD (Conserved Domains) collection of position-specific scoring matrices using the reversedPSI-BLAST program (http://www.ncbi.nlm.nih.gov/Structure/cdd/wrpsb.cgi).
Local Gene-By-Gene Genome Alignments
For a pair of genomes, the results of all-against-all protein comparisons were postprocessed in two ways, depending on what scoring scheme was used. For the information-density-based scheme, all scores were normalized in such a way that the average score of a unidirectional best hit equaled 1. For the ortholog-based scheme, the gene pairs that formed a bidirectional best hit were assigned a score of 1, and all other pairs were assigned a score of 0. In both cases, the pairs of genes whose protein products did not yield statistically significant local alignments (E-value <0.01 with the search space adjusted to the size of the nonredundant database) were assigned a 0 score. The program Lamarck was written for constructing local genome alignments. Lamarck first exhaustively searches for all ungapped local alignments that have at ⋝2 positively scoring matches within a window of length 4 and then heuristically attempts to link the ungapped alignments into longer chains. Scores of these chains were computed using empirically chosen gap opening, gap extension, and spacer penalties of 0.0, 0.3, and 0.3, respectively; a linked chain is accepted if its score is greater than the sum of the scores of the original alignments. Statistical significance of the local alignments was estimated using Monte Carlo simulations. For each pair of genomes, 100 pairs of shuffled gene sequences with the same distribution ofBLAST scores as the real pair were aligned, and a score distribution of gene strings was produced, which allows the estimation of the random expectation (E) for each score value.
Other Methods of Genome Comparison
The table of co-occurrence of genomes in COGs is available on the COG Web site (http://www.ncbi.nlm.nih.gov/COG/l). The co-occurrence Jackard coefficients were calculated as Qij = Cij/(Ni + Nj − Cij) where Cij is the number of COGs in which genomes iand j cooccur, and Ni and Nj are the numbers of COGs that include the genomes i and j, respectively (Sneath and Sokal 1973). Similarly, co-occurrence coefficients for conserved gene strings were calculated from the numbers of genes with positive scores in the pairwise alignment of the genomes i and j and from the total number of genes from the respective genomes that participate in at least one pairwise alignment with any of the other genomes. The distributions of percent identity between probable orthologs for each pair of genomes were calculated from the results of all-against-all protein comparisons as described previously (Grishin et al. 2000).
Availability of the Complete Results
Template-anchored and pairwise local genome alignments for all completely sequenced bacterial and archaeal genomes are available atftp://ncbi.nlm.nih.gov/pub/koonin/genome_align. The programLamarck for local genome alignment is available from the authors upon request.
We thank L. Aravind and Kira Makarova for helpful discussions. The genome sequence of acetobutilicum was released by Genome Therapeutic Corporation prior to publication through the NCBI's ‘BLAST with Microbial Genomes’ Web page (http://www.ncbi.nlm.nih.gov/Microb_blast/unfinishedgenome.html). This prepublication release is gratefully acknowledged.
The publication costs of this article were defrayed in part by payment of page charges. This article must therefore be hereby marked “advertisement” in accordance with 18 USC section 1734 solely to indicate this fact.
Notes
[2] Corresponding author.
Notes
[3] E-MAIL [email protected]; FAX (301)480-9241.
[4] Article published on-line before print: Genome Res.,10.1101/gr.161901.
[5] Article and publication are at www.genome.org/cgi/doi/10.1101/gr.161901.
REFERENCES
- ↵S.F. Altschul(1998) Generalized affine gap costs for protein sequence alignment. Proteins 32:88–96.
- ↵S.F. AltschulW. Gish(1996) Local alignment statistics. Methods Enzymol. 266:460–480.
- ↵S.F. AltschulE.V. Koonin(1998) PSI-BLAST — a tool for making discoveries in sequence databases. Trends Biochem. Sci. 23:444–447.
- ↵S.F. AltschulT.L. MaddenA.A. SchafferJ. ZhangZ. ZhangW. MillerD.J. Lipman(1997) Gapped BLAST and PSI-BLAST: A new generation of protein database search programs. Nucleic Acids Res. 25:3389–3402.
- ↵L. AravindE.V. Koonin(1999) Gleaning non-trivial structural, functional and evolutionary information about proteins by iterative database searches. J. Mol. Biol. 287:1023–1040.
- ↵T. DandekarB. SnelM. HuynenP. Bork(1998) Conservation of gene order: A fingerprint of proteins that physically interact. Trends Biochem. Sci. 23:324–328.
- ↵W.M. Fitch(1970) Distinguishing homologous from analogous proteins. Syst. Zool. 19:99–106.
- ↵W. FujibuchiH. OgataH. MatsudaM. Kanehisa(2000) Automatic detection of conserved gene clusters in multiple genomes by graph comparison and P-quasi grouping. Nucleic Acids Res. 28:4029–4036.
- ↵M.Y. GalperinE.V. Koonin(2000) Who's your neighbor? New computational approaches for functional genomics. Nat. Biotechnol. 18:609–613.
- ↵N. Glansdorff(1999) On the origin of operons and their possible role in evolution toward thermophily. J. Mol. Evol. 49:432–438.
- ↵N.V. GrishinY I. WolfE.V. Koonin(2000) From complete genomes to measures of substitution rate variability within and between proteins. Genome Res. 10:991–1000.
- ↵S. HenikoffJ.G. Henikoff(2000) Amino acid substitution matrices. Adv. Protein. Chem. 54:73–97.
- ↵R. HimmelreichH. PlagensH. HilbertB. ReinerR. Herrmann(1997) Comparative analysis of the genomes of the bacteria Mycoplasma pneumoniae and Mycoplasma genitalium. Nucleic Acids Res. 25:701–712.
- ↵M.J. HuynenB. Snel(2000) Gene and context: Integrative approaches to genome analysis. Adv. Prot. Chem. 54:345–379.
- ↵M. HuynenB. SnelW. LatheP. Bork(2000a) Exploitation of gene context. Curr. Opin. Struct. Biol. 10:366–370.
- ↵(2000b) Predicting protein function by genomic context: quantitative evaluation and qualitative inferences. Genome Res. 10:1204–1210, ibid.
- ↵T. ItohK. TakemotoH. MoriT. Gojobori(1999) Evolutionary instability of operon structures disclosed by sequence comparisons of complete microbial genomes. Mol. Biol. Evol. 16:332–346.
- ↵F. JacobD. PerrinC. SanchezJ. Monod(1960) L'Operon: Groupe de genes a expression coordonee par un operateur. C.R. Seance Acad. Sci. 250:1727–1729.
- ↵M. KanehisaS. Goto(2000) KEGG: Kyoto encyclopedia of genes and genomes. Nucleic Acids Res. 28:27–30.
- ↵E.V. KooninY.I. WolfL. Aravind(2001) Prediction of the archaeal exosome and its connecitons with the proteasome and the translation and transcription machineries by a comparative-genomic approach. Genome Res. 11:240–252.
- ↵E.V. KooninA.R. MushegianK.E. Rudd(1996) Sequencing and analysis of bacterial genomes. Curr. Biol. 6:404–416.
- ↵J. Lawrence(1999) Selfish operons: The evolutionary impact of gene clustering in prokaryotes and eukaryotes. Curr. Opin. Genet. Dev. 9:642–648.
- ↵(1997) Selfish operons and speciation by gene transfer. Trends Microbiol. 5:355–359, ibid.
- B. MartinP. GarciaM.P. CastanieB. GliseJ.P. Claverys(1995) The recA gene of Streptococcus pneumoniae is part of a competence-induced operon and controls an SOS regulon. Dev. Biol. Stand. 85:293–300.
- ↵A.R. MushegianE.V. Koonin(1996) Gene order is not conserved in bacterial evolution. Trends Genet. 12:289–290.
- I. NarumiK. SatohM. KikuchiT. FunayamaS. KitayamaT. YanagisawaH. WatanabeK. Yamamoto(1999) Molecular analysis of the Deinococcus radiodurans recA locus and identification of a mutation site in a DNA repair-deficient mutant, rec30. Mutat. Res. 435:233–243.
- ↵S.B. NeedlemanC.D. Wunsch(1970) A general method applicable to the search for similarities in the amino acid sequence of two proteins. J. Mol. Biol. 48:443–453.
- ↵R. OverbeekM. FonsteinM. D'SouzaG.D. PuschN. Maltsev(1998) Use of contiguity on the chromosome to predict functional coupling. In Silico Biol. 1:93–108.
- ↵(1999) The use of gene clusters to infer functional coupling. Proc. Natl. Acad. Sci. 96:2896–2901, ibid.
- ↵H. SalgadoG. Moreno-HagelsiebT.F. SmithJ. Collado-Vides(2000) Operons in Escherichia coli: Genomic analyses and predictions. Proc. Natl. Acad. Sci. 97:6652–6657.
- ↵J. SchultzR.R. CopleyT. DoerksC.P. PontingP. Bork(2000) SMART: A web-based tool for the study of genetically mobile domains. Nucleic Acids Res. 28:231–234.
- ↵J.L. SiefertK.A. MartinF. AbdiW.R. WidgerG.E. Fox(1997) Conserved gene clusters in bacterial genomes provide further support for the primacy of RNA. J. Mol. Evol. 45:467–472.
- ↵T.F. SmithM.S. Waterman(1981) Identification of common molecular subsequences. J. Mol. Biol. 147:195–197.
- ↵P.H.A. SneathR.R. Sokal(1973) Numerical taxonomy. (W.H. Freeman, San Francisco, CA).
- ↵B. SnelG. LehmannP. BorkM.A. Huynen(2000) STRING: A web-server to retrieve and display the repeatedly occurring neighbourhood of a gene. Nucleic Acids Res. 28:3442–3444.
- E.D. SpitzerB. Weiss(1985) dfp gene of Escherichia coli K-12, a locus affecting DNA synthesis, codes for a flavoprotein. J. Bacteriol. 164:994–1003.
- ↵R.L. TatusovD.A. NataleI.V. GarkavtsevT.A. TatusovaU.T. ShankavaramB.S. RaoB. KiryutinM.Y. GalperinN.D. FedorovaE.V. Koonin(2001) The COG database: New developments in phylogenetic classification of proteins from complete genomes. Nucleic Acids Res. 29:22–28.
- ↵R.L. TatusovA.R. MushegianP. BorkN.P. BrownW.S. HayesM. BorodovskyK.E. RuddE.V. Koonin(1996) Metabolism and evolution of Haemophilus influenzae deduced from a whole-genome comparison with Escherichia coli. Curr. Biol. 6:279–291.
- ↵R.L. TatusovE.V. KooninD.J. Lipman(1997) A genomic perspective on protein families. Science 278:631–637.
- ↵R.L. TatusovM.Y. GalperinD.A. NataleE.V. Koonin(2000) The COG database: A tool for genome-scale analysis of protein functions and evolution. Nucleic Acids Res. 28:33–36.
- ↵K. TomiiM. Kanehisa(1998) A comparative analysis of ABC transporters in complete microbial genomes. Genome Res. 8:1048–1059.
- ↵M. VingronM.S. Waterman(1994) Sequence alignment and penalty choice. Review of concepts, case studies and implications. J. Mol. Biol. 235:1–12.
- ↵H. WatanabeH. MoriT. ItohT. Gojobori(1997) Genome plasticity as a paradigm of eubacteria evolution. J. Mol. Evol. 44:S57–64.
- ↵Y.I. WolfL. AravindN.V. GrishinE.V. Koonin(1999) Evolution of aminoacyl-tRNA synthetases — analysis of unique domain architectures and phylogenetic trees reveals a complex history of horizontal gene transfer events. Genome Res. 9:689–710.
- ↵A. YoshikawaS. IsonoA. ShebackK. Isono(1987) Cloning and nucleotide sequencing of the genes rimI and rimJ which encode enzymes acetylating ribosomal proteins S18 and S5 of Escherichia coli K12. Mol. Gen. Genet. 209:481–488.
After the manuscript of this article was submitted for publication, several new developments in comparative analysis of prokaryotic gene order have been published. A new method for constructing multiple local genome alignments and its application for comparative analysis of 17 complete archaeal and bacterial genomes has been reported (Fujibuchi et al. 2000). Some of the conclusions reached by Fujibuchi and co-workers overlap with the results presented in the present article, particularly with respect to the coverage of different genomes with conserved gene clusters. The STRING web server for detection of conserved gene clusters in multiple genomes has been described (Snel et al. 2000). In addition, an analysis of the genome of M. genitaliumbenchmarking the context approach to gene function prediction has been published (Huynen et al. 2000b). New functional predictions were reported for ∼10% of M. genitalium genes which is a greater rate than we report in the present paper. This is probably due to a somewhat less restrictive approach to the ‘novelty’ of predictions employed by these workers and also to the fact that we limited our analysis to evolutionarily conserved proteins included in the COGs. Also after this article was submitted for publication, the COG database was significantly updated (Tatusov et al. 2001). However, the COG numbers remain stable, so they still can be used to access any of the COGs mentioned in this article.