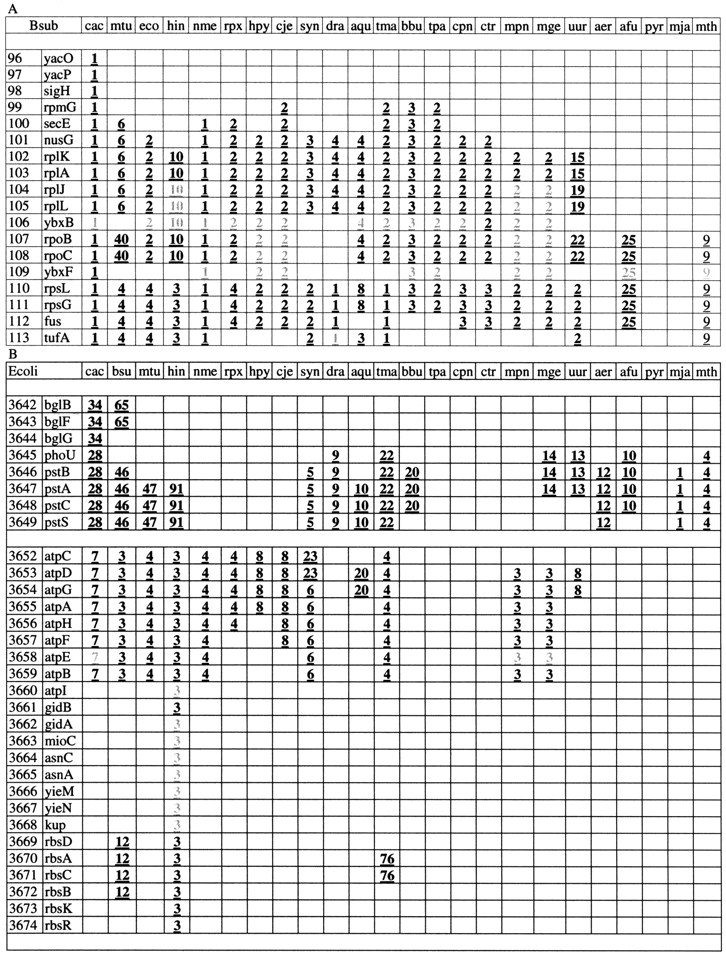
Segments of template-anchored, gene-by-gene genome alignments. (A) Template Bacillus subtilis. A section of the ribosomal superoperon is shown. (B) Template Escherichia coli. Two distinct gene strings separated by blank lines are shown. The top string includes the β-glucosidase operon and the phosphate transport operon. The bottom string includes the H+-ATPase operon, three genes implicated in cell division and potentially forming an operon (gidA, gidB, mioC), the asparagine synthetase operon, the predicted Mg-chelatase operon (yieN-yieM; see Table 3), and the ribose transport operon. The first column shows the number of the respective gene in the genome and the second column shows the gene name. The rest of the columns show the rank of the respective gene string in the corresponding pairwise genome comparison (information density-based alignments;E-value < 0.1). The gray numbers indicate positions with gaps or mismatches in the gene strings.