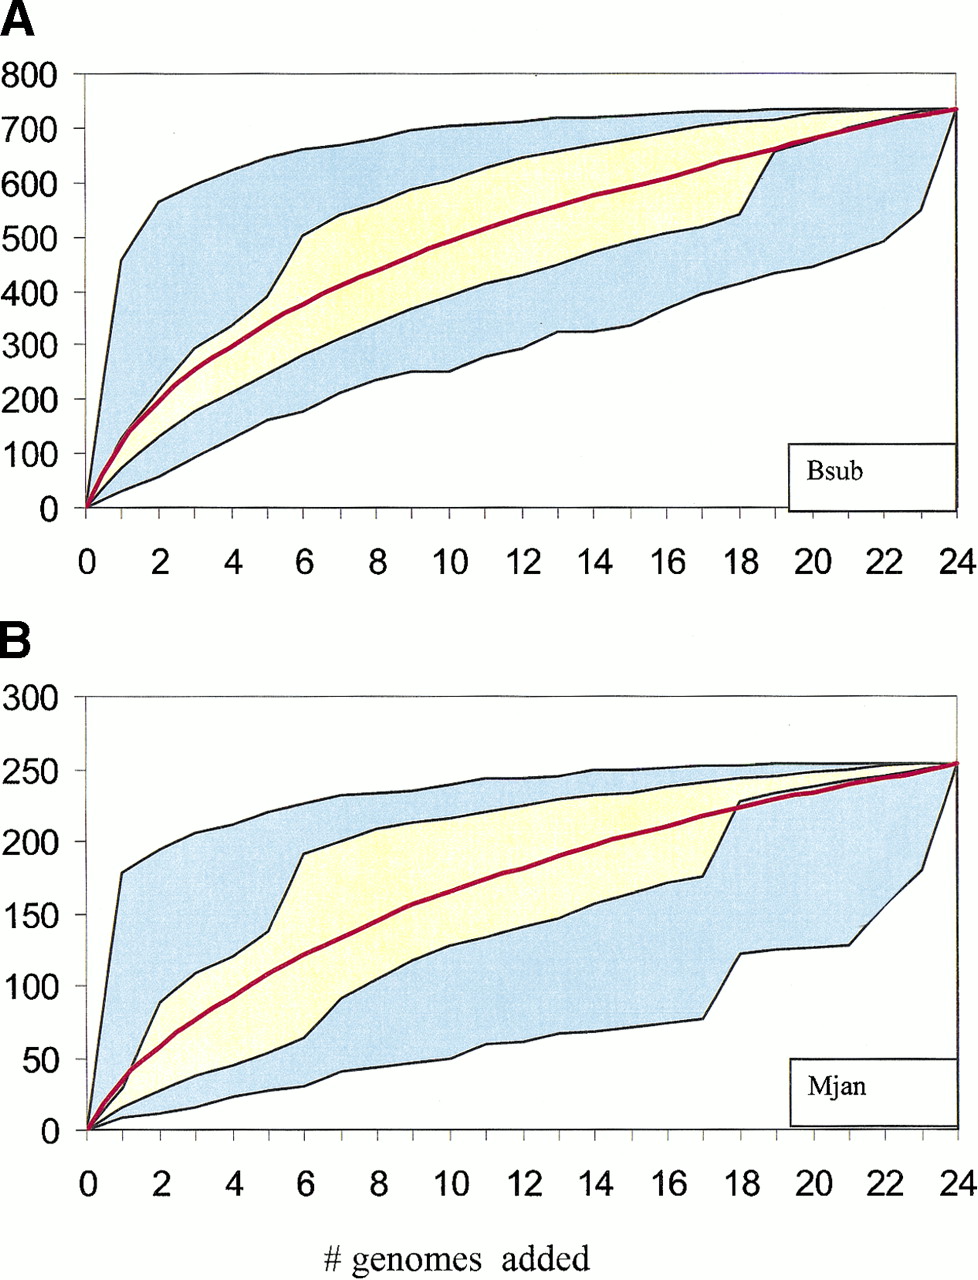
Figure 5.
Contribution of accumulating genome sequences to the coverage of genomes with conserved gene strings. For a given template genome, the other 24 genomes were added one-by-one in a random order, and the number of genes from the template genome covered with conserved gene strings (information-density-based alignments,E < 0.1) was recorded at each step. The blue area shows the range between the minimal and the maximal coverage obtained in 100 random replications of the procedure. The yellow area shows the range between the 25% and 75% quantiles for each step. The red line shows the average alignment coverage in the 100 replications.