
Abstract
Trisomy 21, or Down syndrome (DS), is the most common genetic cause of mental retardation. Changes in the neuropathology, neurochemistry, neurophysiology, and neuropharmacology of DS patients' brains indicate that there is probably abnormal development and maintenance of central nervous system structure and function. The segmental trisomy mouse (Ts65Dn) is a model of DS that shows analogous neurobehavioral defects. We have studied the global gene expression profiles of normal and Ts65Dn male and normal female mice brains (P30) using the serial analysis of gene expression (SAGE) technique. From the combined sample we collected a total of 152,791 RNA tags and observed 45,856 unique tags in the mouse brain transcriptome. There are 14 ribosomal protein genes (nine underexpressed) among the 330 statistically significant differences between normal male and Ts65Dn male brains, which possibly implies abnormal ribosomal biogenesis in the development and maintenance of DS phenotypes. This study contributes to the establishment of a mouse brain transcriptome and provides the first overall analysis of the differences in gene expression in aneuploid versus normal mammalian brain cells.
Trisomy 21 (T21), or Down syndrome (DS), is one of a few autosomal aneuploidies in which many cases escape from fetal or early postnatal lethality. DS phenotypes show variable penetrance, affecting many different organs including brain (mental retardation, early-onset Alzheimer's disease), muscle (hypotonia), heart (congenital heart defects), skeleton (short stature; short fifth finger; short, broad hands; brachycephaly), and blood (increased occurrence of leukemia). However, of these abnormalities, only mental retardation is invariably present in all DS patients (Epstein 1995).
The chromosomal abnormality underlying the DS phenotype, the presence of three copies of chromosome 21 (HC21), was first described in 1959 (LeJeune et al. 1959). Several studies have been undertaken to analyze possible alterations of mRNA or protein levels caused by the presence of an additional set of HC21 genes (Weil and Epstein 1979; Van Keuren et al. 1982; Whatley et al. 1984); however, the precise molecular mechanism that is responsible for the development and maintenance of the complex DS phenotypes remains unclear. The generally accepted working hypothesis is that HC21 contains a certain number of genes that, if present in three copies, will contribute to the DS phenotypes. The accomplishment of the entire sequence of HC21 has been recently reported (Hattori et al. 2000). However, the various DS phenotypes may stem directly from the overexpression of HC21 gene products or indirectly from the interaction of these HC21 gene products with the whole genome, transcriptome, and proteome.
Three viable mouse models that bear three copies of part of mouse chromosome 16 (MMU16), which is homologous to HC21, have been produced: Ts65Dn mice contain three copies of MMU16 from App toMx1 (Reeves et al. 1995); Ts1Cje mice have three copies of MMU16 from Sod1 to Mx1 (Sago et al. 1998a); and Ms1Ts65 mice have three copies of MMU16 from App toSod1 (Sago et al. 1998b). All of these mice show learning and behavioral abnormalities. The phenotype is more pronounced in the Ts65Dn mice, which have the largest region partial trisomy 16 (Hernandez and Fisher 1999; Baxter et al. 2000).
Because mental retardation of different severity is present in all DS patients, we have used the Ts65Dn mice to analyze the global changes of gene expression in the brain of these mice as compared with normal littermates. Gene expression was analyzed in the brains of 30-day-old (P30) Ts65Dn males, normal male and normal female littermates using serial analysis of gene expression (SAGE) methodology (Velculescu et al. 1995). SAGE is a technique that allows the quantitative analysis of a large number of transcripts in a given mRNA population by counting the presence of each transcript. SAGE identifies a short nucleotide sequence of 14–16 bp from a defined position within the transcript (e.g., the 3′-most NlaIII restriction enzyme site). We describe here a mouse brain transcriptome from >150,000 s—50,000 each from Ts65Dn males, normal males, and normal females. We also report changes in gene expression in Ts65Dn mice compared with normal nontrisomic controls.
Our analysis of the mouse brain transcriptome revealed 45,856 unique tags. Comparison of normal and Ts65Dn male brain SAGE libraries showed that there are 330 tags with statistically significant differences between these two samples. The most frequently altered classes of genes are ribosomal proteins. These data provide the first global differential gene expression study in aneuploid versus normal mammalian brains. This may lead to the discovery of genes that are “directly” involved in several phenotypes of DS and eventually to the identification of potential targets for therapeutic interventions. The mouse brain transcriptome provides a database for comparisons to analyze changes in the spatial and temporal expression patterns of individual genes and global gene expression in other mouse models of human diseases affecting the central nervous system. It may also be helpful in gene expression studies in events, such as changes in behavioral state, onset of disease, and response to drugs.
RESULTS
Mouse Brain Transcriptome
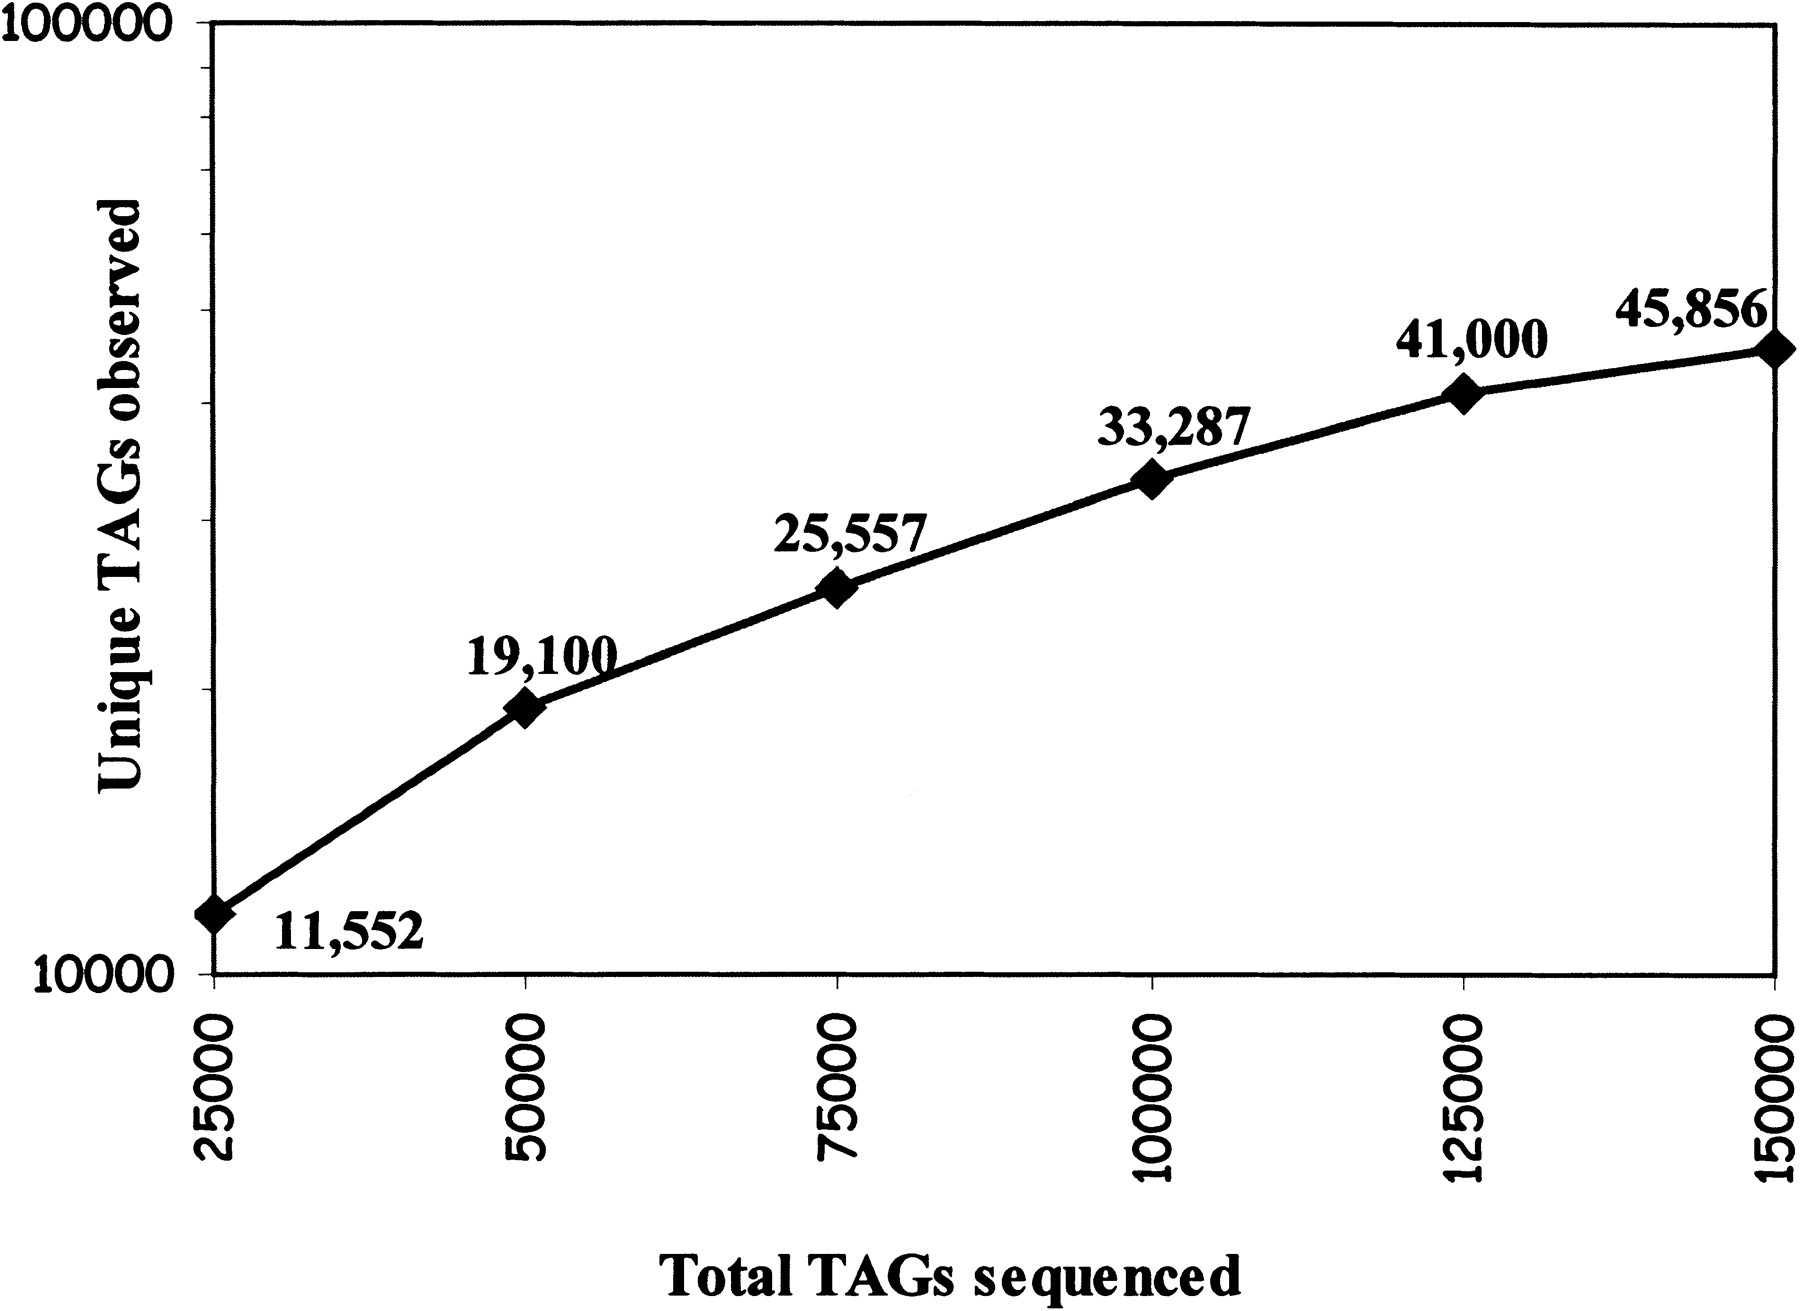
We have sequenced 54,599 tags from control male, 52,167 tags from control female, and 51,450 tags from Ts65Dn male mice SAGE libraries. After elimination of tags that are derived from linkers and duplicate ditags, we have obtained 51,561, 50,726, and 50,504 tags from these SAGE libraries, respectively. Thus the total number of tag sequences was 152,791, corresponding to 45,856 collected tags. SAGE analysis of yeast (Velculescu et al. 1997), for which the entire genome sequence is known, showed a sequencing error rate of ∼0.7% per base pair, which translates to a tag error rate of 6.8%; thus there are likely to be 42,738 unique tags represented by the 45,856 collected tags. As shown in Figure 1, we have not reached saturation in unique tag discovery. Indeed, in human colorectal cancer cell lines, unique tag discovery approached zero at ∼650,000 tags collected (Velculescu et al. 1999).
Cumulative curve of unique tag detection through sequencing of 152,791 tags from normal male and Ts65Dn male and normal female mice brain serial analysis of gene expression (SAGE) libraries. A total of 22,115, 21,357, and 19,103 unique tags were detected after sequencing 51,561, 50,504, and 50,726 tags from normal male, Ts65Dn male, and normal female mice brain SAGE libraries, respectively.
Expression levels of mouse genes ranging from two to 5252 transcript copies per cell were observed. Thirty-three transcripts expressed at >500 copies per cell comprised 11% of the cellular mRNA mass and the 748 most highly expressed genes accounted for 37% of the cellular mRNA content (Table 1). Most unique transcripts were expressed at levels equal to or fewer than five copies per cell, with 28% of the mRNA mass comprising 81% of the unique transcripts expressed. The tags matched ∼4000 known genes (there are ∼6000 mouse mRNA sequences in GenBank) and ∼10,000 expressed sequence tag (EST) clusters with unknown functions (out of ∼70,000 mouse UniGene clusters), whereas the remaining transcript tags (76%), mainly among the genes with low expression levels, had no matches in public databases (Table 1).
Comparison of Results of Mouse Brain and Human Transcriptome
| Copies/cell | Mouse brain transcriptome | Human transcriptome (Velculescu et al. 1999) | |||||
| N (% of total) | % of cellular transcripts | N (% of total) | % of cellular transcripts | ||||
| >500 | Unique TAGs | 33 (0.07%) | 11% | 55 (0.04%) | 18% | ||
| GenBank matches | 26 (78%) | 55 (100%) | |||||
| 50–500 | Unique TAGs | 709 (1.55%) | 26% | 578 (0.43%) | 27% | ||
| GenBank matches | 587 (82%) | 576 (99%) | |||||
| 50–50 | Unique TAGs | 7,821 (17%) | 34% | 6,160 (4.6%) | 30% | ||
| GenBank matches | 3,548 (48%) | 5,913 (96%) | |||||
| ≤5 | Unique TAGs | 37,293 (81%) | 28% | 127,342 (94.9%) | 25% | ||
| GenBank matches | 6,927 (18%) | 66,091 (52%) | |||||
| Total collected TAGs | 45,856 | 100% | 134,135 | 100% | |||
| GenBank matches | 11,088 (24%) | 72,635 (54%) | |||||
[i] Tags were distributed according to their copy number per cell into four categories: >500 copies, 50–500 copies, 5–50 copies, and ≤5 copies per cell (on estimate of 300,000 total transcripts per “average cell” was used). The number of unique transcripts/tags and the corresponding GenBank matches are shown for each category. The percentage of total cellular transcripts contributed by each category is also shown.
A human SAGE transcriptome derived from 3.5 million transcripts from 19 normal and diseased tissue types was recently published (Velculescu et al. 1999). Comparison of the data between the human and mouse transcriptome shows a similar percentage of cellular transcripts in the various classes of abundance of unique tags (Table 1). Comparison of the 15 most abundant mouse brain transcripts with human brain SAGE data (Velculescu et al. 1999) generally revealed similar levels of expression and identities (Table 2).
Comparison of the 15 Most Expressed Tags in the Mouse Brain Transcriptome
| TAG sequence | Mouse UniGene no. | pA signal | Human UniGene no. | Mouse gene description | No. of mice TAGs | No. of human TAGs | |||||||||
| G | T | G | G | C | T | C | A | C | A | 4184 | Yes | Multiple matches | 2626 | ||
| G | C | T | T | C | G | T | C | C | A | 2992 | Yes | 69547 | Myelin basic protein | 1013 | 261 |
| A | G | C | A | G | T | C | C | C | C | 3776 | No | TAG matches mitochondrial sequence | 870 | ||
| T | C | A | G | G | C | T | G | C | C | 1776 | Yes | 62954 | Ferritin heavy chain | 573 | 440 |
| G | C | A | C | A | A | C | T | T | G | 18041 | No | Multiple matches | 554 | ||
| G | T | G | A | C | C | T | G | G | C | 1008 | Yes | 8272 | Prostaglandin D2 synthase (21 kD, brain) | 496 | 282 |
| G | C | C | T | C | C | A | A | G | G | 5289 | Yes | 195188 | Glyceraldehyde-3-phosphate dehydrogenase | 490 | 302 |
| A | A | A | A | A | A | A | A | A | A | 15295 | Yes | Multiple matches | 481 | ||
| G | A | G | C | G | T | T | T | T | G | 5246 | Yes | 182937 | Peptidyl-prolycis-trans isomerase A | 475 | 142 |
| C | A | A | A | C | C | T | C | C | A | 28177 | No | TAG matches mitochondrial sequence | 400 | ||
| C | A | T | C | G | C | C | A | G | T | 21417 | Yes | 169401 | Apolipoprotein E | 397 | 191 |
| A | G | C | A | A | T | T | C | A | A | 30071 | No | TAG matches mitochondrial sequence | 390 | ||
| A | A | T | T | C | G | C | G | G | A | No match | 375 | ||||
| C | C | T | T | G | C | T | C | A | A | 43036 | Yes | 135084 | Cystatin C | 347 | 274 |
| T | G | A | C | C | C | C | G | G | G | 43766 | Yes | Ubiquitin/60s ribosomal fusion protein | 333 | ||
[i] The corresponding mRNA to each tag has been determined when possible. The human homolog for most of these was determined using UniGene searches. For each mouse tag sequence the numbers of detected copies in ∼150,000 tags from mouse brain SAGE libraries (No. of mice tags) are shown. The presence of polyadenylation signal in the corresponding mouse UniGene entry (Mouse UniGene no.) was noted (pA signal). The corresponding human transcript was obtained from the human UniGene library (Human UniGene no.) and the number of tags representing this transcript in 150,000 tags from human brain SAGE library was determined (No. of human tags). Mouse transcripts with known poly(A) signal for which the homolog was detected in the human brain transcriptome are shaded in gray.
Detection of Tags that Are Over- or Underrepresented in Ts65Dn Male SAGE Library
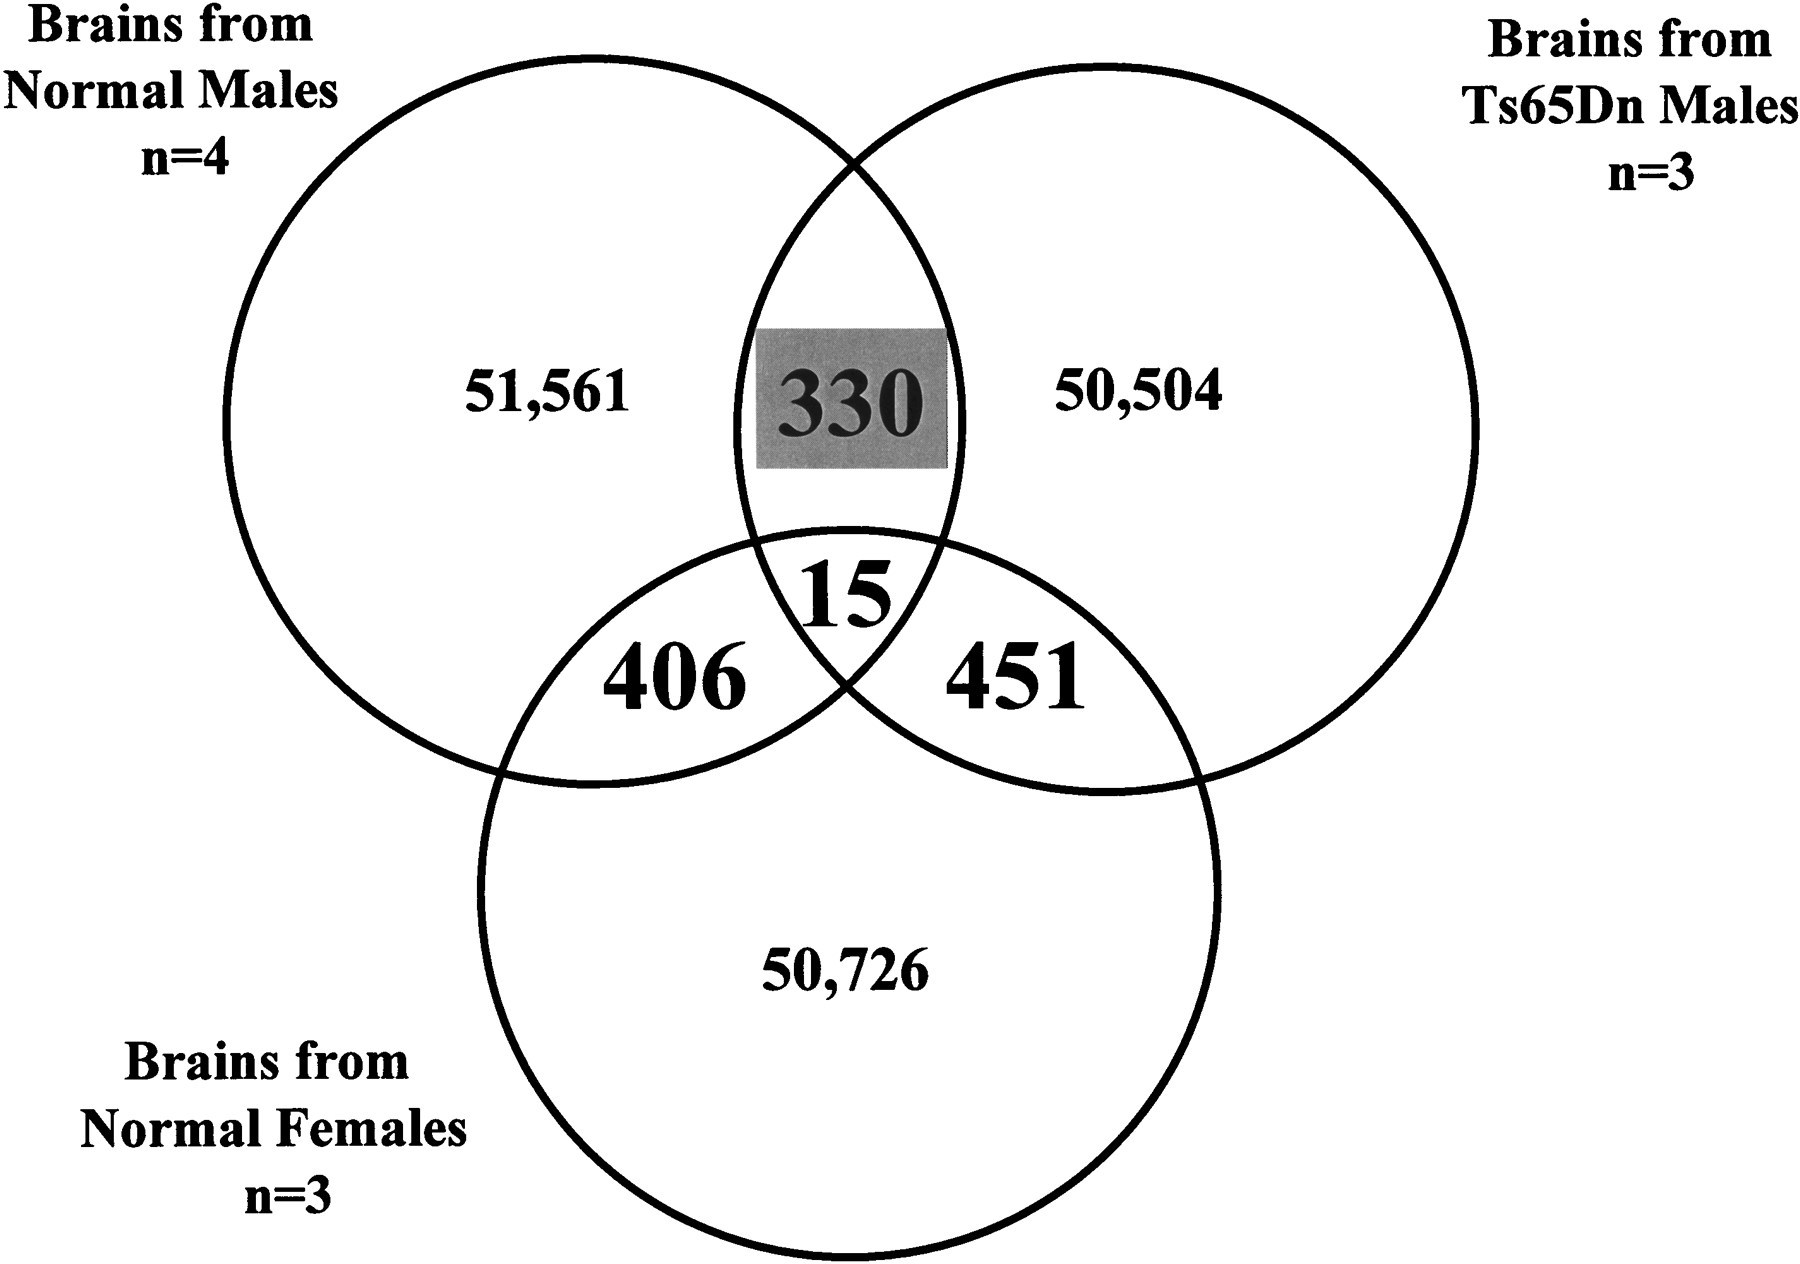
To detect tags that are specifically over- or underrepresented in Ts65Dn male SAGE library, we have compared the individual number of tags in all three libraries (normal males, normal females, and Ts65Dn males) using SAGE analysis software. This analysis revealed 330 statistically significant differences (P < 0.05) between normal males and Ts65Dn males, 406 differences between normal males and normal females, and 451 differences between normal females and Ts65Dn males (Figure 2). There were 15 tags with statistically significant differences in common to all comparisons, which were excluded from further analysis. We have focused on the 330 tags that were detected after comparison of normal and Ts65Dn male libraries (Figure 3). These differences may be a result of the third copy of part of chromosome 16 that is present in the Ts65Dn mice and not the result of the presence or absence of either the Y chromosome or the second copy of the X chromosome (normal male vs. female and normal female vs. Ts65Dn male differences).
Comparison of ∼50,000 tags isolated from serial analysis of gene expression (SAGE) libraries prepared from four normal male, three Ts65Dn male, and three normal female P30 mice brains. We have detected 330 tags with statistically significant differences (P ≤ 0.05) between normal and Ts65Dn male SAGE libraries, 406 differences between normal male and female SAGE libraries, and 451 differences between Ts65Dn male and normal female SAGE libraries. The complete list of tags that are overrepresented in each sample can be found in the web addresshttp://medgen.unige.ch/research/projects/SAGE/.
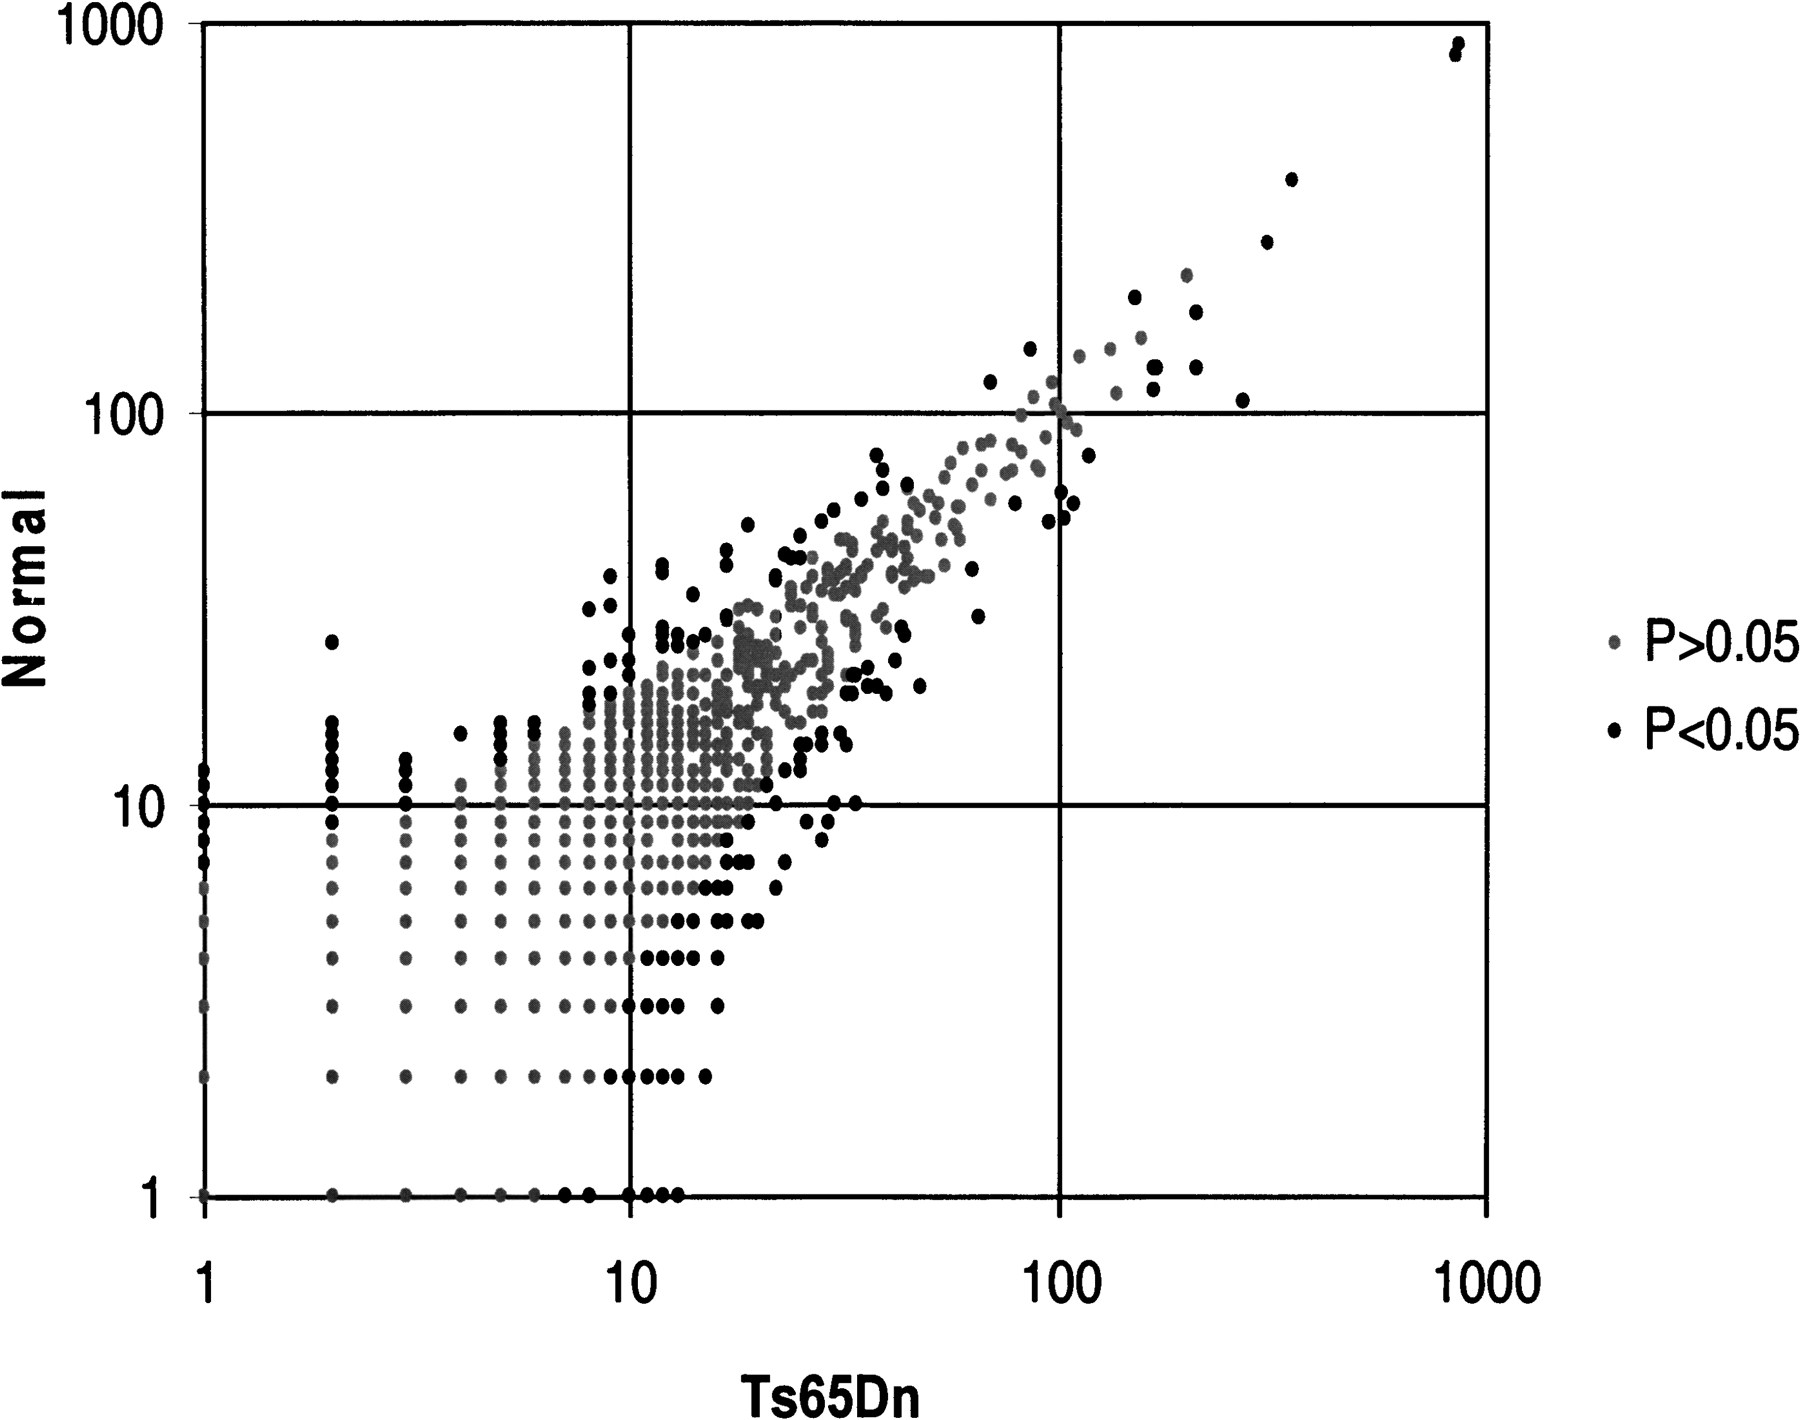
Comparison of the observed frequencies of 36,012 unique tags detected after sequencing of ∼51,000 tags from each normal and Ts56Dn mouse serial analysis of gene expression (SAGE) libraries. The vast majority of the tags were expressed at the same or similar level in the two samples (gray circles); however, there were 330 tags with statistically significant differences (P < 0.05) between normal and Ts56Dn mouse SAGE libraries (black circles).
330 Tag Differences between Ts65Dn and Normal Mouse Brains
Approximately one-half of the differentially expressed tags (161) are underrepresented and one-half are overrepresented (169) in Ts65Dn male compared to normal male SAGE libraries. Of the 330 differences, 112 tags matched known genes, 133 matched ESTs, and 85 were unknown (Table3; more recent update available athttp://medgen.unige.ch/research/projects.html). We have attempted to organize the 112 differentially expressed tags that match known genes into categories according to their biological function. However, no category including cell cycle, ion channels, apoptosis, DNA synthesis, transcription factors, growth factors, receptors, neurotransmitters, and cytoskeleton was overrepresented. It was shown that apoptosis is responsible for accelerated neuronal death in cultured Ts16 hippocampal neurons (Bambrick and Krueger 1999). Using all apoptosis-related entries by searching functional annotations in SwissProt (http://www.expasy.ch/srs5/) and the Clontech mouse Atlas array database (http://www.clontech.com/archive/JAN98UPD/Atlaslist.html), we have detected only one differentially expressed gene, the clusterin (GenBank accession no. L08235), which was present by 77 tags in normal male and 38 tags in Ts65Dn male SAGE libraries. The group of ribosomal proteins merits further attention. Among the 245 tags that are homologous with genes and ESTs that are differentially expressed (P < 0.05) between normal male and Ts65Dn male brains, there are 14 ribosomal protein genes that are differentially expressed in the two groups (nine underexpressed and five overexpressed; Table4).
Portion of the List of the 330 Tags with Statistically Significant Differences Between Normal and Ts 65 Dn Male Drain SAGE Libraries
| TAG sequence | Ts65Dn | Normal | P | GenBank match | |||||||||
| T | C | C | C | C | G | C | A | C | A | 2 | 26 | 0.0000 | No match |
| A | A | A | T | T | A | T | T | G | G | 110 | 59 | 0.0000 | Proteolipid protein (myeline) |
| G | C | C | C | C | C | C | T | C | T | 104 | 54 | 0.0000 | No match |
| T | C | C | C | C | G | A | C | A | T | 9 | 38 | 0.0000 | No match |
| T | T | G | G | T | G | A | A | G | G | 19 | 52 | 0.0001 | Prothymosin β-4 |
| G | A | C | T | G | A | A | T | C | T | 12 | 39 | 0.0001 | Multiple matches |
| C | G | C | C | C | G | C | C | C | G | 65 | 30 | 0.0002 | Map1b |
| A | T | T | T | T | C | G | A | G | G | 34 | 10 | 0.0002 | ATPase, Na+K+ transporting β 1 polypeptide, Atp1b1 |
| A | A | T | T | C | G | C | G | G | A | 86 | 144 | 0.0002 | No match |
| T | C | C | C | C | G | T | A | C | G | 8 | 31 | 0.0002 | No match |
| G | A | A | A | G | T | T | G | G | C | 95 | 53 | 0.0002 | Apolipoprotein D |
| T | C | T | C | C | A | G | G | C | G | 38 | 77 | 0.0003 | Clusterin |
| C | T | G | C | T | A | T | C | C | G | 9 | 32 | 0.0003 | Ribosomal protein L5, 3′ end |
| A | A | C | G | G | G | A | G | G | T | 48 | 20 | 0.0003 | Scgn10 like-protein |
| C | A | G | C | T | C | T | G | C | C | 70 | 119 | 0.0004 | ESTs, weakly similar to NEUROGRANIN (Rattus norvegicus) |
| G | A | C | A | A | C | G | C | C | A | 17 | 44 | 0.0004 | ESTs, highly similar to ATP SYNTHASE γ CHAIN, MITOCHONDRIAL (R. norvegicus) |
| G | T | G | A | C | C | T | G | G | C | 169 | 115 | 0.0004 | Prostaglandin D2 synthase (21 kD, brain) |
| A | G | G | A | C | A | A | A | T | A | 102 | 62 | 0.0007 | Biotinidase |
| T | C | C | C | C | G | T | A | A | T | 2 | 16 | 0.0007 | No match |
| C | G | C | G | C | T | C | T | C | T | 29 | 9 | 0.0008 | No match |
| C | T | G | C | T | G | G | T | G | G | 30 | 10 | 0.0009 | GTP-binding protein associated protein 1 |
| G | C | C | A | T | C | C | C | G | G | 13 | 1 | 0.0009 | No match |
| C | A | G | G | T | G | A | G | C | C | 15 | 2 | 0.0010 | No match |
| C | G | C | A | G | T | C | C | C | C | 0 | 10 | 0.0010 | No match |
| T | C | G | G | C | G | T | G | G | A | 0 | 10 | 0.0010 | No match |
| G | T | T | G | C | T | G | A | G | A | 17 | 41 | 0.0014 | 24.6-kD protein (M93980) |
| G | A | C | G | G | C | T | A | A | A | 2 | 15 | 0.0015 | No match |
| T | C | C | C | C | C | G | T | A | C | 2 | 15 | 0.0015 | No match |
| T | T | T | T | G | A | G | T | G | A | 12 | 1 | 0.0016 | No match |
| G | C | G | C | C | A | G | C | T | C | 118 | 78 | 0.0016 | Ubiqutin C-terminal hydrolase L1 |
| A | A | A | C | G | A | A | A | G | T | 22 | 6 | 0.0017 | ESTs, highly similar to S-ADENOSYLMETHIONINE SYNTHETASE γ form (R. norvegicus) |
| G | C | G | G | G | C | A | C | C | A | 20 | 5 | 0.0017 | ESTs |
| A | C | A | G | G | A | A | G | G | A | 1 | 12 | 0.0018 | No match |
| A | C | T | T | C | G | T | C | C | A | 0 | 9 | 0.0019 | No match |
| G | A | G | T | C | A | C | T | C | T | 0 | 9 | 0.0019 | ESTs |
| G | C | G | G | G | T | C | G | C | C | 16 | 3 | 0.0020 | No match |
| G | G | G | A | C | C | T | A | G | G | 23 | 7 | 0.0023 | Neuron-specific gene family member 2 |
| G | T | C | T | G | G | G | G | G | G | 2 | 14 | 0.0024 | Monoglyceride lipase |
| G | C | T | A | T | G | A | G | A | A | 26 | 9 | 0.0024 | Amyloid β (A4) precursor-like protein 1 |
| C | C | C | A | G | A | T | A | T | T | 19 | 5 | 0.0028 | Tubulin, β-4 |
| G | T | G | G | C | A | G | G | C | G | 11 | 1 | 0.0029 | No match |
| G | T | G | T | G | C | C | C | C | C | 11 | 1 | 0.0029 | ESTs, highly similar to HYPOTHETICAL 67.8-kD PROTEIN in GND1-ERG9 INTERGENIC REGIONS (Saccharomyces cerevisiae) |
| G | C | T | T | T | T | G | G | G | A | 13 | 2 | 0.0034 | No match |
| T | G | T | A | G | T | G | T | A | A | 8 | 0 | 0.0035 | Ribosomal protein S8 |
| C | C | G | C | C | T | G | T | G | G | 14 | 34 | 0.0036 | Synapsin I |
| T | C | C | C | C | G | T | G | C | A | 2 | 13 | 0.0039 | No match |
| T | C | T | G | G | T | C | C | G | G | 1 | 11 | 0.0041 | Flotillin 2 |
| G | C | A | G | A | G | T | G | C | G | 32 | 14 | 0.0044 | Multiple matches |
| C | C | G | C | C | G | T | G | G | G | 0 | 8 | 0.0044 | Microtubule-associated protein 7 |
| G | T | T | G | T | G | A | T | T | T | 0 | 8 | 0.0044 | Ewing sarcoma homolog |
| T | G | A | G | C | A | C | T | C | C | 0 | 8 | 0.0044 | Follistatin-like |
| C | C | T | T | A | C | C | G | C | T | 30 | 56 | 0.0046 | ESTs |
| T | C | C | G | T | G | G | T | T | G | 28 | 53 | 0.0049 | ESTs, moderately similar to BIOTIN CARBOXYLASE (Anabaena pcc7120) |
| T | T | C | T | G | G | C | C | T | G | 10 | 27 | 0.0050 | ESTs, highly similar to EST00098 protein (Homo sapiens) |
| G | A | G | A | G | A | A | G | A | G | 10 | 1 | 0.0051 | Microtubule-associated protein τ |
| G | G | G | C | A | G | G | G | A | G | 10 | 1 | 0.0051 | ESTs |
| G | T | T | T | G | C | T | G | T | G | 16 | 4 | 0.0053 | Cathepsin B |
| G | C | G | G | G | T | T | C | G | C | 12 | 2 | 0.0062 | No match |
| T | G | G | T | G | C | A | C | G | T | 12 | 2 | 0.0062 | ESTs, weakly similar to similar to kinensin-like protein (Caenorhabditis elegans) |
| A | T | G | A | A | T | T | T | T | G | 1 | 10 | 0.0065 | ESTs, highly similar to CELL DIVISION CONTROL PROTEIN 4 (S. cerevisiae) |
| C | C | A | T | T | G | A | T | C | A | 1 | 10 | 0.0065 | ESTs, highly similar to bithoraxoid-like protein (R. norvegicus) |
| C | G | G | A | T | A | A | C | C | A | 1 | 10 | 0.0065 | Proliferation-associated protein 1 |
| G | C | T | T | G | T | G | A | C | G | 1 | 10 | 0.0065 | Transaldolase 1 |
| T | T | A | C | A | G | C | A | G | A | 1 | 10 | 0.0065 | ESTs, weakly similar to ORF YGL231c (S. cerevisiae) |
| T | G | C | A | G | T | C | C | C | C | 2 | 12 | 0.0065 | No match |
| C | C | C | C | A | G | C | C | A | G | 25 | 48 | 0.0065 | Ribosomal protein S3 |
| A | T | T | G | C | T | T | A | G | A | 7 | 0 | 0.0070 | RNA-binding motif protein 3 |
| C | A | G | T | A | A | C | T | T | C | 7 | 0 | 0.0070 | Aquaporin 4 |
| C | C | C | C | G | C | C | G | C | G | 7 | 0 | 0.0070 | Zinc finger protein, multitype 1 |
| C | C | C | C | T | C | C | C | C | A | 7 | 0 | 0.0070 | No match |
| G | G | C | C | T | T | T | G | T | G | 7 | 0 | 0.0070 | ESTs, weakly similar to coded for by C. elegans cDNA CEESW58F |
| G | G | A | T | A | C | G | T | T | T | 17 | 5 | 0.0075 | ESTs |
| G | G | C | G | G | G | G | C | C | C | 17 | 5 | 0.0075 | ESTs, weakly similar to 230K bullous pemphigoid antigen BPM1 (Mus musculus) |
| A | A | T | C | A | C | T | G | G | C | 0 | 7 | 0.0082 | ESTs, moderately similar to protein DS 1, 24K (H. sapiens) |
| C | G | A | C | C | C | C | G | G | G | 0 | 7 | 0.0082 | No match |
| C | T | A | A | C | C | T | C | C | A | 0 | 7 | 0.0082 | No match |
| G | T | G | T | T | G | T | C | G | G | 0 | 7 | 0.0082 | ESTs, weakly similar to S1-1 protein (R. norvegicus) |
| T | A | A | G | C | A | G | G | A | C | 0 | 7 | 0.0082 | No match |
| C | G | C | T | G | G | T | T | C | C | 35 | 60 | 0.0087 | Replication factor C, 140 kd |
| A | A | C | T | G | C | A | C | A | C | 13 | 3 | 0.0096 | ESTs, highly similar to SUCCINATE DEHYDROGENASE (H. sapiens) |
| G | G | G | T | C | C | T | G | C | T | 8 | 22 | 0.0097 | ESTs |
| C | G | C | G | G | C | A | G | G | C | 38 | 20 | 0.0104 | Dynactin 1 |
| C | A | G | G | A | C | T | C | C | G | 63 | 40 | 0.0106 | Stearoyl-Coenzyme A desaturase 2 |
| C | T | C | T | T | C | C | C | C | C | 42 | 23 | 0.0110 | Phosphatidylethanolamine-binding mRNA, complete cds |
| T | C | C | C | C | G | T | A | C | T | 4 | 15 | 0.0111 | No match |
| A | C | C | A | A | G | A | T | C | T | 3 | 13 | 0.0112 | Ribosomal protein S19 |
| A | T | G | G | G | T | C | A | T | C | 3 | 13 | 0.0112 | ESTs, highly similar to TRANSLOCATION PROTEIN SEC62 (S. cerevisiae) |
| T | C | T | G | C | C | C | T | C | C | 3 | 13 | 0.0112 | No match |
| G | A | T | T | C | C | G | T | G | A | 39 | 64 | 0.0113 | ESTs, highly similar to 60S RIBOSOMAL PROTEIN L37 (H. sapiens; R. norvegicus) |
| G | C | C | A | A | A | A | A | A | A | 1 | 9 | 0.0113 | ESTs, highly similar to 2-OXOGLUTARATE DEHYDROGENASE E1 COMPONENT PRECURSOR (H. sapiens) |
| G | G | C | T | T | T | G | G | A | G | 1 | 9 | 0.0113 | ESTs, moderately similar to HSPC005 (H. sapiens) |
| A | C | T | C | G | G | A | G | C | C | 23 | 43 | 0.0114 | Calmodulin |
| C | A | A | A | C | T | G | A | A | G | 2 | 11 | 0.0114 | ESTs, highly similar to spliceosomal protein SAP 155 (H. sapiens) |
| C | A | C | T | A | C | A | C | G | G | 2 | 11 | 0.0114 | FK506-binding protein 2 (13 kD) |
| G | G | G | G | C | T | C | A | G | C | 31 | 15 | 0.0115 | Glucose phosphate isomerase 1 complex |
| G | T | A | C | T | G | A | C | A | T | 9 | 23 | 0.0116 | No match |
| G | C | A | G | C | A | T | C | T | G | 16 | 5 | 0.0118 | ESTs |
| C | T | G | G | C | A | G | A | A | G | 11 | 2 | 0.0125 | ESTs, highly similar to NIFU PROTEIN [Anabaena pcc7120] |
| T | C | T | G | G | A | G | A | C | A | 11 | 2 | 0.015 | No match |
| A | G | A | G | C | T | G | T | G | G | 14 | 4 | 0.0132 | NADH dehydrogenase flavoprotein 1 |
| G | T | G | T | G | T | G | G | T | G | 19 | 7 | 0.0134 | ESTs |
| T | G | A | G | A | A | C | T | G | C | 19 | 7 | 0.0134 | Tetratricopeptide repeat domain |
| T | C | A | G | G | C | T | G | C | C | 153 | 199 | 0.0135 | Ferritin heavy chain |
| G | T | G | T | G | C | C | G | C | T | 17 | 6 | 0.0144 | No match |
| A | A | G | C | T | C | A | G | T | T | 5 | 16 | 0.0146 | ESTs |
| C | C | A | C | A | G | A | G | C | T | 5 | 16 | 0.0146 | Ena-vasodilator stimulated phosphoprotein |
| A | A | A | G | T | T | C | G | G | A | 6 | 0 | 0.0147 | sid23p |
| A | T | G | C | A | A | C | T | A | C | 13 | 27 | 0.0211 | ESTs, highly similar to CYTOCHROME C OXIDASE POLYPEPTIDE VIB (Bos taurus) |
| T | G | G | G | G | T | T | T | C | C | 44 | 27 | 0.0214 | Multiple matches |
| G | G | G | A | G | C | G | G | G | C | 22 | 10 | 0.0217 | ESTs, Highly similar to HYPOTHETICAL 109.5 kD PROTEIN IN PPA1-DAP2 INTERGENIC REGION (S. cerevisiae) |
| T | A | A | C | A | G | T | T | G | T | 13 | 4 | 0.0219 | Calnexin |
| A | G | A | G | A | G | G | C | C | A | 1 | 8 | 0.0226 | ESTs, weakly similar to PROFLIN I (M. musculus) |
| A | G | G | C | A | T | T | G | T | C | 1 | 8 | 0.0226 | ESTs |
| C | A | T | C | A | G | C | C | T | C | 1 | 8 | 0.0226 | Multiple matches |
| C | C | C | A | G | G | C | T | T | G | 1 | 8 | 0.0226 | ESTs |
| G | A | C | T | C | T | T | T | C | T | 1 | 8 | 0.0226 | ESTs |
| G | G | C | C | T | C | T | A | A | A | 1 | 8 | 0.0226 | ESTs |
| T | G | C | T | G | G | T | G | C | G | 1 | 8 | 0.0226 | ESTs |
| G | G | C | A | G | T | C | C | C | C | 5 | 15 | 0.0228 | ESTS |
| T | T | G | G | C | T | C | A | C | A | 5 | 15 | 0.0228 | ESTs |
| G | A | A | T | T | T | T | T | A | C | 16 | 6 | 0.0253 | No match |
| G | G | G | C | A | A | G | C | C | A | 17 | 7 | 0.0268 | Estrogen related receptor, α |
| T | G | G | C | T | T | T | T | C | T | 28 | 15 | 0.0277 | Multiple matches |
| A | T | C | C | T | A | G | G | T | C | 11 | 3 | 0.0277 | No match |
| C | A | G | A | C | G | G | A | A | G | 11 | 3 | 0.0277 | ESTs |
| G | G | G | A | A | A | A | C | T | T | 11 | 3 | 0.0277 | No match |
| G | T | C | G | G | C | C | G | C | C | 11 | 3 | 0.0277 | M. musculus DNase1 precursor mRNA, complete cds |
| G | G | G | A | T | G | G | C | C | A | 8 | 19 | 0.0287 | ESTs |
| A | A | T | A | T | G | T | G | T | G | 6 | 16 | 0.0298 | Cytochrome c oxidase, subunit Vlc |
| A | A | C | G | C | T | G | C | C | A | 25 | 42 | 0.0299 | Macrophage migration inhibitory factor |
| A | A | C | G | G | C | T | A | A | C | 5 | 0 | 0.0302 | No match |
| A | A | C | T | A | T | T | A | A | A | 5 | 0 | 0.0302 | ESTs |
| A | A | G | A | G | A | A | C | C | C | 5 | 0 | 0.0302 | No match |
| A | A | G | C | A | C | T | G | T | G | 5 | 0 | 0.0302 | ESTs |
| A | A | G | T | T | G | C | A | T | T | 5 | 0 | 0.0302 | NUCLEOSOME ASSEMBLY PROTEIN 1-LIKE 1 |
| A | C | C | T | T | G | C | C | C | T | 5 | 0 | 0.0302 | ESTs, highly similar to TRANSLOCON-ASSOCIATED PROTEIN, β SUBUNIT PRECURSOR (H. sapiens) |
| A | C | T | C | C | C | C | A | G | A | 5 | 0 | 0.0302 | No match |
| C | A | A | A | T | C | C | T | G | T | 5 | 0 | 0.0302 | No match |
| C | C | A | A | C | A | A | C | T | G | 5 | 0 | 0.0302 | No match |
| C | C | C | A | G | G | C | T | G | A | 5 | 0 | 0.0302 | ESTS |
| C | C | C | T | T | G | A | G | T | C | 5 | 0 | 0.0302 | No match |
| C | C | T | T | T | C | A | A | A | A | 5 | 0 | 0.0302 | General transcription factor II I |
| C | C | T | T | T | C | A | A | A | C | 5 | 0 | 0.0302 | ESTs, highly similar to similar to nuclear domain 10 protein NDP52 (H. sapiens) |
| C | T | G | C | A | T | T | A | A | G | 5 | 0 | 0.0302 | ESTs, highly similar to enoyl-CoA hydratase (H. sapiens) |
| C | T | T | G | C | A | A | T | C | T | 5 | 0 | 0.0302 | ESTs, weakly similar to HORMONE SENSITIVE LIPASE (M. musculus) |
| C | T | T | T | G | G | G | G | G | C | 5 | 0 | 0.0302 | ESTs |
| C | T | T | T | T | C | A | G | C | A | 5 | 0 | 0.0302 | No match |
| G | A | A | A | G | G | T | C | A | G | 5 | 0 | 0.0302 | ESTs |
| G | A | A | C | A | G | G | A | C | C | 5 | 0 | 0.0302 | ESTs |
| G | A | C | A | A | A | A | A | A | A | 5 | 0 | 0.0302 | ESTs |
| G | A | T | A | A | T | G | C | A | C | 5 | 0 | 0.0302 | NADH dehydrogenase (ubiquinone) Fe-S protein 4 (18 kD) |
| G | C | A | C | A | C | A | C | C | C | 5 | 0 | 0.0302 | EST |
| G | C | C | T | G | T | C | T | T | C | 5 | 0 | 0.0302 | ESTs |
| G | G | A | A | T | T | T | T | T | A | 5 | 0 | 0.0302 | ESTs |
| G | G | G | G | C | T | A | T | C | G | 5 | 0 | 0.0302 | No match |
| G | G | G | G | G | C | G | C | G | C | 5 | 0 | 0.0302 | No match |
| G | T | G | T | A | G | A | C | C | A | 5 | 0 | 0.0302 | ESTS |
| T | A | G | T | G | T | T | T | T | C | 5 | 0 | 0.0302 | No match |
| T | C | A | A | A | C | T | G | C | C | 5 | 0 | 0.0302 | No match |
| T | C | A | T | C | T | T | T | A | A | 5 | 0 | 0.0302 | Calreticulin |
| T | C | C | T | C | A | C | G | T | G | 5 | 0 | 0.0302 | Pyruvate dehydrogenase 2 |
| T | C | T | T | T | A | A | T | C | C | 5 | 0 | 0.0302 | ESTs |
| A | A | G | C | C | A | C | A | G | A | 6 | 0 | 0.0147 | ESTs, moderately similar to PUTATIVE SURFACE GLYCOPROTEIN C21ORF1 PRECURSOR (H. sapiens) |
| A | G | C | A | G | C | C | C | C | T | 6 | 0 | 0.0147 | No match |
| C | A | C | T | G | G | G | T | T | G | 6 | 0 | 0.0147 | ESTs, highly similar to unknown (H. sapiens) |
| C | G | G | A | C | G | G | C | T | T | 6 | 0 | 0.0147 | No match |
| G | G | G | A | T | T | C | C | A | G | 6 | 0 | 0.0147 | No match |
| G | G | T | T | C | T | G | C | C | C | 6 | 0 | 0.0147 | ESTs |
| T | A | G | T | G | G | C | G | T | A | 6 | 0 | 0.0147 | α-internexin neuronal intermediate filament protein |
| T | G | A | G | C | C | T | G | G | T | 6 | 0 | 0.0147 | Latent transforming growth factor β binding protein 3 |
| T | G | G | A | G | A | A | C | T | A | 6 | 0 | 0.0147 | ESTS |
| T | G | G | C | C | A | A | G | C | C | 6 | 0 | 0.0147 | Polyhomeotic (mPh2) mRNA |
| T | G | T | T | C | T | T | C | C | C | 6 | 0 | 0.0147 | No match |
| T | T | T | G | T | G | A | C | T | G | 6 | 0 | 0.0147 | C-terminal–binding protein 1 |
| G | C | C | T | T | T | A | T | G | A | 12 | 27 | 0.0155 | Ribosomal protein S24 |
| T | C | C | G | G | G | C | G | A | G | 12 | 3 | 0.0163 | Replication-dependent histone H2A.1 gene |
| G | A | A | C | T | T | G | C | A | A | 18 | 7 | 0.0175 | ESTs, moderately similar to FARNESYL PYROPHOSPHATE SYNTHETASE (R. norvegicus) |
| C | G | T | C | T | G | T | G | A | A | 10 | 2 | 0.0175 | No match |
| G | G | C | C | C | C | A | A | A | C | 10 | 2 | 0.0175 | V-crk-associated tyrosine kinase substrate |
| A | A | C | G | T | T | G | G | A | A | 0 | 6 | 0.0183 | ESTs, weakly similar to cytosolic inorganic pyrophosphatase (H. sapiens) |
| A | A | C | T | T | G | G | C | T | G | 0 | 6 | 0.0183 | Guanylate kinase membrane-associated inverted 1 |
| A | A | G | C | T | G | C | C | C | T | 0 | 6 | 0.0183 | ORNITHINE AMINOTRANSFERASE PRECURSOR |
| A | G | C | C | C | A | T | C | A | A | 0 | 6 | 0.0183 | ESTs |
| A | G | G | A | G | G | G | G | T | A | 0 | 6 | 0.0183 | RAB24, member RAS oncogene family |
| A | T | T | C | T | G | G | C | A | G | 0 | 6 | 0.0183 | ESTs, highly similar to UBIQUITIN-CONJUGATING ENZYME E2-17 KD 3 (H. sapiens; R. norvegicus) |
| C | C | G | A | A | T | T | A | C | C | 0 | 6 | 0.0183 | Cornichon homolog (Drosophila) |
| C | C | T | G | T | A | A | T | C | C | 0 | 6 | 0.0183 | ESTs |
| C | G | G | C | C | T | A | C | G | T | 0 | 6 | 0.0183 | Superoxide dismutase 2, mitochondrial |
| G | G | C | A | G | A | C | T | G | T | 0 | 6 | 0.0183 | EST |
| G | G | G | A | T | C | C | A | G | G | 0 | 6 | 0.0183 | ESTs, weakly similar to coded for by C. elegans cDNA yk157f8.5 |
| G | G | T | A | A | A | G | T | T | A | 0 | 6 | 0.0183 | ESTs, weakly similar to MITOCHONDRIAL ELONGATION FACTOR TS PRECURSOR (H. sapiens) |
| G | T | C | C | T | T | T | T | T | C | 0 | 6 | 0.0183 | ESTs, highly similar to ring-box protein 1 (M. musculus) |
| G | T | G | G | G | G | C | G | G | G | 0 | 6 | 0.0183 | ESTs |
| T | A | A | C | A | A | A | G | G | A | 0 | 6 | 0.0183 | ESTS |
| T | A | C | C | C | C | G | T | A | C | 0 | 6 | 0.0183 | No match |
| T | C | C | C | C | G | T | A | T | A | 0 | 6 | 0.0183 | No match |
| T | C | T | G | G | C | A | A | A | G | 0 | 6 | 0.0183 | EST |
| G | C | A | C | C | G | A | A | C | A | 28 | 14 | 0.0190 | sid23p |
| G | A | A | G | A | T | G | A | G | C | 36 | 20 | 0.0192 | RAB3A, member RAS oncogene family |
| C | A | A | A | A | A | T | A | A | A | 25 | 12 | 0.0197 | ESTs |
| G | A | G | A | T | G | C | C | T | G | 10 | 23 | 0.0205 | ESTs, highly similar to NADH-UBIQUINONE OXIDOREDUCTASE 42 kD SUBUNIT PRECURSOR (B. taurus) |
| A | C | G | T | C | G | T | G | C | G | 8 | 1 | 0.0206 | No match |
| C | C | T | T | T | C | T | G | T | C | 8 | 1 | 0.0206 | No match |
| C | T | T | T | G | G | G | G | A | C | 8 | 1 | 0.0206 | ESTS, Highly similar to Down syndrome candidate region 1 (H. sapiens) |
| G | C | A | G | G | C | T | T | C | G | 8 | 1 | 0.0206 | ESTs, weakly similar to HYPOTHETICAL 54.9 kD PROTEIN C02F5.7 IN CHROMOSOME III (C. elegans) |
| G | C | C | T | G | C | C | C | C | G | 8 | 1 | 0.02060 | cdc37 homolog |
| G | G | G | C | C | C | C | G | G | G | 8 | 1 | 0.0206 | Multiple matches |
| A | A | G | A | G | A | A | C | A | C | 2 | 10 | 0.0208 | No match |
| G | G | A | G | A | A | G | A | G | C | 2 | 10 | 0.0208 | No match |
| T | A | C | G | G | C | T | A | A | A | 2 | 10 | 0.0208 | No match |
| A | G | A | A | A | A | A | A | A | A | 3 | 12 | 0.0209 | Multiple matches |
| G | A | G | T | G | C | C | T | G | T | 3 | 12 | 0.0209 | ESTs |
| T | G | A | C | A | G | C | T | T | G | 5 | 0 | 0.0302 | ESTs |
| T | G | A | G | C | C | A | A | C | T | 5 | 0 | 0.0302 | ESTs |
| T | G | A | G | T | T | A | C | A | G | 5 | 0 | 0.0302 | Nucleosome assembly protein 1-like 2 |
| T | G | T | G | A | G | G | C | T | C | 5 | 0 | 0.0302 | No match |
| T | T | C | A | G | C | T | C | G | A | 33 | 19 | 0.0303 | Ribosomal protein S7 |
| C | C | G | C | C | A | A | G | G | G | 9 | 2 | 0.0320 | ESTs, moderately similar to hTOM34p (H. sapiens) |
| G | C | A | G | G | T | C | C | C | C | 9 | 2 | 0.0320 | ESTs |
| G | G | G | C | C | C | A | A | C | T | 9 | 2 | 0.0320 | EST |
| G | G | G | G | A | G | A | C | G | C | 9 | 2 | 0.0320 | Fibroblast growth factor receptor 1 |
| T | G | C | A | G | T | G | C | A | C | 9 | 2 | 0.0320 | ESTs |
| C | T | G | C | G | A | G | A | T | T | 25 | 13 | 0.0322 | ESTs, highly similary to NADH-UBIQUINONE DEHYDROGENASE 24-kD SUBUNIT PRECURSOR (R. norvegicus) |
| A | G | A | A | C | T | T | C | A | A | 7 | 1 | 0.0327 | No match |
| C | A | G | G | G | C | G | A | G | A | 7 | 1 | 0.0327 | ESTs, highly similar to hypothetical protein (H sapiens) |
| C | T | G | G | G | C | T | T | G | A | 7 | 1 | 0.0327 | No match |
| G | C | A | A | G | A | G | A | G | A | 7 | 1 | 0.0327 | Glutamine synthetase |
| G | C | C | C | T | G | G | C | C | C | 7 | 1 | 0.0327 | No match |
| G | G | A | T | C | C | C | C | A | A | 7 | 1 | 0.0327 | ESTs |
| T | C | C | A | A | C | T | C | C | T | 7 | 1 | 0.0327 | ESTs, weakly similar to weak similarity to Bascillus stearothemophilus. 30S ribosomal protein S21 (C. elegans) |
| T | G | A | A | C | C | C | A | T | T | 7 | 1 | 0.0327 | Cytochrome oxidase, subunit VIa, polypeptide 1 |
| T | G | G | A | G | G | A | G | C | T | 7 | 1 | 0.0327 | ESTs, highly similar to formin-binding protein 11 (M. musculus) |
| G | A | G | A | C | C | A | T | C | G | 3 | 11 | 0.0333 | ESTs, highly similar to (define not available 6013323< M. musculus) |
| G | C | G | A | G | G | A | A | G | A | 3 | 11 | 0.0333 | No match |
| G | G | G | G | A | A | A | T | C | G | 80 | 59 | 0.0341 | ESTs, Moderately similar to THYMOSIN β-10 (H. sapiens; R. norvegicus; Equus caballus) |
| C | C | A | G | G | C | C | G | G | G | 15 | 6 | 0.0347 | Protein kinase C, ζ |
| G | A | G | C | C | C | C | T | T | G | 15 | 6 | 0.0347 | No match |
| T | G | G | A | A | T | G | C | A | G | 15 | 6 | 0.0347 | Calnexin |
| A | G | T | T | G | G | A | A | A | C | 12 | 4 | 0.0356 | Nuclear factor of activated T-cells, cytoplasmic 2 |
| C | C | C | G | T | A | G | C | C | C | 12 | 4 | 0.0356 | Tropomyosin 2, β |
| G | C | G | C | C | C | T | G | A | T | 12 | 4 | 0.0356 | No match |
| G | G | C | A | C | C | A | T | C | T | 12 | 4 | 0.0356 | No match |
| T | A | C | C | C | C | A | G | G | G | 12 | 4 | 0.0356 | No match |
| T | T | G | A | T | C | C | C | C | A | 12 | 4 | 0.0356 | Lysosomal membrane glycoprotein 1 |
| G | G | G | G | C | A | G | C | C | C | 36 | 22 | 0.0357 | CornichonDrosophila-like |
| G | C | A | C | A | A | C | T | T | G | 213 | 181 | 0.0361 | Multiple matches |
| C | T | A | C | T | G | A | C | A | T | 2 | 9 | 0.0364 | No match |
| G | C | G | A | G | G | G | A | G | C | 2 | 9 | 0.0364 | Dim1 (S. pombe) |
| G | G | A | G | C | G | C | T | A | T | 2 | 9 | 0.0364 | ESTs |
| A | A | A | C | A | T | T | G | G | G | 0 | 5 | 0.0366 | ESTs, weakly similar to Similar to S. cerevisiae EMP70 protein precursor (H. sapiens) |
| A | C | A | A | C | A | A | A | A | T | 0 | 5 | 0.0366 | ESTs |
| A | C | C | C | G | C | A | C | C | C | 0 | 5 | 0.0366 | No match |
| A | C | T | C | T | T | T | C | C | T | 0 | 5 | 0.0366 | ESTs |
| A | C | T | G | T | G | T | C | T | T | 0 | 5 | 0.0366 | ESTs |
| A | G | A | G | G | C | A | C | T | T | 0 | 5 | 0.0366 | ESTs, highly similar to ACETYL-COENZYME A SYNTHETASE (Escherichia coli) |
| A | G | A | T | G | G | C | T | T | T | 0 | 5 | 0.0366 | Mast cell-growth factor |
| A | G | C | C | G | T | G | T | A | T | 0 | 5 | 0.0366 | ESTs |
| A | G | G | C | T | G | G | T | G | A | 0 | 5 | 0.0366 | Proteasome (prosome, macropain) subunit, β type 1 |
| C | A | A | A | T | G | G | A | C | T | 0 | 5 | 0.0366 | ESTs |
| C | A | C | A | G | C | G | T | T | G | 0 | 5 | 0.0366 | No match |
| C | A | C | T | T | T | T | T | T | T | 0 | 5 | 0.0366 | No match |
| C | C | A | A | G | G | C | T | G | C | 0 | 5 | 0.0366 | ESTs |
| C | G | G | G | A | C | C | C | C | A | 0 | 5 | 0.0366 | No match |
| C | T | A | G | T | C | G | C | A | A | 0 | 5 | 0.0366 | ESTs, highly similar to THYMIDINE PHOSPHORYLASE (H. sapiens) |
| C | T | G | T | G | T | A | A | T | T | 0 | 5 | 0.0366 | ESTs |
| G | A | A | A | C | C | A | G | G | A | 0 | 5 | 0.0366 | ESTS, weakly similar to PLATELET-ENDOTHELIAL TETRASPAN ANTIGEN 3 (M. musculus) |
| G | A | A | T | T | G | A | T | G | A | 0 | 5 | 0.0366 | Secretogranin II |
| G | A | T | C | T | G | A | C | C | C | 0 | 5 | 0.0366 | ESTs |
| G | C | C | A | C | G | C | C | C | T | 0 | 5 | 0.0366 | No match |
| G | C | T | T | A | A | A | A | A | T | 0 | 5 | 0.0366 | ESTS |
| G | G | A | A | G | T | T | G | G | C | 0 | 5 | 0.0366 | No match |
| G | G | G | A | A | G | A | G | A | T | 0 | 5 | 0.0366 | ESTs |
| G | G | T | A | C | C | C | C | C | A | 0 | 5 | 0.0366 | ESTs |
| G | T | T | T | T | C | T | A | G | T | 0 | 5 | 0.0366 | ESTs, highly similar to PRE-mRNA SPLICING HELICASE BRR2 (S. cerevisiae) |
| T | A | G | A | C | C | A | G | G | C | 0 | 5 | 0.0366 | ESTs, weakly similar to VITAMIN K-DEPENDENT γ-CARBOXYLASE (H. sapiens) |
| T | A | T | G | T | C | A | A | G | T | 0 | 5 | 0.0366 | No match |
| T | C | C | A | G | A | A | A | A | T | 0 | 5 | 0.0366 | No match |
| T | C | C | C | C | G | T | T | C | A | 0 | 5 | 0.0366 | No match |
| T | G | A | A | C | T | G | T | G | T | 0 | 5 | 0.0366 | ESTs |
| T | G | G | A | T | G | C | T | G | G | 0 | 5 | 0.0366 | Adenomatosis polyposis coli binding protein Eb1 |
| T | G | G | G | C | C | A | C | A | C | 0 | 5 | 0.0366 | ESTs, weakly similar to KIAA0990 protein (H. sapiens) |
| T | T | C | C | C | C | A | C | G | T | 0 | 5 | 0.0366 | Cell division cycle 2 homolog S. pombe-like 2 |
| C | A | A | T | A | A | A | C | T | G | 23 | 12 | 0.0367 | Suppressor of initiator codon mutations-yeast homolog-related sequence 1 |
| G | G | C | T | G | G | G | G | G | C | 26 | 14 | 0.0369 | Profilin 1 |
| A | C | C | G | G | T | A | T | T | T | 5 | 14 | 0.0376 | Protein kinase C, β |
| C | C | A | A | T | G | C | A | G | C | 5 | 14 | 0.0376 | ESTs, highly similar to PROBABLE 3-OXOADIPATE COA-TRANSFERASE SUBUNIT B (Bacillus subtilis) |
| A | A | A | G | T | G | T | T | T | C | 1 | 7 | 0.0379 | ESTs |
| A | T | C | T | C | A | A | A | C | C | 1 | 7 | 0.0379 | ESTs |
| C | C | T | A | C | A | G | T | C | C | 1 | 7 | 0.0379 | No match |
| C | G | C | A | A | T | T | C | A | A | 1 | 7 | 0.0379 | No match |
| G | A | G | A | A | A | G | T | T | C | 1 | 7 | 0.0379 | ESTs |
| G | G | A | T | G | A | T | G | G | T | 1 | 7 | 0.0379 | ESTs, highly similar to EXTRACELLULAR RIBONUCLEASE LE PRECURSOR (Lycopersicon esculentum) |
| G | T | C | A | G | G | G | G | G | A | 1 | 7 | 0.0379 | ESTs |
| T | C | C | C | C | G | T | C | C | A | 1 | 7 | 0.0379 | No match |
| T | C | C | C | T | A | C | T | A | A | 1 | 7 | 0.0379 | No match |
| T | G | A | G | C | A | G | T | G | G | 1 | 7 | 0.0379 | No match |
| T | G | T | G | T | T | C | C | C | A | 1 | 7 | 0.0379 | ESTs, weakly similar to (define not available 5931573, M. musculus |
| G | G | A | T | T | T | G | G | C | T | 45 | 66 | 0.0388 | Keratin complex 2, basic, gene1 |
| A | T | G | A | A | A | C | T | T | T | 19 | 9 | 0.0393 | ESTs |
| T | C | A | G | A | G | G | C | C | T | 22 | 37 | 0.0396 | ESTs |
| A | A | C | A | A | A | G | C | A | A | 10 | 3 | 0.0402 | ESTs, moderately similar to unknown (H. sapiens) |
| A | G | G | C | C | A | G | C | T | G | 10 | 3 | 0.0402 | Sema domain, immunoglobulin domain (lg), short basic domain, secreted, (semaphorin) 3F |
| G | C | C | A | A | A | T | T | T | G | 10 | 3 | 0.0402 | ESTs, highly similar to 26S proteasome subunit p112 (R. norvegicus) |
| G | G | G | C | T | G | G | A | A | T | 10 | 3 | 0.0402 | ESTs |
| C | T | T | G | C | A | A | G | T | G | 13 | 25 | 0.0417 | ESTs, highly similar to NADH-UBIQUINONE OXIDOREDUCTASE B22 SUBUNIT (B. taurus) |
| G | A | G | T | T | C | T | C | T | G | 13 | 25 | 0.0417 | ESTs, moderately similar to HSPC035 protein (H. sapiens) |
| G | C | T | G | G | C | A | G | C | C | 32 | 19 | 0.0417 | RAD9 homolog (S. pombe) |
| T | T | G | G | C | T | G | C | C | C | 43 | 28 | 0.0422 | Ribosomal protein S14 |
| G | T | C | T | G | C | T | G | A | T | 6 | 15 | 0.0439 | Guanine nucleotide-binding protein, β-2, related sequence 1 |
| G | A | G | G | A | G | T | G | G | G | 9 | 19 | 0.0461 | NO match |
| C | T | T | C | T | C | A | T | T | T | 3 | 10 | 0.0462 | Membrane transporter protein |
| G | G | C | A | A | T | T | C | A | A | 3 | 10 | 0.0462 | No match |
| T | G | T | C | G | C | C | A | G | G | 3 | 10 | 0.0462 | No match |
| C | C | A | G | A | A | C | A | G | A | 14 | 26 | 0.0464 | Ribosomal protein L30 |
| G | C | C | T | G | T | G | G | T | G | 21 | 11 | 0.0469 | Lymphocyte antigen 6 complex, locus H |
| G | G | G | T | G | C | A | G | C | C | 25 | 14 | 0.0470 | FK506-binding protein 8 (38 kD) |
| G | T | G | C | C | C | T | C | C | A | 34 | 21 | 0.047 | No match |
| T | G | G | A | A | C | C | T | T | G | 13 | 5 | 0.0478 | ESTs |
| T | T | C | T | C | C | T | C | A | G | 13 | 5 | 0.0478 | ESTs, moderately similar to (define not available 5815343, M. musculus) |
| T | A | T | G | C | A | A | C | C | C | 33 | 21 | 0.0486 | Necdin |
| A | A | A | A | C | A | G | T | G | G | 15 | 27 | 0.0489 | Ribosomal protein L37a |
| G | G | G | A | G | G | G | A | G | G | 17 | 8 | 0.0499 | No match |
| A | G | C | A | G | T | C | C | C | T | 11 | 4 | 0.0542 | Homogentisate 1,2-dioxygenase |
| C | T | C | A | G | A | A | A | G | C | 11 | 4 | 0.0502 | ATPase, H+ transporting, lysosomal (vacuolar proton pump), α 70 kD, isoform 2 |
| G | C | T | G | C | C | T | T | C | C | 11 | 4 | 0.0502 | Harvey rat sarcoma virus oncogene |
| T | G | A | A | C | C | T | G | A | G | 11 | 4 | 0.0502 | ESTs |
| C | T | C | C | T | G | C | A | G | C | 5 | 13 | 0.0508 | sid478p |
| G | A | C | G | A | G | A | T | T | C | 5 | 13 | 0.058 | ESTs, weakly similar to Lpe5p (S. cerevisiae) |
[i] For each tag (tag sequence) the number of its copies in Ts65Dn library (Ts65Dn) and normal library (Normal) together with the estimated p-chance and GenBank matach (GenBank match) are shown. Complete table available as online supplementary material atwww.genome.org. An ongoing update of the table is available atmedger.unige.ch/research/projects.html.
List of Tags Corresponding to Ribosomal Protein Genes with Statistically Significant Differences between Normal and Is65Dn Male Brain SAGE Library
| Description | TAG | Normal males | Trisomic males | P | Normal females | 3T3 (Nor50K) | |||||||||
| Ribosomal protein L26 | T | G | G | G | C | A | T | C | C | A | 41 | 12 | 0.0000 | 26 | 0 |
| Ribosomal protein L5 | C | T | G | C | T | A | T | C | C | G | 32 | 9 | 0.0003 | 19 | 40 |
| Ribosomal protein S8 | T | G | T | A | G | T | G | T | A | A | 0 | 8 | 0.0035 | 6 | 12 |
| Ribosomal protein S6 | G | C | A | G | A | G | T | G | C | G | 14 | 32 | 0.0044 | 19 | 85 |
| Ribosomal protein S3 | C | C | C | C | A | G | C | C | A | G | 48 | 25 | 0.0065 | 42 | 156 |
| Ribosomal protein S19 | A | C | C | A | A | G | A | T | C | T | 13 | 3 | 0.0112 | 17 | 46 |
| ESTS, highly similar to 60S RIBOSOMAL PROTEIN L37 (Homo sapiens; Rattus norvegicus) | G | A | T | T | C | C | G | T | G | A | 64 | 39 | 0.0113 | 67 | 108 |
| Ribosomal protein S24 | G | C | C | T | T | T | A | T | G | A | 27 | 12 | 0.0155 | 30 | 43 |
| Ribosomal protein S7 | T | T | C | A | G | C | T | C | G | A | 19 | 33 | 0.0303 | 38 | 44 |
| ESTs, weakly similar to Bacillus stearothermophilus 30S ribosomal protein S21 (Caenorhabditis elegans) | T | C | C | A | A | C | T | C | C | T | 1 | 7 | 0.0327 | 7 | 2 |
| EST, weakly similar to 60S ACIDIC RIBOSOMAL PROTEIN P2 (Rattus norvegicus) | G | G | A | T | T | T | G | G | C | T | 66 | 45 | 0.0388 | 78 | 44 |
| Ribosomal protein s14 | T | T | G | G | C | T | G | C | C | C | 28 | 43 | 0.0422 | 40 | 73 |
| Ribosomal protein L30 | C | C | A | G | A | A | C | A | G | A | 26 | 14 | 0.0464 | 23 | 68 |
| Ribosomal protein L37a | A | A | A | A | C | A | G | T | G | F | 27 | 15 | 0.0489 | 35 | 36 |
[i] The identity for each tag (Description) and statistical significance (P) of observed differences between normal and Ts65Dn SAGE libraries are presented. The number of tags in SAGE libraries derived from normal (Normal males) or Ts65Dn (Trisomic males) mouse male brains, normal female brains (Normal females), and mouse embryonic cell line 3T3 are shown. Tags from the 3T3 SAGE library were normalized for a total of 50,000.
Northern Blot Confirmation of Results
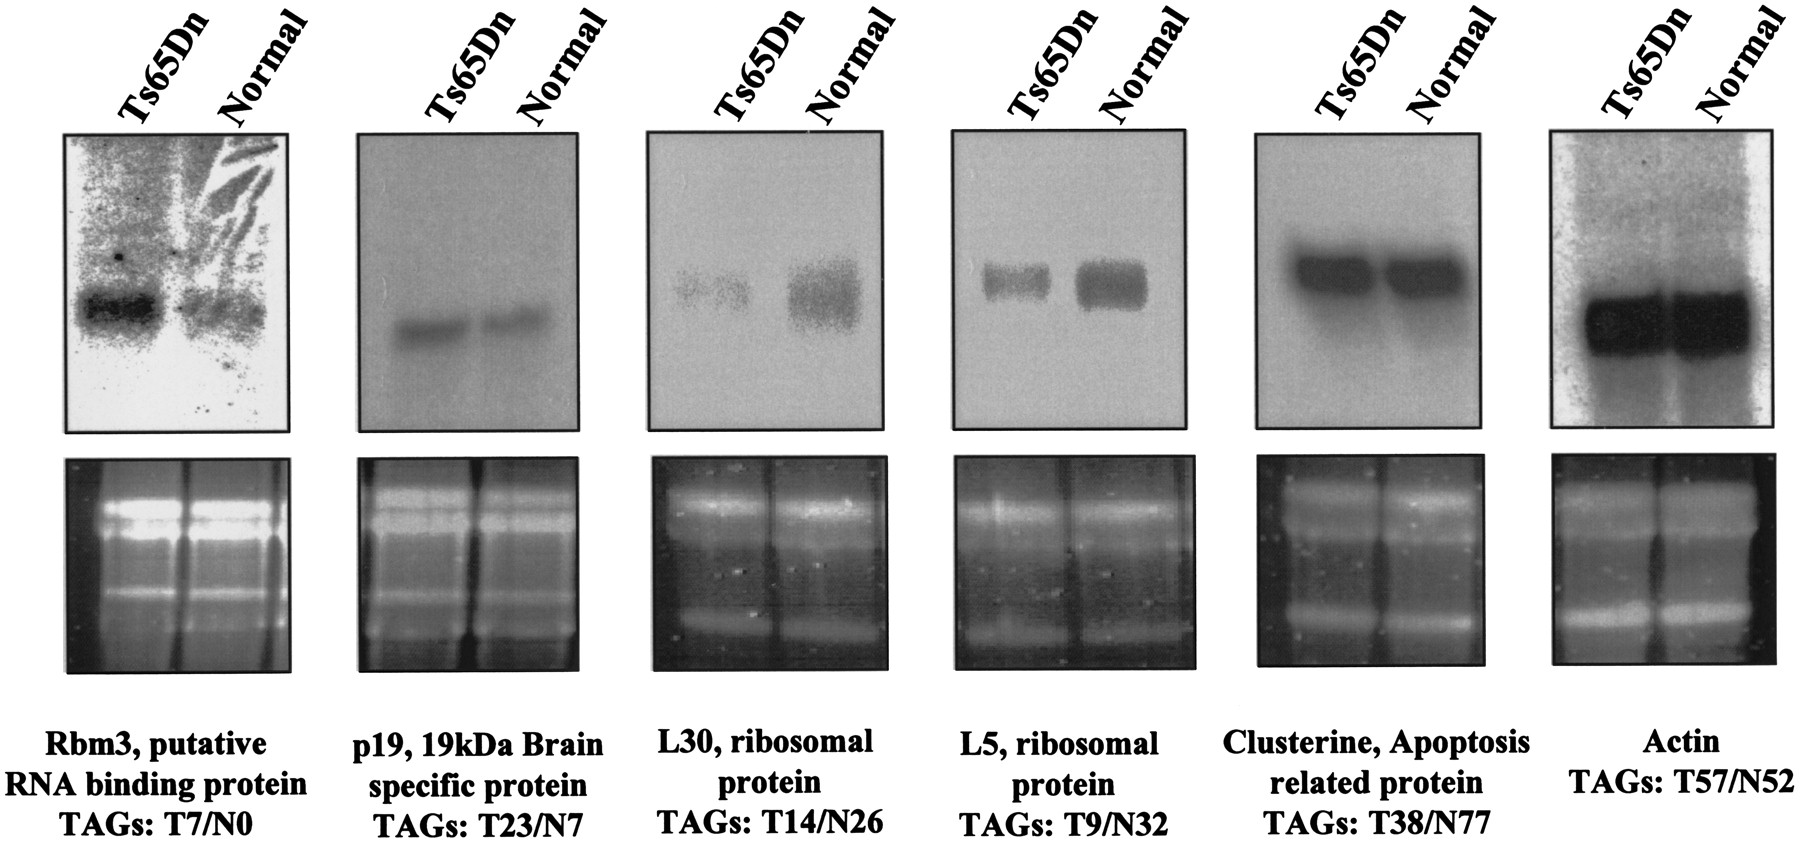
We have attempted to confirm the differential expression of a small number of genes from our SAGE study by Northern blot analyses. Confirmations were performed for the following: (1) transcripts that were overrepresented in the Ts65Dn tag library, such as theRbm3 putative RNA-binding protein (seven tags in trisomy and none in normal SAGE library) and the p19, 19-kD brain-specific protein (T23/N7); (2) those transcripts that were underrepresented in the Ts65Dn tag library, such as clusterin, an apoptosis-related protein (38 tags in trisomy and 77 tags in normal SAGE library), the L30 ribosomal protein (14 tags in trisomy and 26 tags in normal SAGE library), and the L5 ribosomal protein (nine tags in trisomy and 32 tags in normal SAGE library); and (3) for those transcripts that were represented by similar number of tags, such as the cytoskeletal actin (57 tags in trisomy and 52 tags in normal SAGE library; Fig. 4). We have confirmed overexpression of Rbm3 and p19 and underexpression of L30 and L5 ribosomal protein genes in the Ts65Dn sample and shown similar levels of actin mRNA in the normal and Ts65Dn samples. However, we have not been able to confirm underexpression of clusterin in the Ts65Dn samples.
Northern blot analysis of some examples of differentially expressed genes between normal and Ts56Dn mouse serial analysis of gene expression (SAGE) libraries. Total RNA isolated from brain of four control males and four Ts65Dn male mice was blotted and hybridized with probes detecting Rbm3, p19, L30, and L5 ribosomal protein genes, clusterin, and actin transcripts. The top panel shows the results of autoradiography, the bottom panel shows the corresponding agarose gels prior to blotting (the two bands represent the 28S and 18S rRNAs). The number of tags detected in normal (N) and Ts65Dn (T) male SAGE libraries are also shown.
Expression of Genes from the Triplicated Region of Chromosome 16 in Ts65Dn Mice
The Ts65Dn mice have three copies of the region of chromosome MMU16 from markers App to Mx1 (Reeves et al. 1995). This should theoretically lead to overexpression (1.5× the normal level) of the genes from this part of the chromosome. We have examined the expression of the 24 MMU16 genes known from the region between App and Mx1 as represented by their corresponding tags (Table5). We have detected at least one tag for 15 of these genes; however, only three, Ifnar2 (three tags in trisomy and none in normal SAGE library ), Ifngr2 (three tags in trisomy and none in normal SAGE library), and Cbr (nine tags in trisomy and three tags in normal SAGE library), showed overexpression in the Ts65Dn male versus the normal male SAGE library. Interestingly, the level of expression of most known triplicated genes is too low to achieve statistical significance.
List of Known MMU16 Genes Present in Three Copies in Ts65Dn Mice and Their Expression Level as Detected by the Number of Corresponding Tags in Normal and Ts65Dn SAGE
| Gene name | GenBank No. | pA site | TAG sequence | Ts65Dn | Normal | |||||||||
| App | X59379 | yes | A | T | A | G | C | T | T | T | C | T | 26 | 23 |
| Grik1 | X66118 | yes | G | A | T | A | G | A | G | G | G | A | 0 | 0 |
| ll10rb | U53696 | no | A | A | C | A | T | T | T | T | G | G | 0 | 0 |
| Sod1 | M35725 | yes | A | G | A | A | A | C | A | A | G | A | 7 | 10 |
| Tiam1 | U05245 | yes | A | T | G | T | G | T | C | T | A | T | 1 | 0 |
| Cbfa2 | D13802 | yes | C | A | C | A | G | A | C | C | C | C | 0 | 0 |
| Mak-V | AF055919 | no | A | G | T | A | A | G | G | A | C | T | 0 | 1 |
| Synp | No mouse homolog | |||||||||||||
| Rack17 | No mouse homolog | |||||||||||||
| lfnar2 | AF013486 | yes | G | A | G | A | G | C | T | A | C | G | 3 | 0 |
| lfngt1 | No mouse homolog | |||||||||||||
| C21orf4 | No mouse homolog | |||||||||||||
| Gart | U01024 | yes | G | C | C | A | A | A | C | T | G | A | 1 | 1 |
| Son | AF1935606 | yes | T | G | T | A | T | T | A | C | A | G | 1 | 0 |
| Itsn Esi1 | AF132478 | no | G | A | C | C | C | C | A | G | C | C | 0 | 0 |
| Itsn Esi1L | AF132481 | no | A | G | G | T | C | C | C | C | A | C | 0 | 0 |
| Atp5o | No mouse homolog | |||||||||||||
| Slc5a3 | NM_017391 | no | T | T | T | G | T | T | T | A | T | T | 0 | 0 |
| Mirp1 | No mouse homolog | |||||||||||||
| Kcnq1 | U70068 | yes | T | G | C | A | G | C | C | T | G | C | 0 | 1 |
| Dscr1 | No mouse homolog | |||||||||||||
| Clic3 | No mouse homolog | |||||||||||||
| Ifngr2 | U69599 | yes | C | C | T | T | T | A | T | T | C | C | 3 | 0 |
| Cbr | U31966 | yes | G | T | G | A | A | C | C | C | A | A | 9 | 3 |
| Sim2 | D64135 | yes | T | T | G | T | G | T | G | T | A | A | 0 | 0 |
| Ttc3-Tprd | AB008516 | yes | C | C | T | T | A | C | A | C | T | T | 4 | 4 |
| Dyrk1a | U58497 | no | G | T | C | G | A | C | G | C | G | G | 0 | 0 |
| Kcnj6 | U51122 | yes | T | G | T | G | A | G | A | T | G | C | 0 | 0 |
| Erg | S66169 | no | G | G | C | T | C | C | T | A | T | C | 0 | 0 |
| Ets2 | J04103 | no | C | C | A | T | C | C | T | G | G | G | 0 | 2 |
| Hmg14 | X53476 | yes | T | A | A | T | A | A | A | A | A | T | 1 | 0 |
| Pcp4 | X17320 | yes | A | A | G | A | G | A | A | A | C | C | 46 | 39 |
| Dscam | No mouse homolog | |||||||||||||
| Mx1 | M12279 | yes | T | G | T | T | T | G | C | T | T | C | 1 | 0 |
| Mx2 | J03368 | yes | C | T | C | C | A | G | C | T | C | C | 0 | 0 |
[i] For each gene (Gene name, GenBank no.) the corresponding most 3′ tag was used to determine the tag frequency in SAGE libraries derived from normal or Ts65Dn mouse male brains.
DISCUSSION
Understanding not only the spatial and temporal expression patterns of individual genes but also how these relate to expression patterns of other genes and to events such as changes in behavioral state, onset of disease, and response to drugs, is of great interest and can provide valuable insights into their molecular physiology. To study the effects of aneuploidy in the brain transcriptome we have sequenced ∼150,000 tags, 50,000 each from normal male, Ts65Dn male, and normal female P30 brain SAGE libraries. Out of ∼150,000 sequenced tags we have observed 45,856 unique tags. To estimate how many different unique transcripts these 45,856 tags represent, we used a computed sequencing error of 6.8% (Velculescu et al. 1997) and the calculation that each transcript is represented by ∼1.6 SAGE tags (Velculescu et al. 1999). These assumptions lead to an estimated number of 26,711 detected genes. Because we do not reach the plateau in unique tag discovery (Fig. 1), the total number of genes expressed in mice brain is higher but probably is ∼30,000–35,000. Comparison of the data between the human and mouse transcriptome shows a similar percentage of cellular transcripts in the various classes of abundance of unique tags (Table1). That many more unique tags were detected in the category of five or fewer copies per cell in humans (37,293 vs. 127,342 tags in the mouse brain and the human transcriptome, respectively) reflects the total number of tags sequenced (3.5 million tags from 19 normal and diseased tissue types in humans). Seventy-six percent of the mouse brain tags had no matches in the public databases, compared with 46% in the human transcriptome (Velculescu et al. 1999). Unmatched tags in both cases are mainly among the genes with low expression levels and this difference is likely to be caused by the lower number of mRNAs and ESTs described in mice as compared with humans. As expected, highly expressed tissue-specific transcripts that have been detected in other SAGE studies (e.g., trypsin in pancreas [Velculescu et al. 1995] or desmin and troponin in muscle [Welle et al. 1999]) are expressed at low levels or not at all in mouse brain (trypsin, no tags; desmin, no tags; troponin, three tags). A comparison of the 15 most abundant mouse brain transcripts with data from the human brain (Table 2; Velculescu et al. 1999) revealed that, on the whole, these genes are expressed at comparable levels in both species. However, these genes were expressed at slightly higher levels in mouse brain compared with human brain, which may reflect structural differences between mouse and human brain or differences in age. More systematic comparisons between mouse and human transcriptomes will be important in establishing the mouse as a valid model for expression studies of human development, disease, and therapies. Improved bioinformatics tools and standard gene nomenclature between humans and mouse could improve and facilitate such cross-species comparisons.
That SAGE is an accurate reflection of the content of the RNA used in the experiment has been established by many studies (Hermeking et al. 1997; Madden et al. 1997; Polyak et al. 1997; Velculescu et al. 1997;Zhang et al. 1997; Chen et al. 1998; Gonzalez-Zulueta et al. 1998; He et al. 1998; Hibi et al. 1998; Hashimoto et al. 1999; Kal et al. 1999;van den Berg et al. 1999; Welle et al. 1999). An internal control of a differential gene expression study by SAGE is that the expression levels of the majority of transcripts remain the same between the compared samples. Two additional controls of the quality of our data have been performed. We have checked the completeness ofNlaIII digestion by analyzing the occurrence of tags derived from internal NlaIII sites in several genes including β-actin (GenBank accession no. X03672), α-actin (GenBank accession no: X03766) and glyceraldehyde-3-phosphate dehydrogenase (GAPDH; GenBank accession no: M32599). For all of these genes, there were only between one and four tags matching possible results of partial digestion by NlaIII, compared with 68 tags derived from the most 3′NlaIII site of α-actin, 167 of β-actin, and 490 of GAPDH. Thus the NlaIII digestion in the experiments described here went almost to completion. Biological and statistical (as opposed to statistical only) significance of observed differences can be added by confirming their presence in independent biological samples. Northern blot analyses in independent brain RNA samples from normal and Ts65Dn mice confirmed the differential expression of Rbm3 (seven tags in trisomy and none in normal SAGE library), p19 (23 tags in trisomy and seven tags in normal SAGE library), L30 (14 tags in trisomy and 26 tags in normal SAGE library), and L5 (nine tags in trisomy and 32 tags in normal SAGE library) ribosomal protein genes and cytoskeletal actin (57 TAGs in trisomy and 52 tags in normal SAGE library). The observed underexpression of clusterin in the brains of Ts65Dn mice could not be confirmed. RNA expression differences observed using SAGE tags may not be confirmed because of incorrect identification of the transcript, different samples used for collection and confirmation of the data, and variability of Ts65Dn phenotypes possibly because of the fact that the Ts65Dn mice are not inbred, because they originated from B6 and C3H backgrounds.
The level of expression of most known genes from the triplicated region of mouse MMU16 in Ts65Dn is too low to observe statistically significant differences. Of 15 genes for which at least one tag was detected in the 100,000 sequenced from normal and Ts65Dn male SAGE libraries, only three (Ifnar2, Ifngr2, andCbr) are overexpressed (not statistically significant) in Ts65Dn mice (Table 5). Overexpression of two MMU16 genes,App and Sod1, in Ts65Dn has previously been documented (Reeves et al. 1995; Holtzman et al. 1996); however, at the depth of our tag collection we did not observe these results in our SAGE analysis (for App, 26 tags in trisomy and 23 tags in the normal SAGE library were overexpressed; for Sod1, seven tags in trisomy and 23 tags in the normal SAGE library were overexpressed).
Our data suggest that trisomy for the part of MMU16 present in Ts65Dn mice results in limited changes in the transcription level of many genes (330 changes with P < 0.05), rather than in the induction of strong overexpression or repression of a few transcripts. We have obtained similar results analyzing gene expression in T21 versus normal amniocytes (Scott et al., unpubl.) and protein expression (∼2000–2500 proteins analyzed) in brains of Ts65Dn and normal males using 2D gels (Chrast et al., unpubl.). It is evident that the SAGE analysis, other differential gene expression techniques, and 2D protein gels are currently capable of being quantitative only for abundant transcripts and proteins. It is also difficult to assign what differences are physiologically significant. Thus differences in low-abundance mRNAs, small physiologically significant differences, and differences specific to temporal and spatial gene expression would not have been detected in this study.
Apoptosis was described to accelerate neuronal death in cultured neurons from human DS brains (Busciglio and Yanker 1995) and T16 mouse model of DS (Bambrick and Krueger 1999). However, our analysis revealed only one differentially expressed gene related to apoptosis, the clusterin (38 tags in trisomy and 77 tags in normal SAGE library), and this difference was not confirmed by Northern blot.
Grouping genes according to function to detect trends in the expression of identified transcripts (with or without significant differential expression) revealed that there are 14 ribosomal protein genes (nine of which are underexpressed) that show statistically significant difference in expression (Table 4). No other class of genes is significantly overrepresented. The mammalian ribosome is composed of four RNA species and ∼80 different proteins that constitute ∼80% of all cellular RNA and 5%–10% of cellular protein (Wool 1979). There has been a report of reduced activity of ribosomal genes with age in DS (Borsatto and Smith 1996). There are two additional lines of evidence that suggest that the underexpression of ribosomal proteins may be important in development and maintenance of DS/Ts65Dn phenotypes. First, the ribosomal protein genes are not underexpressed in normal P30 female brain and 3T3 cells (Table 4). Second, a similar finding was observed in a comparison of gene expression between T21 and normal human amniocytes by SAGE, including the underexpression of three of the same ribosomal proteins (Scott et al., unpubl.).
In Drosophila, several Minute loci (reduced body size, diminished fertility, and short, thin bristles) have been characterized and all have been found to encode ribosomal proteins (Kongsuwan et al. 1985; Hart et al. 1993; Andersson et al. 1994;Cramton and Laski 1994; Schmidt et al. 1996; Saeboe-Larssen et al. 1998). Minute cells probably contain fewer ribosomes and thus have a reduced capacity for protein synthesis. Findings consistent with reduced expression of ribosomal protein S4 are implicated in certain features of Turner syndrome (45, X; Fisher et al. 1990; Watanabe et al. 1993; Zinn et al. 1994). It has been predicted that ribosomal protein deficiencies contribute to the abnormal development and poor viability of monosomic human fetuses (Kenmochi et al. 1998).
Mutations of the ribosomal protein S19 (RPS19) gene, which is underexpressed in both this study (three tags in trisomy and 13 tags in normal SAGE library) and the study of normal human versus T21 fetal fibroblasts, were recently identified in patients with Diamond-Blackfan anemia (DBA; Draptchinskaia et al. 1999). DBA or congenital pure red blood cell aplasia is variably associated with a wide range of abnormalities, some of which are similar to those of DS. These include short stature, craniofacial and thumb abnormalities, cardiac (atrial or ventricular septal defects) and urogenital malformations, epicanthal folds, cataracts, prenatal or postnatal growth retardation, and a moderately increased risk of developing hematological malignancies. A wide range of clinical presentations, and even clinically silent effects, are associated in DBA with mutations in the RPS19gene, even for identical mutations within the same family.
Although variable reduction in the rate of protein synthesis could contribute to and modulate expression of DS/Ts65Dn phenotypes, some ribosomal proteins have been shown to have extraribosomal functions, such as rat and Drosophila melanogaster ribosomal proteinS3, which also functions as a DNA-repair endonuclease (Wilson et al. 1994). S3 is also underexpressed in both this study (N48/T25) and in our human fibroblast SAGE study.
In conclusion, our study contributes to the establishment of a mouse brain transcriptome, an important step that enables analyses of gene expression induced by disease states and other biological conditions. P30 mice are just before sexual maturity (∼6 wk old); therefore our data may also serve as a starting point to determine differences in gene expression between male and female brains induced by hormonal and other changes that occur with sexual maturation. The comparison of normal and Ts65Dn male brain SAGE libraries revealed 330 differentially expressed transcripts. Identification of all transcripts corresponding to these TAGs will enable the construction of microarrays and a higher throughput analysis of their expression in additional tissues and developmental stages from mouse models of DS. Use of samples from Ts65Dn and other mice overexpressing single transgenes from the so-called DS-critical region may also help to dissect the contributions of distinct chromosomal regions and individual genes to the expression profile. We anticipate that with a better understanding of the molecular pathophysiology of DS new therapeutic approaches may be developed to this complex disorder.
METHODS
Tissue Collection, Diagnosis, and RNA Isolation
Whole brains and spleens from four control males, three control females, and three Ts65Dn P30 mice were collected and stored in liquid nitrogen. Ts65Dn mice are not inbred but are maintained by mating female carriers of the 1716 chromosome (B6C3H–Ts65Dn) to B6EiC3HF1 hybrid male mice obtained from crossing of C57Bl/6Jei × C3H/HeSnJ strains. The phenotype is already partially established in P30 Ts65Dn mice. The comparison of gene expression pattern at this age may therefore reveal genes that are involved in maintenance, rather than the development, of phenotypes. Ts65Dn mice have only mild behavioral changes that are difficult to detect by simple observation of the animals (M.T. Davisson, C. Schmidt, pers. comm.). Thus, the presence of the partial trisomy was diagnosed by fluorescence in situ hybridization analysis. Interphase nuclei of spleen cells (a detailed protocol can be found at http://www.biomednet.com/home) were hybridized using a biotin-labeled MMU16-specific probe (Applied Genetics Laboratories) mapping distal to App in the region that is triplicated in Ts65Dn mice. Littermate mice that did not have partial trisomy 16 were used as controls. Poly A+ RNA was prepared from each mouse brain separately using the FastTrack 2.0 Kit from Invitrogen. mRNA was quantified by spectrophotometry and equal amounts of mRNA from each brain were used to make three pools for SAGE library construction (Ts65Dn males, normal males, and normal females).
Generation of SAGE Libraries
SAGE libraries were produced following the SAGE protocol (Velculescu et al. 1995), available athttp://www.sagenet.org/sage_protocol.htm: 5 μg of poly A+mRNA were converted to cDNA (GibcoBRL) using a gel-purified 5′-biotinylated oligo-(dT)18 (Integrated DNA Technologies, Inc.). cDNA was digested with NlaIII (NEB), the anchoring enzyme, and 3′ cDNAs were isolated using streptavidin magnetic beads (Dynal M-280). 3′ cDNAs were split into two pools, and SAGE linkers 1 and 2 (synthesized by Integrated DNA Technologies, Inc.) were ligated to pools 1 and 2, respectively. SAGE tags were released with the tagging enzyme BsmFI (NEB), blunt ended with the Klenow polymerase fragment, and the tags from pools 1 and 2 were ligated to each other over night at 16° C. A 1:250 dilution of the ligation product was amplified with 28 cycles of PCR (192 reactions). Precipitated PCR products were run on 12% polyacrylamide gel and only the 102-bp band containing ditags (a combination of two SAGE tags in a tail-to-tail orientation) was isolated and digested with NlaIII. The products of the digestion were run on a 12% polyacrylamide gel and the 24–26-bp bands containing ditags were purified and used for self-ligation. Concatamers were run on an 8% polyacrylamide gel and a fraction from 700 bp to 1500 bp was isolated and cloned into pZERO vector (Invitrogen) digested with SphI. Cloned concatamers were amplified by colony PCR using T7 and SP6 primers. PCR products were purified using QIAquick 96 PCR purification kits (QIAGEN) and used as templates for sequencing with BigDye terminators using standard protocols for the ABI377 automated sequencer.
SAGE Data Analysis
SAGE data are available as SAGE projects and Microsoft Access databases at http://medgen.unige.ch/research/projects.html. Data analysis was performed using the SAGE analysis software (version 3.03;http://www.sagenet.org/). The statistical approach to compare two SAGE libraries used by this software is based on Monte Carlo simulations. For each P-chance calculation, 100,000 simulations are performed assuming the null hypothesis (the level, kind, and distribution of transcripts is the same for the two populations being compared); the P-chance value represents the fraction of simulations that yielded a difference equal to or greater than the observed difference. This is a relative probability of obtaining the observed differences because of the random variation (Zhang et al. 1997). tags derived from linkers and duplicate ditags were excluded from the analyses. Transcript tags were matched to known genes and ESTs using SAGE tag to UniGene clusters developed by A. Lash (Lal et al. 1999). The analysis was done using the NCBI database (ftp://ncbi.nlm.nih.gov/pub/alash/Mm/, UniGene build 75,http://www.ncbi.nlm.nih.gov/UniGene), and the Microsoft Access software. As UniGene cluster numbers are not stable over time, the most recent tag to cluster mapping should be obtained (ftp://ncbi.nlm.nih.gov/pub/alash/Mm/). The mouse embryonic cell line (3T3) SAGE library (28,531 tags) was downloaded fromhttp://www.sagenet.org/SAGEData/sagedata.htm. Human brain data from two SAGE libraries, BB542 (95,254 tags) and normal pool (61,218 tags), were downloaded from http://www.ncbi.nlm.nih.gov/SAGE/sagelb.cgi. Transcript abundance per cell was determined by dividing the observed number of tags for a given transcript by the total number of transcripts obtained. An estimate of 300,000 transcripts per cell was used to convert the observed tags to copies per cell.
Northern Blot Analysis
Fifteen micrograms of total RNA isolated from the brains of four control males and four Ts65Dn male mice were electrophoresed on agarose-formaldehyde gel, blotted onto GeneScreen Plus membrane (NEN Research Products), and hybridized as described (Sambrook et al. 1989). We have used the following RT–PCR probes prepared from normal mouse brain cDNA: Mouse skeletal actin (GenBank accession no. M12866), 155 bp between oligonucleotides mactE6F 5′GCTGACCG CATGCAGAAGGA3′ and mactE7R 5′CTCCTGCTTGGTGA TCCACA3′; mouse putative RNA-binding protein 3 (GenBank accession no. AB016424), 314 bp between RBM3F 5′AGGC ACTCAGGATTATTGTT3′ and RBM3R 5′TAGCTCCATAAAG GACATCC3′; Mouse p19 protein (GenBank accession no. U17259), 367 bp between p19F 5′CATTTCTCAACTAG GAATGC3′ and p19R 5′GAATTCAATTGTCATTCCTG3′; mouse clusterin (GenBank accession no. L08235), 150 bp between clusterinF 5′CATCACCTTCCTATATGTAG3′ and clusterinR 5′AGGCATTAGTGTACAGAATC3′; mouse ribosomal protein L5 (GenBank accession no. X83590), 205 bp between ribL5F 5′AGGAAGATGAAGATGCGTAT3′ and ribL5R 5′GCAACCCGATCTTTCTTCTG3′; and mouse ribosomal protein L30 (GenBank accession no. K02928), 190 bp between RibL30F 5′GATGATCAGACAAGGCAAAG3′ and RibL30R 5′TGGGTCAATGATAGCCAGTG3′.
We thank the members of the S.E.A. laboratory for advice and discussions and particularly Dr. R. Lyle for critical reading of the manuscript. This work was supported by grants 31.57149.99 and 4038–52845.1 from the Swiss FNRS, 98–3039 from the OFES/EU, and funds from the University and Cantonal Hospital of Geneva.
The publication costs of this article were defrayed in part by payment of page charges. This article must therefore be hereby marked “advertisement” in accordance with 18 USC section 1734 solely to indicate this fact.
Notes
[6] Present addresses: 5Genetics and Bioinformatics Group, Walter and Eliza Hall Institute, Royal Parade, Parkville, P.O. Royal Melbourne Hospital, Victoria 3050, Australia; 6Molecular Genetics and Development, Institute of Reproduction and Development, Monash Medical Center, Clayton 3168, Australia.
[7] Corresponding author.
Notes
[8] E-MAIL [email protected]; FAX 41-22-7025706.
[9] Article and publication are at www.genome.org/cgi/doi/10.1101/gr.158500.
REFERENCES
- ↵S. AnderssonS. Saeboe-LarssenA. LambertssonJ. MerriamM. Jacobs-Lorena(1994) A Drosophila third chromosome Minute locus encodes a ribosomal protein. Genetics 137:513–520.
- ↵L.L. BambrickB.K. Krueger(1999) Neuronal apoptosis in mouse trisomy 16: Mediation by caspases. J. Neurochem. 72:1769–1772.
- ↵L.L. BaxterT.H. MoranJ.T. RichtsmeierJ. TroncosoR.H. Reeves(2000) Discovery and genetic localization of Down syndrome cerebellar phenotypes using the Ts65Dn mouse. Hum. Mol. Genet. 9:195–202.
- ↵B. BorsattoM. Smith(1996) Reduction of the activity of ribosomal genes with age in Down's syndrome. Gerontology 42:147–154.
- ↵J. BusciglioB.A. Yankner(1995) Apoptosis and increased generation of reactive oxygen species in Down's syndrome neurons in vitro. Nature 378:776–779.
- ↵H. ChenM. CentolaS.F. AltschulH. Metzger(1998) Characterization of gene expression in resting and activated mast cells J. Exp. Med. 188:1657–1668.
- ↵S.E. CramtonF.A. Laski(1994) String of pearls encodes Drosophila ribosomal protein S2, has Minute-like characteristics, and is required during oogenesis. Genetics 137:1039–1048.
- Dierssen, M., Fillat, C., Crnic, L., Arbonés, M., Florez, J., Estivill, X. 2000. Murine models for Down Syndrome. Phys. Behav. (in press)..
- ↵N. DraptchinskaiaP. GustavssonB. AnderssonM. PetterssonT.N. WilligI. DianzaniS. BallG. TcherniaJ. KlarH. Matsson(1999) The gene encoding ribosomal protein S19 is mutated in Diamond-Blackfan anaemia. Nat. Genet. 21:169–175.
- ↵C.J. Epstein(1995) Down syndrome (Trisomy 21). in The metabolic and molecular bases of inherited disease, ed C.R. Scriver(McGraw-Hill, New York), pp 749–794.
- ↵E.M. FisherP. Beer-RomeroL.G. BrownA. RidleyJ.A. McNeilJ.B. LawrenceH.F. WillardF.R. BieberD.C. Page(1990) Homologous ribosomal protein genes on the human X and Y chromosomes: Escape from X inactivation and possible implications for Turner syndrome. Cell 63:1205–1218.
- ↵M. Gonzalez-ZuluetaL.M. EnszG. MukhinaR.M. LebovitzR.M. ZwackaJ.F. EngelhardtL.W. OberleyV.L. DawsonT.M. Dawson(1998) Manganese superoxide dismutase protects nNOS neurons from NMDA and nitric oxide-mediated neurotoxicity. J. Neurosci. 18:2040–2055.
- ↵K. HartT. KleinM. Wilcox(1993) A Minute encoding a ribosomal protein enhances wing morphogenesis mutants. Mech. Dev. 43:101–110.
- ↵S. HashimotoT. SuzukiH.Y. DongN. YamazakiK. Matsushima(1999) Serial analysis of gene expression in human monocytes and macrophages. Blood 94:837–844.
- ↵M. HattoriA. FujiyamaT.D. TaylorH. WatanabeT. YadaH.S. ParkA. ToyodaK. IshiiY. TotokiD.K. Choi(2000) The DNA sequence of human chromosome 21. Nature 405:311–319.
- ↵T.C. HeA.B. SparksC. RagoH. HermekingL. ZawelL.T. da CostaP.J. MorinB. VogelsteinK.W. Kinzler(1998) Identification of c-MYC as a target of the APC pathway. Science 281:1509–1512.
- ↵H. HermekingC. LengauerK. PolyakT.C. HeL. ZhangS. ThiagalingamK.W. KinzlerB. Vogelstein(1997) 14–3–3 ς is a p53-regulated inhibitor of G2/M progression. Mol. Cell 1:3–11.
- ↵D. HernandezE.M. Fisher(1999) Mouse autosomal trisomy: Two's company, three's a crowd. Trends Genet. 15:241–247.
- ↵K. HibiQ. LiuG.A. BeaudryS.L. MaddenW.H. WestraS.L. WehageS.C. YangR.F. HeitmillerA.H. BertelsenD. SidranskyJ. Jen(1998) Serial analysis of gene expression in non-small cell lung cancer. Cancer Res. 58:5690–5694.
- ↵D.M. HoltzmanD. SantucciJ. KilbridgeJ. Chua-CouzensD.J. FontanaS.E. DanielsR.M. JohnsonK. ChenY. SunE. Carlson(1996) Developmental abnormalities and age-related neurodegeneration in a mouse model of Down syndrome. Proc. Natl. Acad. Sci. 93:13333–13338.
- ↵A.J. KalA.J. van ZonneveldV. BenesM. van den BergM.G. KoerkampK. AlbermannN. StrackJ.M. RuijterA. RichterB. Dujon(1999) Dynamics of gene expression revealed by comparison of serial analysis of gene expression transcript profiles from yeast grown on two different carbon sources. Mol. Biol. Cell 10:1859–1872.
- ↵N. KenmochiT. KawaguchiS. RozenE. DavisN. GoodmanT.J. HudsonT. TanakaD.C. Page(1998) A map of 75 human ribosomal protein genes. Genome Res. 8:509–523.
- ↵K. KongsuwanQ. YuA. VincentM.C. FrisardiM. RosbashJ.A. LengyelJ. Merriam(1985) A Drosophila Minute gene encodes a ribosomal protein. Nature 317:555–558.
- ↵A. LalA.E. LashS.F. AltschulV. VelculescuL. ZhangR.E. McLendonM.A. MarraC. PrangeP.J. MorinK. Polyak(1999) A public database for gene expression in human cancers. Cancer Res. 59:5403–5407.
- ↵J. LeJeuneM. GautierR. Turpin(1959) Etude des chromosomes somatiques de neufs enfants mongoliens. C. R. Acad. Sci. Paris 248:1721–1722.
- ↵S.L. MaddenE.A. GalellaJ. ZhuA.H. BertelsenG.A. Beaudry(1997) SAGE transcript profiles for p53-dependent growth regulation. Oncogene 15:1079–1085.
- ↵K. PolyakY. XiaJ.L. ZweierK.W. KinzlerB. Vogelstein(1997) A model for p53-induced apoptosis. Nature 389:300–305.
- ↵R.H. ReevesN.G. IrvingT.H. MoranA. WohnC. KittS.S. SisodiaC. SchmidtR.T. BronsonM.T. Davisson(1995) A mouse model for Down syndrome exhibits learning and behaviour deficits. Nat. Genet. 11:177–184.
- ↵S. Saeboe-LarssenM. LyamouriJ. MerriamM.P. OksvoldA. Lambertsson(1998) Ribosomal protein insufficiency and the minute syndrome in Drosophila: A dose-response relationship. Genetics 148:1215–1224.
- ↵H. SagoE.J. CarlsonD.J. SmithJ. KilbridgeE.M. RubinW.C. MobleyC.J. EpsteinT.T. Huang(1998a) Ts1Cje, a partial trisomy 16 mouse model for Down syndrome, exhibits learning and behavioral abnormalities. Proc. Natl. Acad. Sci. 95:6256–6261.
- ↵H. SagoE.J. CarlsonD.J. SmithJ. KilbridgeL.S. CrnicE.M. RubinW.C. MobleyT.T. HuangC.J. Epstein(1998b) Genetic dissection of the region associated with behavioral abnormalities in mouse models for Down syndrome. Am. J. Hum. Genet. 63:A340.
- ↵J. SambrookE.F. FritschT. Maniatis(1989) Molecular cloning: A laboratory manual (Cold Spring Harbor Laboratory Press, Cold Spring Harbor, New York), 2nd ed..
- ↵A. SchmidtM. HollmannU. Schafer(1996) A newly identified Minute locus, M(2)32D, encodes the ribosomal protein L9 in Drosophila melanogaster. Mol. Gen. Genet 251:381–387.
- ↵A. van den BergL. VisserS. Poppema(1999) High expression of the CC chemokine TARC in Reed-Sternberg cells. A possible explanation for the characteristic T-cell infiltratein Hodgkin's lymphoma. Am. J. Pathol. 154:1685–1691.
- ↵M.L. Van KeurenD. GoldmanC.R. Merril(1982) Protein variations associated with Down's syndrome, chromosome 21, and Alzheimer's disease. Ann. N.Y. Acad. Sci. 396:55–67.
- ↵V.E. VelculescuS.L. MaddenL. ZhangA.E. LashJ. YuC. RagoA. LalC.J. WangG.A. BeaudryK.M. Ciriello(1999) Analysis of human transcriptomes. Nat. Genet. 23:387–388.
- ↵V.E. VelculescuL. ZhangB. VogelsteinK.W. Kinzler(1995) Serial analysis of gene expression. Science 270:484–487.
- ↵V.E. VelculescuL. ZhangW. ZhouJ. VogelsteinM.A. BasraiD.E.J. BassettP. HieterB. VogelsteinK.W. Kinzler(1997) Characterization of the yeast transcriptome. Cell 88:243–251.
- ↵M. WatanabeA.R. ZinnD.C. PageT. Nishimoto(1993) Functional equivalence of human X- and Y-encoded isoforms of ribosomal protein S4 consistent with a role in Turner syndrome. Nat. Genet. 4:268–271.
- ↵J. WeilC.J. Epstein(1979) The effect of trisomy 21 on the patterns of polypeptide synthesis in human fibroblasts. Am. J. Hum. Genet. 31:478–488.
- ↵S. WelleK. BhattC.A. Thornton(1999) Inventory of high-abundance mRNAs in skeletal muscle of normal men. Genome Res. 9:506–513.
- ↵S.A. WhatleyC. HallA.N. DavisonL. Lim(1984) Alterations in the relative amounts of specific mRNA species in the developing human brain in Down's syndrome. Biochem. J. 220:179–187.
- ↵D.M. WilsonW.A. DeutschM.R. Kelley(1994) Drosophila ribosomal protein S3 contains an activity that cleaves DNA at apurinic/apyrimidinic sites. J. Biol. Chem. 269:25359–25364.
- ↵I.G. Wool(1979) The structure and function of eukaryotic ribosomes. Annu. Rev. Biochem. 48:719–754.
- ↵L. ZhangW. ZhouV.E. VelculescuS.E. KernR.H. HrubanS.R. HamiltonB. VogelsteinK.W. Kinzler(1997) Gene expression profiles in normal and cancer cells. Science 276:1268–1272.
- ↵A.R. ZinnR.K AlagappanL.G. BrownI. WoolD.C. Page(1994) Structure and function of ribosomal protein S4 genes on the human and mouse sex chromosomes. Mol. Cell Biol. 14:2485–2492.