Abstract
Oxford Nanopore Technologies (ONT) and Pacific Biosciences (PacBio) are generally considered free from sequence composition bias, a key factor, alongside read length, that explains their success in producing high-quality genome assemblies. Indeed, there had been very few reports of bias, the clearest one against GA-rich repeats in the human genome. However, our study reveals a systematic failure of both technologies to sequence and assemble specific exons of Drosophila melanogaster genes, indicating an overlooked limitation. Namely, multiple Y-linked exons are nearly or completely absent from raw reads produced by deep sequencing with state-of-the-art Nanopore (10.4 flow cells, 200× coverage) and PacBio (HiFi 50×). The same exons are accurately assembled using Illumina 67× coverage. We find that these missing exons are consistently located near simple satellite sequences, in which sequencing fails at multiple levels: read initiation (very few reads start within satellite regions), read elongation (satellite-containing reads are shorter on average), and basecalling (quality scores drop as sequencing enters a satellite sequence). These findings challenge the assumption that long-read technologies are unbiased and reveal a critical barrier to assembling sequences near repetitive regions. As large-scale sequencing projects move toward telomere-to-telomere assemblies in a wide range of organisms, recognizing and addressing these biases will be important to achieving truly complete and accurate genomes. Additionally, the underrepresented Y-linked exons provide a valuable benchmark for refining those sequencing technologies while improving the assembly of the highly heterochromatic and often neglected Drosophila Y Chromosome.
Long-read sequencing (LRS) technologies Pacific Biosciences (PacBio) and Oxford Nanopore Technologies (ONT) are revolutionizing genomics: They are making chromosome-level assemblies routine, and full diploid, telomere-to-telomere (T2T) assemblies are becoming the standard for human genome assemblies. LRS employs single-molecule sequencing, avoiding many biases, errors, and limitations introduced by cloning or PCR amplification, which affected previous technologies such as Sanger sequencing, Illumina, and 454. A key advantage of LRS is the ability to generate long reads, ranging from ∼20 kb to >1 Mb. Although initial versions of LRS had high error rates (12% to 20%), the latest error rates are in the range of 0.1% (PacBio HiFi) to 0.5% (ONT Q20+). Finally, LRS is believed to be nearly bias-free in terms of sequence composition (e.g., Ross et al. 2013), although a few exceptions have been noted. Nurk et al. (2020, 2022) reported a lack of PacBio HiFi sequencing coverage across GA-rich sequences found at a few sites in the human genome, and Flynn et al. (2020) found that no current technology (Illumina, PacBio, or ONT) was able to recover the ∼100 Mbp simple satellites (mostly AAACTAC) predicted to occur in the Drosophila virilis genome (Gall and Atherton 1974; Bosco et al. 2007). Despite these exceptions, LRS seems to largely fulfill the requirements of Gene Myers’ “perfect assembly” theorem, which he informally stated in tweet format: “Thm: Perfect assembly possible iff (a) errors random (b) sampling is Poisson (c) reads long enough 2 solve repeats.” (https://dazzlerblog.wordpress.com/2014/05/15/on-perfect-assembly/). The success of LRS in many organisms attests to this being generally true.
However, when the first LRS data set of Drosophila melanogaster was released (Kim et al. 2014), Carvalho and colleagues (2016) reported an unexpected failure: Several single-copy exons of the Y Chromosome were either missing or severely underrepresented in the PacBio CLR raw reads and were missing in the assemblies. This was even more surprising given that the same data set resolved two challenging regions of the Y Chromosome (Carvalho et al. 2015; Krsticevic et al. 2015). Carvalho et al. (2016) attributed this bias to the use of cesium chloride DNA purification by Kim et al. (2014), which separates DNA based on density. Because the light AT-rich sequences form a band separated from the main DNA band (satellite bands) (see Kit 1961; Rae 1970; Gall and Atherton 1974; Altemose 2022) and because some Drosophila Y-linked introns contain AT-rich satellite DNA (Kurek et al. 2000; Reugels et al. 2000), they proposed that the missing exons were inadvertently discarded along with these satellite-rich fractions. At the time, the reported sequencing bias seemed to be caused by an accidental artifact in sample preparation.
Here, we reinvestigated this question using deep sequencing data obtained with state-of-the-art LRS platforms (ONT Q20+ 400× coverage [Kim et al. 2024] and PacBio HiFi 96× coverage [Shukla et al. 2025]), in which libraries were prepared without cesium chloride purification.
Results
All LRS technologies fail in the same regions of the D. melanogaster Y Chromosome
Kim et al. (2024) recently published an extensive ONT sequencing data set of many Drosophila species, including a 400× coverage of the reference D. melanogaster strain (iso-1). The D. melanogaster data set was generated using ONT Q20+ (10.4 flow cells), which yields a ∼1% error rate. As DNA was not purified with cesium chloride centrifugation, we expected that the previously observed sequencing bias against Y-linked exons would be absent, namely, that the D. melanogaster Y-linked genes would have uniform coverage (at ∼200×; Kim et al. 2024 used males). However, as exemplified by the kl-3 gene (Fig. 1, rows 1 and 2), this was not the case; indeed, the kl-3 coverage profile in the ONT Q20+ data set was essentially identical to that observed in the earlier PacBio CLR data set (Kim et al. 2014).
Coverage of the Y-linked gene kl-3 by raw reads across different sequencing technologies. The three LRS data sets exhibit similar coverage profiles, with two regions of the kl-3 coding sequence (CDS) nearly absent in the raw reads. In contrast, these regions are well represented in the Illumina reads. The numbered bars inside the bottom graph mark exon positions. The coverage peak in exon 1 is caused by an exon duplication (release 6 scaffold armY, coordinates 347715–348740) that was collapsed in the Illumina assembly (Supplemental Fig. S1). For a similar analysis of the other Y-linked genes, see Supplemental Figure S2.
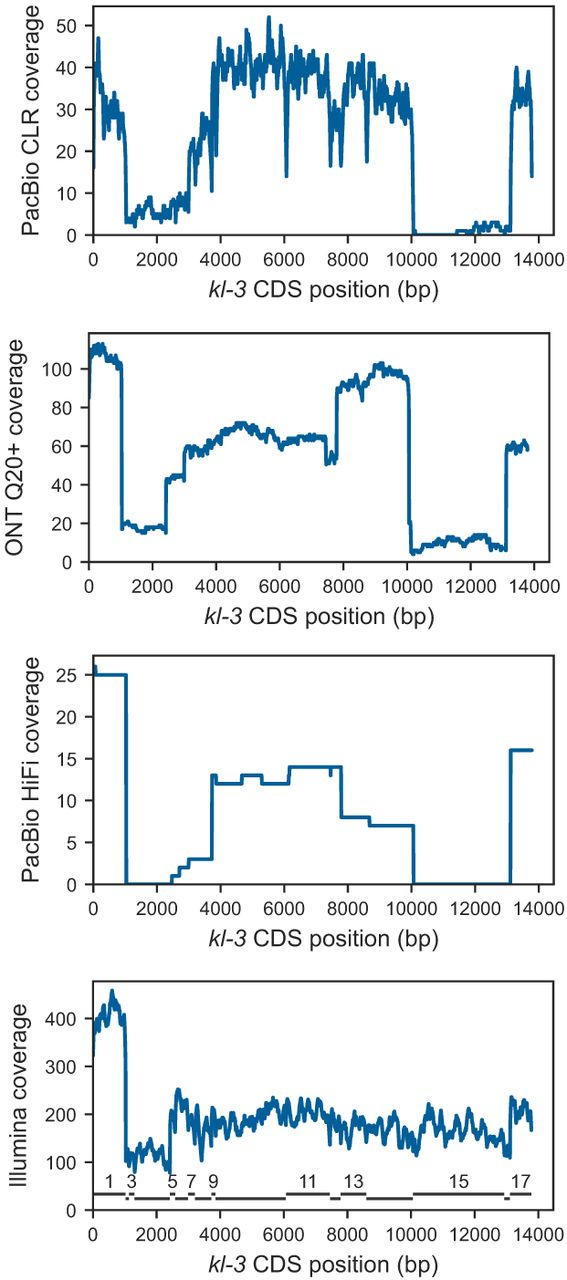
Furthermore, males of the same strain were sequenced at ∼100× coverage (∼50× for the Y Chromosome) using PacBio HiFi by Shukla et al. (2025), again without cesium chloride purification. Nevertheless, the coverage profile was essentially the same, further reinforcing the conclusion that the observed sequencing bias is not linked to the DNA purification method. As a control using short reads, we sequenced iso1 males with Illumina at high coverage (∼550×) and found that all previously missing exons were faithfully represented in the raw reads, confirming the earlier results obtained by Carvalho et al. (2016) using a smaller Illumina data set. As before, the only major “anomalies” in Illumina coverage are occasional exon duplications (e.g., exon 1 of kl-3) (visible in Fig. 1 as an Illumina coverage peak), which are fairly common in heterochromatic regions (e.g., Tobler et al. 2017; Chang and Larracuente 2019). As expected, the assembly of these strongly biased LRS data sets consistently failed to assemble many exons, whereas the Illumina assembly recovered nearly all exons (Supplemental Fig. S1). All data sets yielded fragmented assemblies as some Y-linked introns are extremely long (in the megabasepair range) and filled with repetitive DNA (Carvalho et al. 2000; Kurek et al. 2000; Reugels et al. 2000), which leads to assembly breaks. As expected, the Illumina assembly is much more fragmented owing to the short read length.
Figure 1 highlights the coverage inconsistency for the kl-3 gene; coverage of Y-linked exons is irregular in most genes (Supplemental Fig. S2), and several exons are strongly underrepresented or entirely absent (missing exons) in multiple Y-linked genes (Fig. 2). On the other hand, a few Y-linked genes (e.g., Pp1-Y1 and Pp1-Y2) display uniform and high coverage in the raw reads, showing that not all Y-linked exons are equally affected. To further assess the coverage uniformity, we looked at a random sample of 10 X-linked genes and found that all have a uniform coverage profile close to the expected 200× (Supplemental Fig. S3). To summarize, most or all X-linked and some Y-linked genes are represented in LRS reads as expected by a random (Poisson) sampling of the genome, whereas most Y-linked genes show highly irregular coverage across different exons, with some exons being nearly absent. Notably, this bias is not exclusive to the ONT data set, as these observations hold for the other LRS data sets mentioned above (PacBio CLR and PacBio HiFi).
Coverage of selected Y-linked genes in ONT raw reads (Kim et al. 2024). Pp1-Y1 and Pp1-Y2 exhibit uniform coverage, contrasting with other Y-linked genes with highly irregular coverage. The numbered bars at the top of the graphs mark exon positions (Pp1-Y1 and Pp1-Y2 are single-exon genes). Arrows point to the low-coverage exons (blue arrows) and normal-coverage exons (black arrows) that were investigated in detail. For the coverage data on additional Y-linked genes, see Supplemental Figure S2.
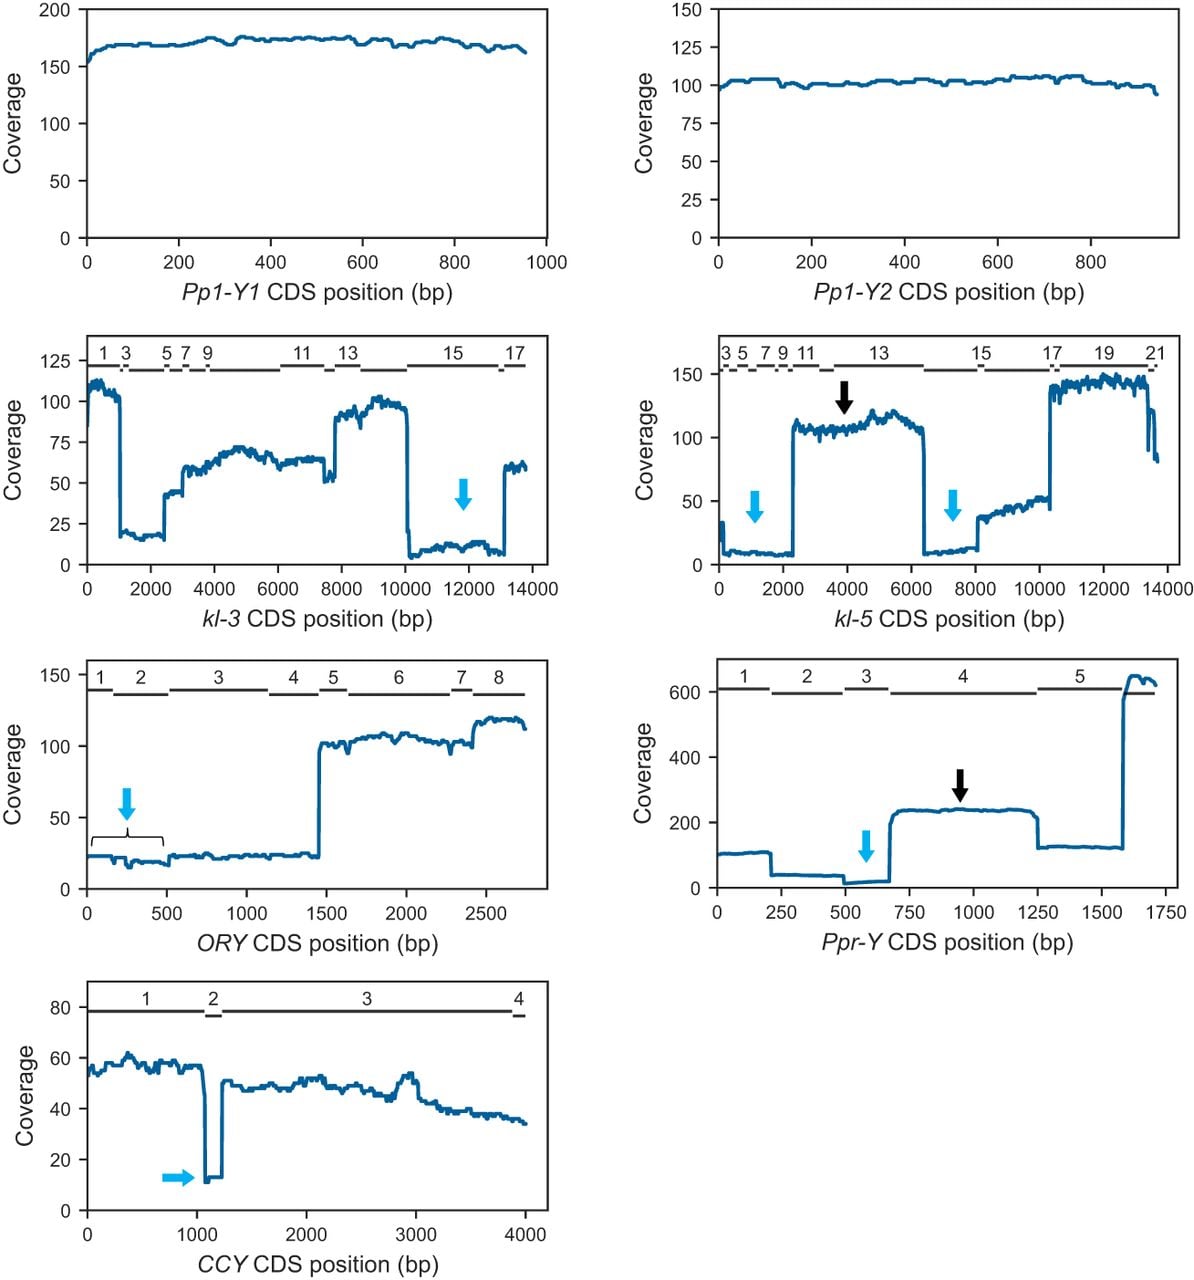
Finally, even the Pp1-Y1 and Pp1-Y2 genes, which have uniform and high coverage (160× and 100×, respectively), are below the expected coverage of ∼200×. This discrepancy is probably caused by polytenic tissues in adult males, in which heterochromatic regions are known to be severely underreplicated (Yarosh and Spradling 2014). In line with this, Flynn et al. (2020) observed that D. virilis adult whole flies contain 40% less heterochromatic satellites than fully diploid tissues (represented by imaginal discs from larvae), strongly suggesting that the underrepresentation of heterochromatin in polytenic tissues systematically lowers sequencing coverage of these regions in adult flies. This phenomenon differs from the “missing exons” we are investigating here and does not cause assembly problems.
A detailed investigation of the missing exons
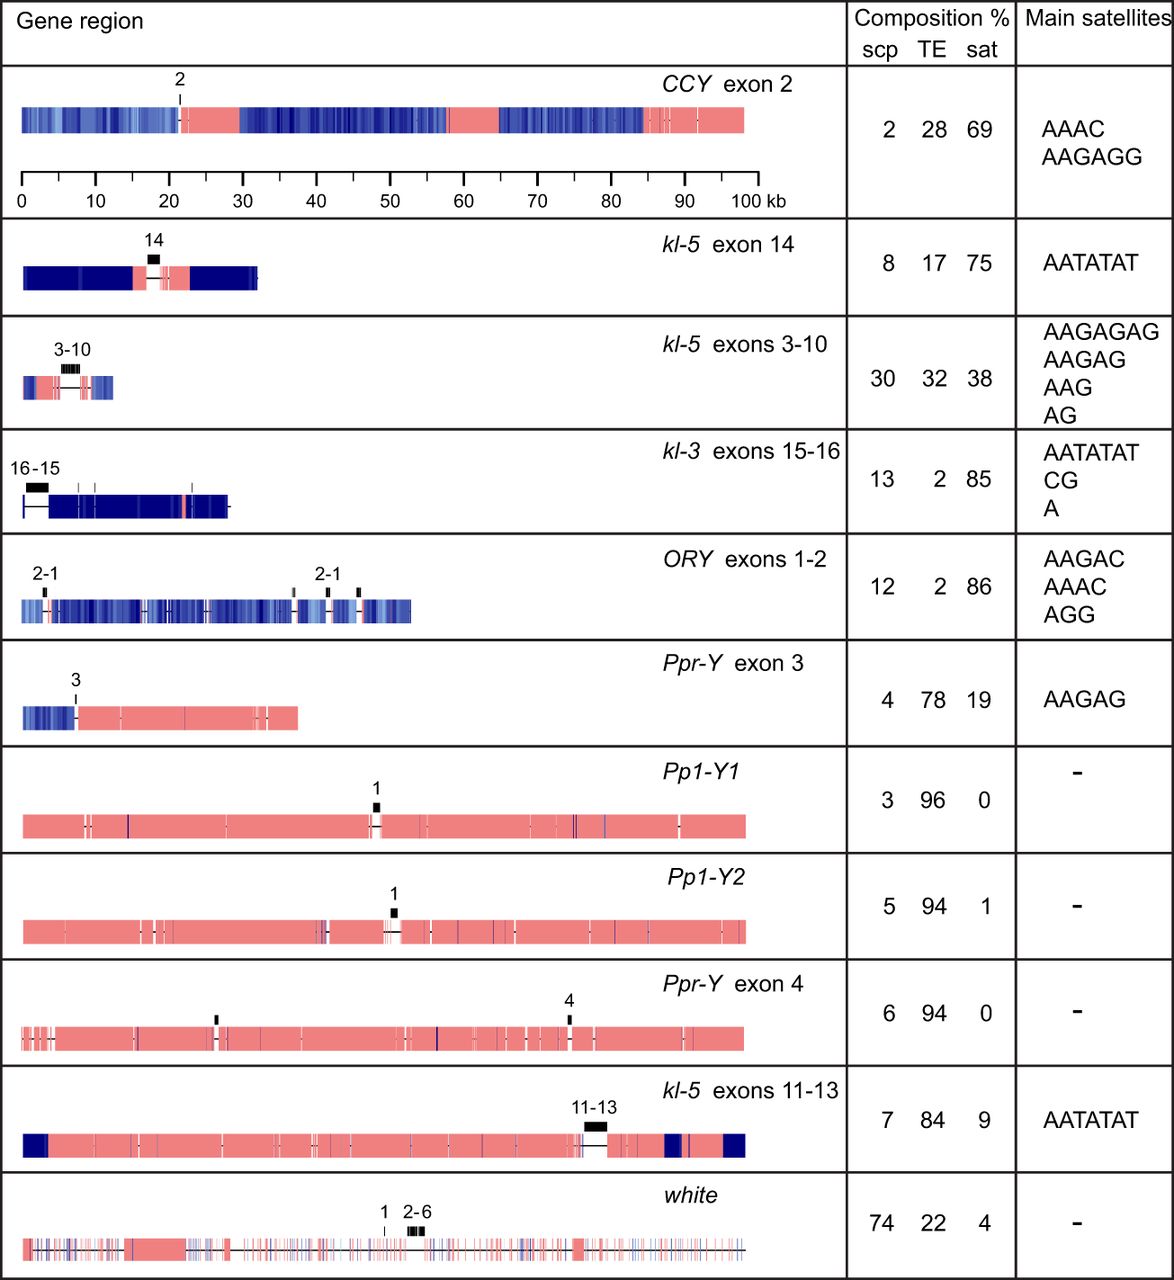
Our results show that certain regions of the D. melanogaster Y Chromosome are recalcitrant to LRS. But what exactly is inside these regions? To investigate this, we used the ONT Q20+ data set from Kim et al. (2024) as its huge coverage allowed us to recover a small number of surviving reads from the missing exons. Given the consistency of the bias across platforms, we presume that the same phenomenon is happening with the shallower PacBio CLR and PacBio HiFi data sets (Kim et al. 2014; Shukla et al. 2025). First, we used a simple BLASTN search to recover the few reads covering the missing exons (Fig. 2, blue arrows) and assembled them using a variety of approaches. Commonly used programs such as Canu (Koren et al. 2017) and Flye (Kolmogorov et al. 2019) either failed entirely or yielded very small contigs. The most effective approach we found was to tweak several parameters of miniasm (Li 2016); this yields draft assemblies of all missing exons, with contigs sizes ranging from 12 kb to 102 kb (Supplemental Methods). With these draft assemblies, we could now examine the sequence composition of these regions. As shown in Figure 3, all Y-linked exons, both those with normal coverage and those with low coverage in LRS data sets, are embedded in highly repetitive DNA (∼95% of repetitive DNA). However, there is an important difference between them: Exons that are missing or underrepresented in LRS data sets are closely associated with simple satellite sequences (e.g., (AAGAA)n, (AATATA)n), whereas exons with normal coverage are devoid (or nearly so) of satellite DNA in their vicinity. Instead, these regions are embedded in transposable elements (TEs). These consistent association patterns suggest that simple satellite DNA is the major factor disrupting LRS sequencing. For the sake of simplicity, we classified the kl-5 exon 11–13 region as a “normal coverage” region, but it actually is an intermediate case: It has satellite blocks, but they are not in close proximity to the exons (Fig. 3), the raw read statistics (discussed below) are only mildly disturbed, and it has fairly high coverage (Fig. 2).
Sequence composition of selected regions of the D. melanogaster Y Chromosome, along with a control euchromatic region (white gene). Coding exons are shown as numbered black rectangles (unlabeled when pseudogenes), transposable elements in pink, simple satellites in blue (with darker shades indicating higher AT-richness), and single-copy sequences as a thin black line. The top six regions all have very low read coverage, whereas the bottom five have approximately normal coverage. All regions are represented at approximately the same scale. In the region containing ORY exons 1–2, we could not determine which copy is functional, so we labeled both. The most abundant satellites were identified as described in the Supplemental Methods.
How does simple satellite DNA interfere with LRS?
A careful examination of the few surviving reads from the missing exons suggested several potential mechanisms underlying this sequencing bias. First, the base quality values drop precipitously as sequencing enters the satellite blocks (Supplemental Fig. S4). Because ONT sequencing software filters low-quality reads and puts them into a separate file by default, we initially reasoned that the missing Y-linked reads might be found in this low-quality subset. However, after examining these files, we found no enrichment of missing exon reads (Supplemental Table S1), ruling out read quality as the primary explanation for the missing exons.
We also noticed partial exon duplications (i.e., pseudogenes) occurring in tandem with their functional copies. In some cases, these pseudogenes are in reverse orientation in relation to their functional copies (e.g., read SRR26246282.1135981 has two copies of kl-5 exon 14 in reverse orientation). Because single-strand DNA (SSD) forms at some point in all LRS technologies, these reverse-oriented copies could theoretically generate hairpin structures that might interfere with sequencing. However, this could not be a general explanation because most missing exons lack reverse-oriented pseudogenes. Furthermore, in most cases, the reverse-oriented sequences seem to be sequencing artifacts not present in the genome (Supplemental Fig. S5).
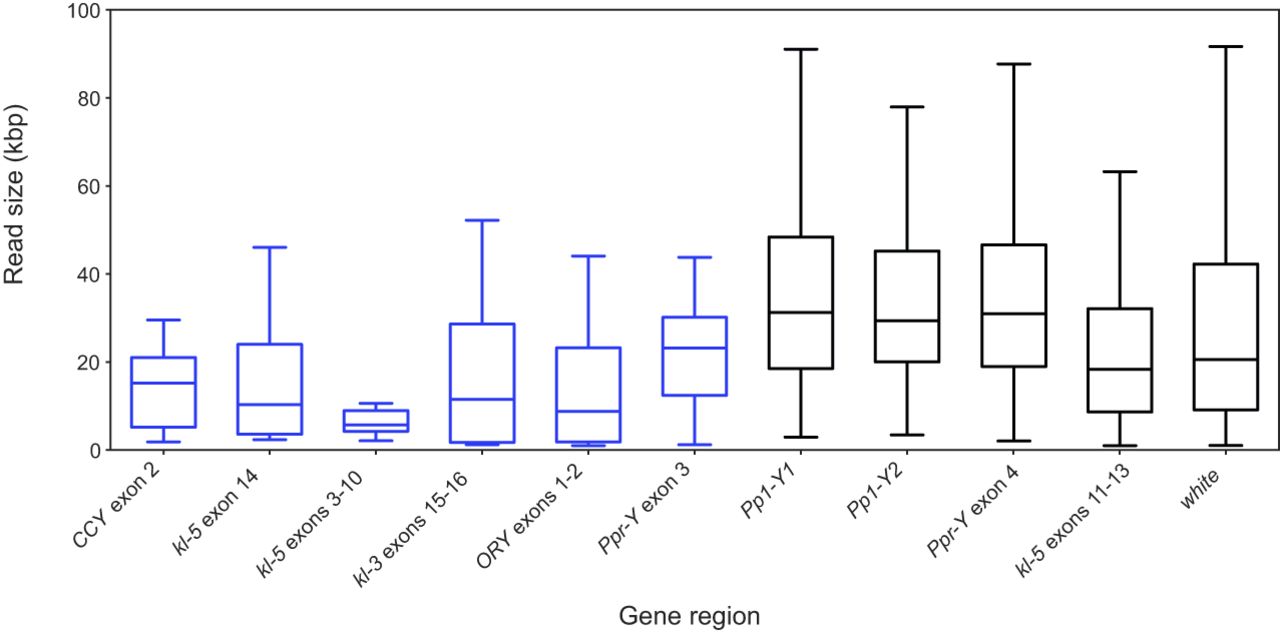
Two additional observations proved to be more fruitful. First, we found that reads from the missing exons were noticeably shorter (Fig. 4). Indeed, there is a statistically significant difference in size between them and reads from normal-coverage Y-linked regions (P = 10−4; nested ANOVA on log-transformed values). This observation strongly suggests that simple satellite sequences disturb the read traversal across the pores (read elongation for short), by either slowing it or causing a premature termination. Regardless of the precise mechanism, this effect alone would reduce the sequencing coverage in the affected regions, making exons near satellites disproportionally underrepresented. We will deal with the second observation in the next section.
Raw read size in selected regions of the D. melanogaster genome. The six Y-linked regions on the left (blue) have very low read coverages, whereas the next four Y-linked regions and the control euchromatic white gene (black) have approximately normal coverage. The difference in read size between the two groups of Y-linked regions is statistically significant (F1,8 = 93.2; P = 10−4), as are the within-group differences (F8,708 = 8.6; P < 10−5 ; nested ANOVA on log-transformed values). Note that this figure likely underestimates the association between satellite DNA and smaller read sizes because the low-coverage regions CCY exon 2 and Ppr-Y exon 3 contain a large amount of nonsatellite sequence, whereas the normal-coverage region kl-5 exons 11–13 contain satellite DNA (Fig. 3).
Satellite DNA as a barrier to read initiation
Sequencing library preparation is expected to be blind to DNA composition, and hence, all genome regions should be randomly sampled by the reads (Fleischmann et al. 1995). Consider, for example, exon 3 of the kl-5 gene: It should be sampled in both orientations (sense and antisense, or F and R) in equal numbers, namely, no strand bias. Furthermore, the location of the exon within the reads should be random, following a uniform distribution.
Two key findings indicate that the reads covering the missing exons are not a random sample of the genome. First, the exon orientation within the reads (F/R) is strongly skewed in most missing exons, deviating from the 50:50 ratio expected by theory and observed in the four Y-linked regions with normal coverage (Table 1, columns 3–4). Given the small sample sizes for the missing exons, which reduces the statistical power of individual tests, we combined the P-values (column 4) from all six missing exons using Fisher's method (Sokal and Rohlf 1995). This combined analysis rejects the null hypothesis of random exon orientation (χ2 = 25.10, 12 d.f., P = 0.014); that is, there is strand bias in these regions. In contrast, applying the same procedure to the four normal-coverage regions yields a nonsignificant P-value (χ2 = 3.37, 8 d.f., P = 0.91), confirming that forward/reverse exon orientation follows random expectations in these regions (i.e., no strand bias).
Statistical analysis of exon orientation and position in raw reads
| Region | Coverage | F/R orientation | Exon position (F) | Exon position (R) | |||
|---|---|---|---|---|---|---|---|
| Count | P | AD stats | P | AD stats | P | ||
| CCY exon 2 | Low | 3/10 | 0.092 | 3.75 | 0.013 | 1.73 | 0.131 |
| kl-5 exon 14 | Low | 6/6 | 1.000 | 8.76 | <10−3 | 4.67 | 0.005 |
| kl-5 exons 3–10 | Low | 3/9 | 0.146 | 2.36 | 0.063 | 7.63 | <10−3 |
| kl-3 exons 15–16 | Low | 6/10 | 0.455 | 10.05 | <10−3 | 20.04 | <10−3 |
| ORY exons 1–2 | Low | 4/12 | 0.077 | 0.62 | 0.621 | 1.4 | 0.204 |
| Ppr-Y exon 3 | Low | 3/15 | 0.008 | 8.62 | <10−3 | 4.26 | 0.007 |
| Pp1-Y1 | Normal | 87/76 | 0.434 | 0.86 | 0.436 | 0.72 | 0.539 |
| Pp1-Y2 | Normal | 53/47 | 0.617 | 0.33 | 0.915 | 0.48 | 0.767 |
| Ppr-Y exon 4 | Normal | 111/118 | 0.692 | 1.84 | 0.113 | 2.19 | 0.072 |
| kl-5 exons 11–13 | Normal | 69/70 | 1.000 | 33.66 | <10−3 | 33.14 | <10−3 |
[i] Note that low-coverage regions frequently display skewed exon orientation (F/R; columns 3, 4) and nonrandom exon positions (columns 5–8).
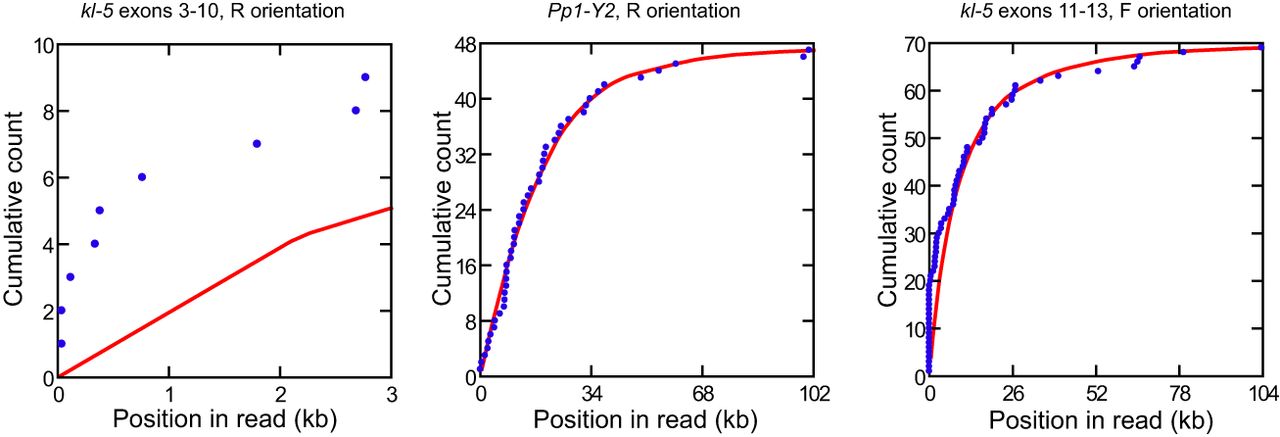
A second sign of nonrandomness in the missing exons reads is that exons seem to be frequently located at the same position within reads instead of being randomly distributed. In other words, different reads seem to start at nearly identical genomic positions. Supplemental Figures S6 and S7 illustrate this “stereotyped” pattern for the kl-3 exon 15–16 and the kl-5 exon 14 regions, respectively, with similar trends observed in most missing exons. We statistically tested this apparent departure from a uniform distribution as follows. First, we used BLASTN to obtain the distance between the start of each read and the target exon. If all reads have the same size and if read starts are random, the null hypothesis for exon positions would be a simple uniform distribution within the range [1, read size]. However, read sizes are variable, and in this case, it seems reasonable to suppose that the proper null hypothesis for n reads would be a composite of n uniform distributions, one for each read size. We confirmed this supposition through simulations, which also validated the statistical test for uniform distribution, described below (Supplemental Fig. S8; Supplemental Table S2). We then compared the observed distribution of exon positions against the null hypothesis of uniform distribution, analyzing F and R reads separately owing to the previously noted strand bias. The result using the Anderson–Darling test, which is more sensitive for small sample sizes than the Kolmogorov–Smirnov test (Razali and Yap 2011), is shown in Figure 5 and Table 1, columns 5–8 (for the results for the Kolmogorov–Smirnov test, see Supplemental Table S3). We found that most “missing exon” regions strongly depart from randomness (i.e., the hypothesis of uniform distribution of exon positions is rejected), whereas in reads from the normal-coverage regions Ppr-Y exon 4, Pp1-Y1, and Pp1-Y2, exon positions are random (i.e., follow a uniform distribution). The kl-5 exon 11–13 region is again an exception, but note that its deviations from randomness are mild (Fig. 5; Supplemental Fig. S9). As we commented before, this region has intermediate characteristics between normal- and low-coverage regions, most likely because it contains satellite DNA but not in close vicinity to the exons (Fig. 3).
Random genome sampling and read start positions. Under random genome sampling, read start points are expected to follow a uniform distribution (red lines). Exon positions within reads (blue dots) serve as a proxy for read start points in the genome. (Left) The kl-5 exons 3–10, a low-coverage region, show a strong deviation from uniformity (Anderson–Darling test: P < 10−3). (Center) Pp1-Y2, a normal-coverage region, shows very good agreement with the expected distribution (P = 0.767). (Right) kl-5 exons 11–13, another normal-coverage region, show intermediate characteristics. Note the fairly good agreement; the P-value of the Anderson–Darling test (P < 10−3) reflects the much higher statistical power in normal-coverage regions owing to their much larger number of reads. For the remaining regions see Supplemental Figure S9. Figure 5 provides a formal statistical test for the stereotyped read patterns described in Supplemental Figures S6 and S7.
The most likely explanation for this nonrandomness both in F/R exon orientation and exon position within reads is that some genomic regions surrounding missing exons have a much lower probability of serving as successful read initiation sites in ONT sequencing. As a consequence, read starts would be clustered in some genomic regions and depleted in others instead of being evenly distributed. Unless these “forbidden” genomic regions are equally present on both sides of the exon, one of the strands would be preferentially sampled; namely, there would be strand bias.
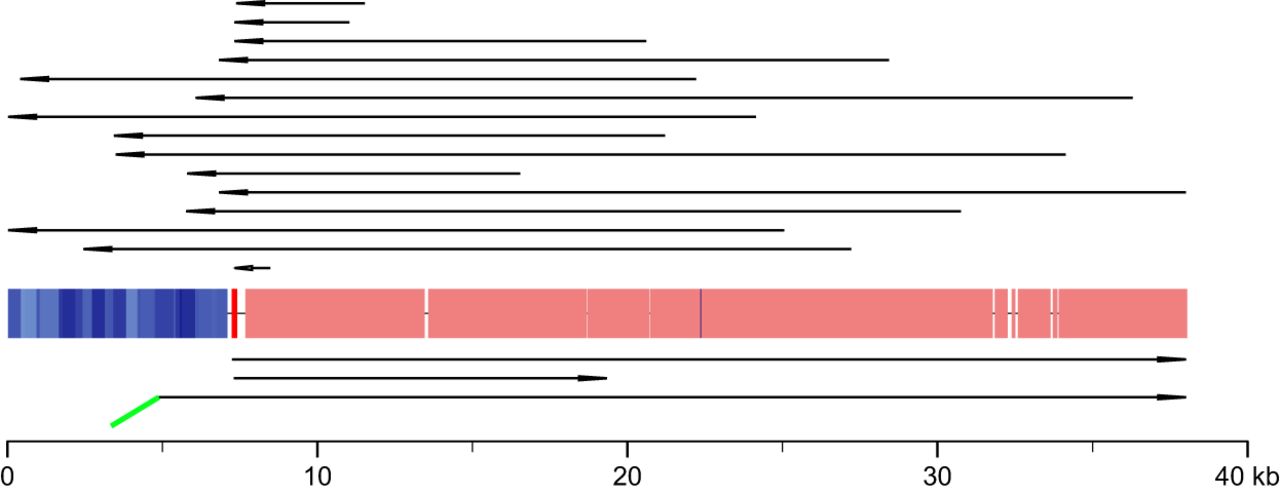
Given our previous observations (Fig. 3), the most likely culprit for this read initiation suppression is satellite DNA. We tested this hypothesis by counting for each missing exon region how many reads started within satellite blocks and how many started in other sequence types (single-copy, TEs, or the exons themselves). We then compared with a binomial test the observed number of satellite-initiating reads to their expected frequency; the latter is simply the amount of satellite DNA in the region (Fig. 3). As shown in Table 2, there is nearly complete avoidance of satellite DNA as a sequencing starting point. Among the 87 reads covering the missing exons, only one initiated within a satellite block, despite the fact that satellite DNA accounts for 37% to 86% of these regions. This is the main cause of the missing exons: When an exon is located between two large satellite blocks, the only chance of getting sequenced is when reads starts in the small “permissive” regions nearby (TE or single copy), pointing toward it. Reads starting outside the satellite blocks cannot reach the exon because it is too distant, and the satellite DNA cripples the read extension. Ppr-Y exon 3 (Fig. 6) illustrates this pattern very well: It is flanked by permissive TEs on the right side and a nonpermissive satellite block on the left, and reads only initiate in the permissive regions, never within the satellite DNA.
Sequencing bias in the Ppr-Y exon 3 region. This region has permissive transposable elements on the right side (pink) and a nonpermissive satellite block on the left (blue). The exon itself (shown in red) is flanked on both sides by two short single-copy regions (∼190 bp each; thin black line). A total of 18 reads cover the exon (black arrows), showing a strong strand bias (three forward reads:15 reverse reads) and nonuniformly distributed start points. Fifteen reads (top) originated on the right side, starting at scattered points within the TEs and extending through the exon and partially into the satellite block. Only two reads originated on the left side, both starting in the small 190 bp single-copy region between the satellite block and the exon and extending toward the exon and the TEs. The 18th read (SRR26246282.1589819, shown at the bottom) appears to originate within the satellite block but is actually a chimeric read. It begins with ∼3 kb of Chromosome 3L (a permissive sequence, shown in green) before transitioning into the end of the satellite block, reinforcing the pattern of satellite avoidance as a read start site. This avoidance explains several key observations: the low exon coverage, the strand bias, and the nonrandom exon position within reads (Table 1, columns 3–8), as read start sites are clustered outside the satellite block. We found additional chimeric or rearranged reads in other missing exons, suggesting that the scarcity of surviving reads increases the relative frequency of rare sequencing artifacts (Supplemental Fig. S5).
Avoidance of satellite DNA as starting points in ONT reads
| Region | Reads starting in sat. DNA | Reads not starting in sat. DNA | Obs. freq | Exp. freq | P |
|---|---|---|---|---|---|
| CCY exon 2 | 0 | 13 | 0.0 | 69.2 | <10−4 |
| kl-5 exons 3–10 | 0 | 12 | 0.0 | 37.5 | 0.005 |
| kl-5 exon 14 | 0 | 12 | 0.0 | 75.0 | <10−4 |
| kl-3 exons 15–16 | 0 | 16 | 0.0 | 85.0 | <10−4 |
| ORY exons 1–2 | 1 | 15 | 6.2 | 86.5 | <10−4 |
| Ppr-Y exon 3 | 0 | 18 | 0.0 | 18.7 | 0.035 |
Are there “missing exons” in non-Y-linked D. melanogaster genes?
We addressed this question by screening all D. melanogaster protein-coding genes for evidence of missing exons in two assemblies based on PacBio HiFi reads, which have lower coverage and seem more sensitive to the effect of satellite DNA (Fig. 1). The PacBio HiFi reads were assembled with hifiasm and verkko (Cheng et al. 2021; Rautiainen et al. 2023); we also examined two ONT assemblies generated with Flye (Kolmogorov et al. 2019), with different read length cutoffs (1 kb and 45 kb; the coverages are 400× and 100×). Briefly, we checked for each mRNA, the proportion of its sequence that is present in the assemblies (Supplemental Methods). The rationale for testing multiple assemblies is that autosomal genes have twice the coverage of Y-linked genes, which may mask sequencing biases on the autosomes.
We found that 21 genes (out of 13,986) exhibited missing exons in at least one of the four assemblies (Supplemental Table S4). Among the 21 genes, 10 are Y-linked, 10 are autosomal and heterochromatic (from Chromosomes 2L, 2R, 3R, and 4), and one is autosomal euchromatic. We then examined each gene region for read coverage profiles and the presence satellite blocks, following the same approach used for the Y-linked genes (e.g., Figs. 2, 3). As shown in Supplemental Figures S10–S20, three autosomal genes (including the euchromatic one) were false positives, as they showed high and uniform coverage and lacked satellite blocks in the vicinity of the exons. All three were flagged in the PacBio HiFi verkko assembly, which suggests that this assembler may be less efficient than hifiasm when handling Drosophila highly repetitive regions. The remaining eight autosomal genes (JYalpha, Marf1, DIP-lambda, CG42402, Myo81F, Pzl, Gpa2, and klhl10) had satellite blocks near the exons either within introns or in flanking intergenic regions, which were associated with clear drops in read coverage. Two autosomal genes (Gpa2 and klhl10), along with the Y-linked CG41561, were completely missing from three of the four assemblies, being recovered only in the HiFi hifiasm assembly. This is a striking demonstration of how severe the issue of long-read sequencing bias can be. Taken together, these findings show that in D. melanogaster the close proximity of coding exons to large, simple satellite blocks (and the ensuing sequencing bias) is not restricted to the Y Chromosome.
All cases of sequencing bias we detected so far involve simple satellites, with repeat units of up to 8 bp. We looked for blocks of the complex satellite 1.688 (monomer size, ∼ 359 bp), which is known to occur close to genes (Kuhn et al. 2012), and found that it does not cause a consistent and significant sequencing bias (Supplemental Fig. S21; Supplemental Results).
Non-B DNA and sequencing bias
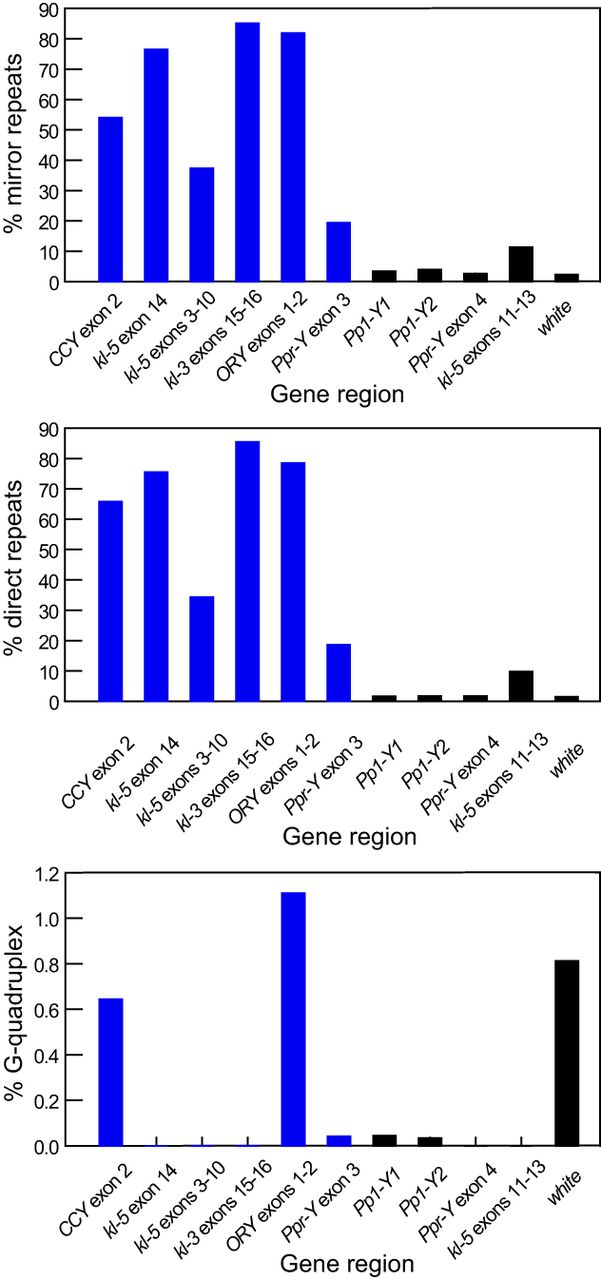
It is known that satellite DNA and other repetitive sequences can adopt alternative DNA structures (non-B DNA) such as left-handed Z-DNA, three-strand triplexes (H-DNA), four-stranded guanine quadruplexes (G4 DNA), hairpins, etc. (Matos-Rodrigues et al. 2023 and references cited therein). It is also known that non-B DNA interferes with PacBio sequencing, although the known effects are fairly subtle (Weissensteiner et al. 2023). Hence, it is possible that non-B DNA is involved in the missing exons phenomenon. As a preliminary test of this hypothesis, we searched for these structures in the low-coverage and normal-coverage regions (Fig. 3), using the “non-B DNA Motif Search Tool (nBMST) program (Cer et al. 2013). As shown in Figure 7 and Supplemental Figure S22, “direct repeats” and “mirror repeats” are the only motifs that are consistently abundant in low-coverage regions and rare in normal-coverage regions. The potential significance of these findings will be dealt with in the Discussion.
Abundance of non-B DNA motifs in low- and normal-coverage regions. Motifs were detected using the nBMST program (Cer et al. 2013). The y-axis shows the proportion of each region's sequence occupied by non-B DNA motifs. Blue bars represent low-coverage Y-linked regions; black bars correspond to normal-coverage Y-linked regions and the euchromatic control region (white gene). Note that mirror repeats and direct repeats are consistently abundant in low-coverage regions but are rare in normal-coverage regions. In contrast, guanosine quadruplex motifs, and other motif types shown in Supplemental Figure S22, do not exhibit this pattern.
Discussion
We found that large blocks of simple satellite sequences near several exons of D. melanogaster Y-linked genes severely disrupt sequencing with ONT and PacBio technologies. This disruption is so strong that the affected exons are barely present in the raw reads and are absent from the final assemblies, even at very high sequencing coverage (e.g., 200×). In contrast, the same exons are faithfully assembled in Illumina data sets, likely because the much shorter fragments employed by this technology (typically 350–600 bp) allow exons to be sampled free from any adjacent satellite DNA. The disruption mentioned above affected even the most complete assembly of the D. melanogaster Y available: Chang and Larracuente (2019), using the shallower and equally biased PacBio CLR data set from Kim et al. (2014), had to manually fill the gaps in Y-linked genes by integrating CDS sequences from FlyBase (Larkin et al. 2021).
The bias primarily affects read initiation but also impairs read extension and basecalling, with read initiation being the most critical factor. To our knowledge, this is the first systematic and in-depth analysis revealing a severe sequencing bias that affects all LRS platforms. Two previous studies (besides that of Carvalho et al. 2016) have independently detected aspects of this issue in different contexts. Flynn et al. (2020) reported that no current sequencing technology could fully recover the ∼100 Mbp simple satellites estimated to be present in the D. virilis genome (Gall and Atherton 1974; Bosco et al. 2007), with PacBio CLR recovering only 10.9 Mbp, Illumina 16.0 Mbp, and ONT 28.2 Mbp (Supplemental Discussion). They also observed that satellite sequences reduced Illumina read quality scores (other sequencing platforms were not investigated). Similarly, Nurk et al. (2020, 2022) described minor fragmentation in the first T2T human genome assembly owing to a lack of PacBio HiFi coverage across GA-rich sequences, suggesting that “this coverage bias appears to be a current weakness of the HiFi chemistry.” Although much less detail is available in these two studies, it seems likely that they share the same underlying cause with our study.
Several factors probably contributed to the near absence of prior reports on this bias. First, we could only detect it because the affected Y-linked exons served as sequence landmarks; a missing noncoding sequence in the middle of the Y Chromosome would go unnoticed unless someone is attempting a T2T assembly. Second, it affects genes in the Y Chromosome, the least known chromosome in Drosophila. Third, in the human genome (the only one with extensive T2T assemblies), the bias is much milder and largely restricted to PacBio HiFi, allowing gaps to be closed with ONT reads (Nurk et al. 2022).
This mildness initially puzzled us. One possible explanation is the small size of the satellite block; for example, the Chromosome 8 gap identified by Nurk et al. (2022) was caused by a mere 256 bp (AAAGG)n sequence. However, large blocks of simple satellites do occur in the human genome. Namely, HSat2 blocks (monomer: CATTCGATTC) reach up to 12.6 Mbp, and a Hsat3 block (monomer: CATTC) in Chromosome 9 has 27.6 Mbp (Altemose et al. 2022). How could these regions be successfully assembled whereas the Drosophila Y-linked exons were lost? We believe the key difference is sequence homogeneity. Specifically, these satellite blocks could only be sequenced and assembled because they are much less homogeneous than their Drosophila counterparts. As shown in Table 3, the longest perfect tandem repeat within the 27.6 Mpb human hsat3_9_3 block (a CATTC monomer) is only 20 units long. In contrast, despite being much smaller in total length, the unfinished sequences of Drosophila shown in Table 3 (actually, raw reads) have hundreds of perfect tandem repeats. The latter number is probably a severe underestimation because any sequencing error would artificially break a perfect repeat block. Another hint that homogeneity (rather than size) is the key problem is that the human Chromosome 8 (AAAGG)n sequence mentioned above is a perfect tandem repeat of 51 monomers. Although less detail is available for D. virilis, Flynn et al. (2020) estimated its satellite sequence identity at 98.5% to 99% in Illumina reads, lower than what we observe for D. melanogaster Y satellites. This heterogeneity might explain why D. virilis satellites were partially recovered (28.2%) in ONT reads, a much higher rate than the values observed in our D. melanogaster data set (Fig. 2). Unfortunately, the ONT data of D. virilis came from the older flow cells 9.4 with higher error rates (>5%), preventing a more precise analysis.
Homogeneity of satellite blocks in the human and D. melanogaster genomes
| Region | Monomer | Source | Size (kb) | Max. perfect tandem copies |
|---|---|---|---|---|
| hsat2_16_15 | CATTCGATTC | Chr 16: 39,523,669–52,219,756 | 12,696 kb | 3 |
| hsat3_9_3 | CATTC | Chr 9: 49,055,552–76,694,047 | 27,638 kb | 20 |
| hsat3_15_7 | CATTC | Chr 15: 5,975,857–13,968,808 | 7993 kb | 14 |
| hsat3_20_3 | CATTC | Chr 20: 32,017,136–32,969,590 | 952 kb | 16 |
| Human Chr 8 gap | AAAGG | Chr 8: 10,460,596–10,460,851 | 256 bp | 51 |
| CCY exon2 | AAAC | SRR22822929.167153 | 15 kb | 205 |
| CCY exon2 | AAGAGG | SRR26246282.1582840 | 21 kb | 146 |
| ORY exons 1–2 | AAAC | SRR22822929.1290720 | 25 kb | 156 |
| ORY exons 1–2 | AGG | SRR22822929.884744 | 20 kb | 214 |
| ORY exons 1–2 | AAGAC | SRR26246282.1534567 | 1 kb | 80 |
| Ppr-Y exon 3 | AAGAG | SRR26246282.13567 | 24 kb | 60 |
| kl-5 exons 3–10 | AAGAG | SRR26246282.641737 | 11 kb | 38 |
| kl-5 exons 3–10 | AG | SRR26246282.641737 | 11 kb | 33 |
| kl-5 exons 3–10 | AAGAGAG | SRR26246282.1229739 | 8 kb | 15 |
| kl-5 exons 3–10 | AAG | SRR26246282.1588900 | 9 kb | 19 |
| kl-5 exon 14 | AATATAT | SRR26246282.92922 | 20 kb | 764 |
| kl-3 exons 15–16 | AATATAT | SRR26246282.1283760 | 27 kb | 670 |
| kl-3 exons 15–16 | CG | SRR26246282.1283760 | 27 kb | 229 |
| kl-3 exons 15–16 | A | SRR26246282.589868 | 12 kb | 1434 |
The above findings strongly suggest that Drosophila Y-linked satellite blocks are orders of magnitude more homogeneous than the human satellites (and possibly D. virilis as well) and that the heterogeneity present in the latter prevents or at least attenuates the bias during LRS sequencing. These results also imply that a complete T2T assembly of D. melanogaster, including the Y Chromosome, will have to await improvements in sample preparation and/or sequencing technology.
It seems clear that the bias described in this paper is caused by large, highly homogeneous, simple satellite blocks that affect read initiation, read extension, and basecalling. However, what is the ultimate cause of these biases? The basecalling issue is the simplest to explain, as similar effects have been observed and explained before (Tan et al. 2022). ONT sequencing relies on detecting alterations in electrical conductance as single-stranded DNA traverses through a protein nanopore. Because the pore accommodates ∼6 nucleotides at a time, the raw signal reflects the joint effects of several bases and must be deconvoluted during basecalling. If a repeat monomer has a length close to 6 bp, it may confound the basecalling algorithm by producing minimal changes in electrical conductance. Tan et al. (2022) found that this happened with the telomeric repeats (TTAGGG)n of several organisms (e.g., humans) and demonstrated that fine-tuning the ONT basecalling models improved accuracy in telomeric regions. A similar approach could improve the sequencing of Drosophila satellites, but this would not solve the major problem, which is the near absence of reads initiating within satellite blocks (Table 2). This is the most relevant question, and we address it in the next section.
Why do reads seldom start within satellites?
The striking similarity between the PacBio and ONT coverage profiles (Fig. 1) suggests that the same underlying mechanism is responsible for low coverage in both technologies. Despite their fundamental differences—PacBio relies on a DNA polymerase and measures the fluorescence of modified DNA precursors while they are being incorporated into a nascent chain, whereas ONT measures the electrical conductance as native DNA passes through a membrane pore—one shared component stands out: T4 DNA ligase, which is used to glue sequencing adaptors in both platforms.
Evaluation of the possible role of T4 ligase is more complex than it might look at first sight. The enzyme exhibits different behaviors depending on the type of ligation (blunt ligation vs. cohesive-end ligation vs. nick ligation), and PacBio uses blunt-end ligation for gluing the SMRTbell adaptor to the target DNA (https://www.pacb.com/wp-content/uploads/2015/09/Guide-Pacific-Biosciences-Template-Preparation-and-Sequencing.pdf), whereas ONT uses a 1 bp T/A overhang ligation (SQK-LSK114; https://nanoporetech.com/document/genomic-dna-by-ligation-sqk-lsk114). Bauer et al. (2017) reported that the T4 ligase has a preference for AT/TA over GC/CG for blunt end ligation, whereas Bilotti et al. (2022) found that GC is favored in cohesive end ligations. Additionally, ligation efficiency varies significantly even among substrates with the same GC content (Fig. 1 of Bilotti et al. 2022). Given these complexities, it seems difficult to derive from the T4 ligase properties an explanation for the satellite-induced bias we observed. Finally, Jia et al. (2024) developed the LILAP method, which replaced T4 ligase by the Tn5 transposase in the main step of adaptor-target DNA ligation, and tested it on D. melanogaster (iso-1 males), allowing us to examine the effect of T4 ligase on the missing exons. As shown in Supplemental Figure S23, the sequencing bias persists in LILAP reads, albeit to a lesser extent. This reduced bias is expected because of the smaller average size of LILAP HiFi reads (∼5 kb; see comment about Illumina a few paragraphs above). One must also consider that Tn5 has its own sequence biases, which favor GC-rich regions (Kia et al. 2017), and that the LILAP protocol still includes a T4 ligase step to close the nick after the Tn5-mediated transposition. Hence, although DNA ligase remains a possible explanation for the missing exons, the limited available data do not support it as the primary cause. Perhaps the main difficulty of the T4 ligase hypothesis is that all its known preferences are short range (e.g., blunt end ligation of AT/TA vs. GC/CG ends), whereas the effect of satellite DNA on LRS technologies seems to obligatorily involve a much broader scale. For example, several satellites such as (AAAC)n and (AAAAG)n, which we found near missing exons, contain AT and GC basepairs and hence should at least partially satisfy T4 ligase requirements, and yet they seldom were used as read initiation points (Table 2). The observation that only highly homogeneous satellite blocks exhibit these effects further suggests that the mechanism at play extends beyond a few basepairs.
Non-B DNA might provide a broad scale mechanism for the effects of satellite DNA on sequencing, and as shown in Figure 7 and Supplemental Figure S22, “direct repeats” and “mirror repeats” are consistently abundant in low-coverage regions and rare in normal-coverage regions. Direct repeats can generate slipped-strand DNA structures and hairpins and are more relevant when the repeat is at least partially self-complementary, as happens in the (CAG)n and (CTG)n regions associated with some human diseases (Gacy et al. 1995; Sinden et al. 2007). Although we cannot exclude a role of these structures as a cause of “missing exons,” none of the satellites we found (Fig. 3) have strong self-complementarity. Mirror repeats (or, more precisely, homopurine–homopyrimidine mirror repeats) can form a triple-helix structure (H-DNA) when the DNA is partially denatured (usually by negative supercoiling) and the homopyrimidine single-strand folds back and associates with the duplex DNA via Hoogsteen basepairing (Mirkin et al. 1987; Hisey et al. 2024). Note that many major satellites we found at the missing exon regions are homopurine–homopyrimidine (Fig. 3). It seems that H-DNA can easily forms at mirror repeats during ONT and PacBio sequencing because both technologies produce SSD (the newly synthetized strand in PacBio and the displaced strand that is not traveling through the pore in ONT) that can fold back and associate with the duplex DNA, without supercoiling. It is also likely that a triple-helix DNA forming just ahead of the “active site” of sequencing (the DNA polymerase or the pore) would disturb or hamper the process. Indeed, H-DNA is known to cause stalling of the replication fork (Hisey et al. 2024 and references cited therein). Finally, H-DNA would nicely explain why degenerated satellites seem to be unharmful (Table 3), as a few symmetry-breaking substitutions can abolish H-DNA formation (Mirkin et al. 1987). One way to test the hypothesis that H-DNA causes the “missing exons” problem and, perhaps solve it, would be to add a SSD-binding protein or an SSD-specific nuclease to the sequencing mix. Both enzymes are commercially available, and SSD-binding proteins are indeed used to increase yield and accuracy in PCR templates prone to secondary structures (Kur et al. 2005).
Besides ligase and non-B DNA, there are other possible explanations for the “missing exons.” Satellite DNA might be more resistant to shearing, reducing the number of reads that initiate in these regions. Indeed, Illumina sequencing bias seems to stem largely from DNA fragmentation biases, as sonication or nebulization (two commonly used fragmentation methods) preferentially induces breaks in the middle of CG dinucleotides (Poptsova et al. 2014). Library preparation for LRS is always very gentle, which may facilitate a DNA fragmentation bias. It also occurred to us that most protocols for LRS library preparation use a size-selection buffer that selectively precipitates large DNA fragments; it is quite possible that satellite DNA does not behave as “normal” DNA in this respect and gets lost along with the “missing exons.”
Although we focused more on the characterization and mechanistic aspects of the “missing exons,” there are other interesting (and more directly biological) questions. The strong biases caused by satellite DNA must be related to its poorly known properties in vitro and possibly in vivo. The data shown in Figure 3 allow us to start looking at the sequence level at these mysterious regions of the Drosophila Y Chromosome in which protein-coding exons are embedded in huge blocks of intronic satellite DNA (Kurek et al. 2000; Reugels et al. 2000) and yet are properly transcribed and spliced (Fingerhut et al. 2024). A complete assembly of the Drosophila Y is bound to shed light on some of these mysteries.
The phenomenon of missing exons has obvious relevance for genomics and sequence technology; it most likely is not unique to Drosophila, and it is probably a matter of time before other cases of “missing exons” or unclosable gaps in assemblies are discovered or recognized. We hope that this study stimulates both further investigations into its ultimate cause and improvements in sequence technology and that eventually a T2T assembly of the Drosophila Y Chromosome becomes feasible.
Methods
Raw reads
The raw reads used in this work are listed in Supplemental Table S5. All data sets were obtained from adult D. melanogaster males of the reference strain iso-1. For the Illumina data set, we extracted DNA from 40 freshly collected iso-1 males using the Wizard genomic DNA purification kit (Promega A1120), following the manufacturer's recommendations. Library preparation and sequencing were performed at Macrogen (Korea), using the Illumina TruSeq Nano DNA PCR-free library protocol, 151 bp paired-end, with a 350 bp insert size. Assuming a 180 Mbp genome, the raw coverage was 548× (274× for the X and Y Chromosomes); the corresponding values for ONT were 406× (203× for the X and Y Chromosomes) and for PacBio HiF 96× (48× for the X and Y Chromosomes). The ONT sequencing runs were performed in late 2022. The original basecalling was performed using Guppy (version 6) basecaller with the [email protected] (superaccuracy) model. Prior all analysis, reads <1 kb were excluded, and the adaptors were removed using porechop_abi (Bonenfant et al. 2023) with the settings ‐‐ab_initio ‐‐no_split (we did this in part because adaptor sequences would interfere with read start point analysis) (e.g., Table 2).
Genome assemblies
Genome assemblers usually work well around 100× coverage and very high coverages can be detrimental, so we downsampled the ONT and Illumina reads for assembly purposes only. Exon coverages shown, for example, in Figures 1 and 2, were measured with all reads.
Illumina
The Illumina raw reads were first processed using Trim Galore! (version 0.6.6) with Phred 33, a minimum read length of 77, and a stringency value of 4. We used seqtk (https://github.com/lh3/seqtk) to reduce the original 548× coverage to 137× (67× for X and Y). Assembly was performed using SPAdes version 3.15.3 (Bankevich et al. 2012) with the default parameters. The final assembly was cleaned from contaminants using the FCS-GX program (Astashyn et al. 2024).
ONT
We started from the 406× data set of Kim et al. (2024). We found that perhaps because of excess coverage, a better assembly was obtained by removing reads <45 kb. This resulted in ∼100× coverage. The genome was then assembled using Flye (version 2.9.5) with the ‐‐nano-hq option. During the work, we found that satellite-containing Y-linked reads are shorter, so the above size selection could be detrimental for the assembly of Y-linked genes. Given this possibility we also used a 1 kb size cutoff and used both assemblies while searching for missing exons. As shown in Supplemental Table S4, Y-linked missing exons occur in both assemblies, and the 1 kb cutoff assembly was even worse than the 45 kb one.
PacBio HiFi
The original 96× read data set was assembled with both hifiasm (Cheng et al. 2021) and verkko (Rautiainen et al. 2023), using the default parameters.
Assembly of “missing exons” contigs
Normal-coverage regions of the Y Chromosome were successfully assembled into large contigs using ONT reads (Kim et al. 2024) and Flye (Kolmogorov et al. 2019), as described above. However, all low-coverage regions were absent from this assembly, which was how we initially identified them. To reconstruct these missing exons, we used a targeted assembly approach. First, we used a BLASTN search using the CDS of each “missing exon” as the query and the ONT reads as the database and pulled all matching reads (we found 12 to 18 reads for each region). This procedure reduced assembly complexity by including only reads from the region of interest. We initially attempted to assemble each region separately, using Canu (Koren et al. 2017) and Flye (Kolmogorov et al. 2019), with very poor results (small contigs or no contig at all; it must be added that these tools were not designed for local assembly of highly repetitive regions, under shallow coverage). Using minimap/miniasm (Li 2016) and after trial and error on several parameters (including the undocumented parameter -S, which skips the last steps of miniasm), we eventually succeeded in assembling all “missing exon” regions into contigs ranging from 12 kb to 102 kb. Another helpful procedure was to remove before the assembly the reads that clearly are chimeric or rearranged (e.g., Supplemental Fig. S5). Finally, as miniasm does not have a consensus step, we performed it using racon (Vaser et al. 2017). These steps are detailed in the Supplemental Methods. The polished assembly of the “missing exons” (which should be considered draft assemblies) is available at GitHub (https://github.com/bernardo1963/missing_exons). We also deposited there the sequences containing the normal-coverage exons along with ∼ 50 kb of flanking sequence on each side; these were used in comparisons with the low-coverage regions (e.g., Fig. 3). These sequences were extracted from the Flye whole-genome assemblies mentioned above.
Statistical procedures
Most statistical tests were performed using SYSTAT 13 (nested ANOVA) or custom Python scripts based on the statistics and scipy.stats libraries (scripts are available at GitHub [https://github.com/bernardo1963/missing_exons]). For the Anderson–Darling test, we could not find a program or Python library that allows for a user-specified null hypothesis. To address this, we implemented the Anderson–Darling statistic in Python, allowing for a user-specified null hypothesis. We obtained the P-value corresponding to the Anderson–Darling statistic by calling a modified version of the program AnDarl.c (Marsaglia and Marsaglia 2004). These procedures are implemented in the missingExon_stat_1jan2025.py script, which is available at GitHub (https://github.com/bernardo1963/missing_exons).
Detection of repetitive sequences
We ran Censor (Kohany et al. 2006) locally in order to detect and classify repetitive sequences (TEs and satellite DNA) present in the raw reads and assembled contigs. We found that several simple satellite repeats that are abundant in the “missing exon” contigs (e.g., (AATATAT)n) were not detected by Censor owing to their absence in its internal reference library (file smprep.ref). We fixed this problem by replacing the smprep.ref file with a complete, nonredundant list of all possible satellites up to 8 bp (file satellite_8_pass2.fasta, available at GitHub [https://github.com/bernardo1963/missing_exons]). Even then, we later found that Censor sometimes misidentify the simple satellites. We wrote a Python script (find_tandem_repeats_v2.py) based on a regular expression that finds any perfect tandem repeat (head-to-tail) present in a DNA sequence (McGinty et al. 2025). This approach is more reliable and was used to detect the most abundant satellites reported in Figure 3 and Table 3 (see Supplemental Methods).
Read coverage estimation
We obtained the read coverage data (e.g., Fig. 1) by doing a BLASTN search of the CDS of the target genes against databases of sequencing reads (ONT, Illumina, etc.). The output was saved in tabular format (m8) and processed using a Python custom script that reports the per base coverage and produces graphical representations of the data (read_coverage_CDS_v6.py; available at GitHub [https://github.com/bernardo1963/missing_exons]). We used WU-blast but obtained essentially the same results when using NCBI BLAST. We have not used BWA (Li and Durbin 2009) or similar read aligner programs because they all assume that the reference sequence contains all sequences present in the reads. This assumption was violated in our case, as we aligned genomic reads against a reference set of Drosophila CDS sequences rather than a complete genome assembly (which is not available for Drosophila).
Data access
The Illumina raw reads generated in this study have been submitted to the NCBI BioProject database (https://www.ncbi.nlm.nih.gov/bioproject/) under accession number PRJNA1227112. All the essential computing codes, examples of their usage, related programs, scripts, and data files are available at GitHub (https://github.com/bernardo1963/missing_exons) and as Supplemental Code.
Competing interest statement
The authors declare no competing interests.
Acknowledgments
We thank Gustavo Kuhn, Cristiano Lazoski, Rodrigo Nunes, Thyago Vanderlinde, and our laboratory members for valuable suggestions during this work, as well as Jullien Flynn for help with the D. virilis data. We thank the three anonymous reviewers who offered excellent suggestions that greatly improved the manuscript. This research was funded by FAPERJ–Fundação Carlos Chagas Filho de Amparo à Pesquisa do Estado do Rio de Janeiro, grant CNE2018; CNPq–Conselho Nacional de Desenvolvimento Científico e Tecnológico, grant INCT-EM; and the Wellcome Trust, grant 207486/Z/17/Z, to A.B.C. F.U. is supported by CAPES–Coordenação de Aperfeiçoamento de Pessoal de Nível Superior, Finance Code 001.
Author contributions: Conceptualization and methodology were by A.B.C. Investigation and formal analysis were by A.B.C. and F.U. Data production was by A.B.C. and B.Y.K. Data curation was by A.B.C. and F.U. Writing of the original draft preparation was by A.B.C. Reviewing and editing were by A.B.C., F.U., and B.Y.K. Funding was by A.B.C. All authors have read and agreed to the submitted version of the manuscript.
Notes
[2] Supplementary material [Supplemental material is available for this article.]
[3] Article published online before print. Article, supplemental material, and publication date are at https://www.genome.org/cgi/doi/10.1101/gr.280604.125.
References
- ↵Altemose N. 2022. A classical revival: Human satellite DNAs enter the genomics era. Semin Cell Dev Biol 128: 2–14. 10.1016/j.semcdb.2022.04.012
- ↵Altemose N, Logsdon GA, Bzikadze AV, Sidhwani P, Langley SA, Caldas GV, Hoyt SJ, Uralsky L, Ryabov FD, Shew CJ, 2022. Complete genomic and epigenetic maps of human centromeres. Science 376: eabl4178. 10.1126/science.abl4178
- ↵Astashyn A, Tvedte ES, Sweeney D, Sapojnikov V, Bouk N, Joukov V, Mozes E, Strope PK, Sylla PM, Wagner L, 2024. Rapid and sensitive detection of genome contamination at scale with FCS-GX. Genome Biol 25: 60. 10.1186/s13059-024-03198-7
- ↵Bankevich A, Nurk S, Antipov D, Gurevich AA, Dvorkin M, Kulikov AS, Lesin VM, Nikolenko SI, Pham S, Prjibelski AD, 2012. SPAdes: a new genome assembly algorithm and its applications to single-cell sequencing. J Comput Biol 19: 455–477. 10.1089/cmb.2012.0021
- ↵Bauer RJ, Zhelkovsky A, Bilotti K, Crowell LE, Evans TCJr, McReynolds LA, Lohman GJS. 2017. Comparative analysis of the end-joining activity of several DNA ligases. PLoS One 12: e0190062. 10.1371/journal.pone.0190062
- ↵Bilotti K, Potapov V, Pryor JM, Duckworth AT, Keck JL, Lohman GJS. 2022. Mismatch discrimination and sequence bias during end-joining by DNA ligases. Nucleic Acids Res 50: 4647–4658. 10.1093/nar/gkac241
- ↵Bonenfant Q, Noé L, Touzet H. 2023. Porechop_ABI: discovering unknown adapters in Oxford Nanopore Technology sequencing reads for downstream trimming. Bioinform Adv 3: vbac085. 10.1093/bioadv/vbac085
- ↵Bosco G, Campbell P, Leiva-Neto JT, Markow TA. 2007. Analysis of Drosophila species genome size and satellite DNA content reveals significant differences among strains as well as between species. Genetics 177: 1277–1290. 10.1534/genetics.107.075069
- ↵Carvalho AB, Lazzaro BP, Clark AG. 2000. Y chromosomal fertility factors kl-2 and kl-3 of Drosophila melanogaster encode dynein heavy chain polypeptides. Proc Natl Acad Sci 97: 13239–13244. 10.1073/pnas.230438397
- ↵Carvalho AB, Vicoso B, Russo CA, Swenor B, Clark AG. 2015. Birth of a new gene on the Y chromosome of Drosophila melanogaster. Proc Natl Acad Sci 112: 12450–12455. 10.1073/pnas.1516543112
- ↵Carvalho AB, Dupim EG, Goldstein G. 2016. Improved assembly of noisy long reads by k-mer validation. Genome Res 26: 1710–1720. 10.1101/gr.209247.116
- ↵Cer RZ, Donohue DE, Mudunuri US, Temiz NA, Loss MA, Starner NJ, Halusa GN, Volfovsky N, Yi M, Luke BT, 2013. Non-B DB v2.0: a database of predicted non-B DNA-forming motifs and its associated tools. Nucleic Acids Res 41: D94–D100. 10.1093/nar/gks955
- ↵Chang CH, Larracuente AM. 2019. Heterochromatin-enriched assemblies reveal the sequence and organization of the Drosophila melanogaster Y chromosome. Genetics 211: 333–348. 10.1534/genetics.118.301765
- ↵Cheng H, Concepcion GT, Feng X, Zhang H, Li H. 2021. Haplotype-resolved de novo assembly using phased assembly graphs with hifiasm. Nat Methods 18: 170–175. 10.1038/s41592-020-01056-5
- ↵Fingerhut JM, Lannes R, Whitfield TW, Thiru P, Yamashita YM. 2024. Co-transcriptional splicing facilitates transcription of gigantic genes. PLoS Genet 20: e1011241. 10.1371/journal.pgen.1011241
- ↵Fleischmann RD, Adams MD, White O, Clayton RA, Kirkness EF, Kerlavage AR, Bult CJ, Tomb JF, Dougherty BA, Merrick JM, 1995. Whole-genome random sequencing and assembly of Haemophilus influenzae Rd. Science 269: 496–512. 10.1126/science.7542800
- ↵Flynn JM, Long M, Wing RA, Clark AG. 2020. Evolutionary dynamics of abundant 7-bp satellites in the genome of Drosophila virilis. Mol Biol Evol 37: 1362–1375. 10.1093/molbev/msaa010
- ↵Gacy AM, Goellner G, Juranić N, Macura S, McMurray CT. 1995. Trinucleotide repeats that expand in human disease form hairpin structures in vitro. Cell 81: 533–540. 10.1016/0092-8674(95)90074-8
- ↵Gall JG, Atherton DD. 1974. Satellite DNA sequences in Drosophila virilis. J Mol Biol 85: 633–664. 10.1016/0022-2836(74)90321-0
- ↵Hisey JA, Masnovo C, Mirkin SM. 2024. Triplex H-DNA structure: the long and winding road from the discovery to its role in human disease. NAR Mol Med 1: ugae024. 10.1093/narmme/ugae024
- ↵Jia H, Tan S, Cai Y, Guo Y, Shen J, Zhang Y, Ma H, Zhang Q, Chen J, Qiao G, 2024. Low-input PacBio sequencing generates high-quality individual fly genomes and characterizes mutational processes. Nat Commun 15: 5644. 10.1038/s41467-024-49992-6
- ↵Kia A, Gloeckner C, Osothprarop T, Gormley N, Bomati E, Stephenson M, Goryshin I, He MM. 2017. Improved genome sequencing using an engineered transposase. BMC Biotechnol 17: 6. 10.1186/s12896-016-0326-1
- ↵Kim KE, Peluso P, Babayan P, Yeadon PJ, Yu C, Fisher WW, Chin C-S, Rapicavoli NA, Rank DR, Li J, 2014. Long-read, whole-genome shotgun sequence data for five model organisms. Sci Data 1: 140045. 10.1038/sdata.2014.45
- ↵Kim BY, Gellert HR, Church SH, Suvorov A, Anderson SS, Barmina O, Beskid SG, Comeault AA, Crown KN, Diamond SE, 2024. Single-fly genome assemblies fill major phylogenomic gaps across the Drosophilidae Tree of Life. PLoS Biol 22: e3002697. 10.1371/journal.pbio.3002697
- ↵Kit S. 1961. Equilibrium sedimentation in density gradients of DNA preparations from animal tissues. J Mol Biol 3: 711–716, IN1-IN2. 10.1016/S0022-2836(61)80075-2
- ↵Kohany O, Gentles AJ, Hankus L, Jurka J. 2006. Annotation, submission and screening of repetitive elements in Repbase: RepbaseSubmitter and Censor. BMC Bioinformatics 7: 474. 10.1186/1471-2105-7-474
- ↵Kolmogorov M, Yuan J, Lin Y, Pevzner PA. 2019. Assembly of long, error-prone reads using repeat graphs. Nat Biotechnol 37: 540–546. 10.1038/s41587-019-0072-8
- ↵Koren S, Walenz BP, Berlin K, Miller JR, Bergman NH, Phillippy AM. 2017. Canu: scalable and accurate long-read assembly via adaptive k-mer weighting and repeat separation. Genome Res 27: 722–736. 10.1101/gr.215087.116
- ↵Krsticevic FJ, Schrago CG, Carvalho AB. 2015. Long-read single molecule sequencing to resolve tandem gene copies: The Mst77Y region on the Drosophila melanogaster Y chromosome. G3 (Bethesda) 5: 1145–1150. 10.1534/g3.115.017277
- ↵Kuhn GC, Küttler H, Moreira-Filho O, Heslop-Harrison JS. 2012. The 1.688 repetitive DNA of Drosophila: concerted evolution at different genomic scales and association with genes. Mol Biol Evol 29: 7–11. 10.1093/molbev/msr173
- ↵Kur J, Olszewski M, Długołecka A, Filipkowski P. 2005. Single-stranded DNA-binding proteins (SSBs): sources and applications in molecular biology. Acta Biochim Pol 52: 569–574. 10.18388/abp.2005_3416
- ↵Kurek R, Reugels AM, Lammermann U, Bünemann H. 2000. Molecular aspects of intron evolution in dynein encoding mega- genes on the heterochromatic Y chromosome of Drosophila sp. Genetica 109: 113–123. 10.1023/A:1026552604229
- ↵Larkin A, Marygold SJ, Antonazzo G, Attrill H, Dos Santos G, Garapati PV, Goodman JL, Gramates LS, Millburn G, Strelets VB, 2021. FlyBase: updates to the Drosophila melanogaster knowledge base. Nucleic Acids Res 49: D899–D907. 10.1093/nar/gkaa1026
- ↵Li H. 2016. Minimap and miniasm: fast mapping and de novo assembly for noisy long sequences. Bioinformatics 32: 2103–2110. 10.1093/bioinformatics/btw152
- ↵Li H, Durbin R. 2009. Fast and accurate short read alignment with Burrows–Wheeler transform. Bioinformatics 25: 1754–1760. 10.1093/bioinformatics/btp324
- ↵Marsaglia G, Marsaglia J. 2004. Evaluating the Anderson-Darling distribution. J Stat Softw 9: 1–5. 10.18637/jss.v009.i02
- ↵Matos-Rodrigues G, Hisey JA, Nussenzweig A, Mirkin SM. 2023. Detection of alternative DNA structures and its implications for human disease. Mol Cell 83: 3622–3641. 10.1016/j.molcel.2023.08.018
- ↵McGinty R, Lyskova A, Mirkin SM. 2025. The origin of mirror repeats in the human genome. Nucleic Acids Res 53: gkaf619. 10.1093/nar/gkaf619
- ↵Mirkin SM, Lyamichev VI, Drushlyak KN, Dobrynin VN, Filippov SA, Frank-Kamenetskii MD. 1987. DNA h form requires a homopurine-homopyrimidine mirror repeat. Nature 330: 495–497. 10.1038/330495a0
- ↵Nurk S, Walenz BP, Rhie A, Vollger MR, Logsdon GA, Grothe R, Miga KH, Eichler EE, Phillippy AM, Koren S. 2020. HiCanu: accurate assembly of segmental duplications, satellites, and allelic variants from high-fidelity long reads. Genome Res 30: 1291–1305. 10.1101/gr.263566.120
- ↵Nurk S, Koren S, Rhie A, Rautiainen M, Bzikadze AV, Mikheenko A, Vollger MR, Altemose N, Uralsky L, Gershman A, 2022. The complete sequence of a human genome. Science 376: 44–53. 10.1126/science.abj6987
- ↵Poptsova MS, Il'icheva IA, Nechipurenko DY, Panchenko LA, Khodikov MV, Oparina NY, Polozov RV, Nechipurenko YD, Grokhovsky SL. 2014. Non-random DNA fragmentation in next-generation sequencing. Sci Rep 4: 4532. 10.1038/srep04532
- ↵Rae PM. 1970. Chromosomal distribution of rapidly reannealing DNA in Drosophila melanogaster. Proc Natl Acad Sci 67: 1018–1025. 10.1073/pnas.67.2.1018
- ↵Rautiainen M, Nurk S, Walenz BP, Logsdon GA, Porubsky D, Rhie A, Eichler EE, Phillippy AM, Koren S. 2023. Telomere-to-telomere assembly of diploid chromosomes with verkko. Nat Biotechnol 41: 1474–1482. 10.1038/s41587-023-01662-6
- ↵Razali NM, Yap BW. 2011. Power comparisons of Shapiro-Wilk, Kolmogorov-Smirnov, Lilliefors and Anderson-Darling tests. J Stat Model Anal 2: 21–33.
- ↵Reugels AM, Kurek R, Lammermann U, Bünemann H. 2000. Mega-introns in the dynein gene DhDhc7(Y) on the heterochromatic Y chromosome give rise to the giant threads loops in primary spermatocytes of Drosophila hydei. Genetics 154: 759–769. 10.1093/genetics/154.2.759
- ↵Ross MG, Russ C, Costello M, Hollinger A, Lennon NJ, Hegarty R, Nusbaum C, Jaffe DB. 2013. Characterizing and measuring bias in sequence data. Genome Biol 14: R51. 10.1186/gb-2013-14-5-r51
- ↵Shukla HG, Chakraborty M, Emerson JJ. 2025. Genetic variation in recalcitrant repetitive regions of the Drosophila melanogaster genome. Genome Res 35: 2023–2040. 10.1101/gr.280728.125
- ↵Sinden RR, Pytlos-Sinden MJ, Potaman VN. 2007. Slipped strand DNA structures. Front Biosci 12: 4788–4799. 10.2741/2427
- ↵Sokal RR, Rohlf FJ. 1995. Biometry: the principles and practice of statistics in biological research. W.H. Freeman, New York.
- ↵Tan KT, Slevin MK, Meyerson M, Li H. 2022. Identifying and correcting repeat-calling errors in nanopore sequencing of telomeres. Genome Biol 23: 180. 10.1186/s13059-022-02751-6
- ↵Tobler R, Nolte V, Schlötterer C. 2017. High rate of translocation-based gene birth on the Drosophila Y chromosome. Proc Natl Acad Sci 114: 11721–11726. 10.1073/pnas.1706502114
- ↵Vaser R, Sović I, Nagarajan N, Šikić M. 2017. Fast and accurate de novo genome assembly from long uncorrected reads. Genome Res 27: 737–746. 10.1101/gr.214270.116
- ↵Weissensteiner MH, Cremona MA, Guiblet WM, Stoler N, Harris RS, Cechova M, Eckert KA, Chiaromonte F, Huang YF, Makova KD. 2023. Accurate sequencing of DNA motifs able to form alternative (non-B) structures. Genome Res 33: 907–922. 10.1101/gr.277490.122
- ↵Yarosh W, Spradling AC. 2014. Incomplete replication generates somatic DNA alterations within Drosophila polytene salivary gland cells. Genes Dev 28: 1840–1855. 10.1101/gad.245811.114