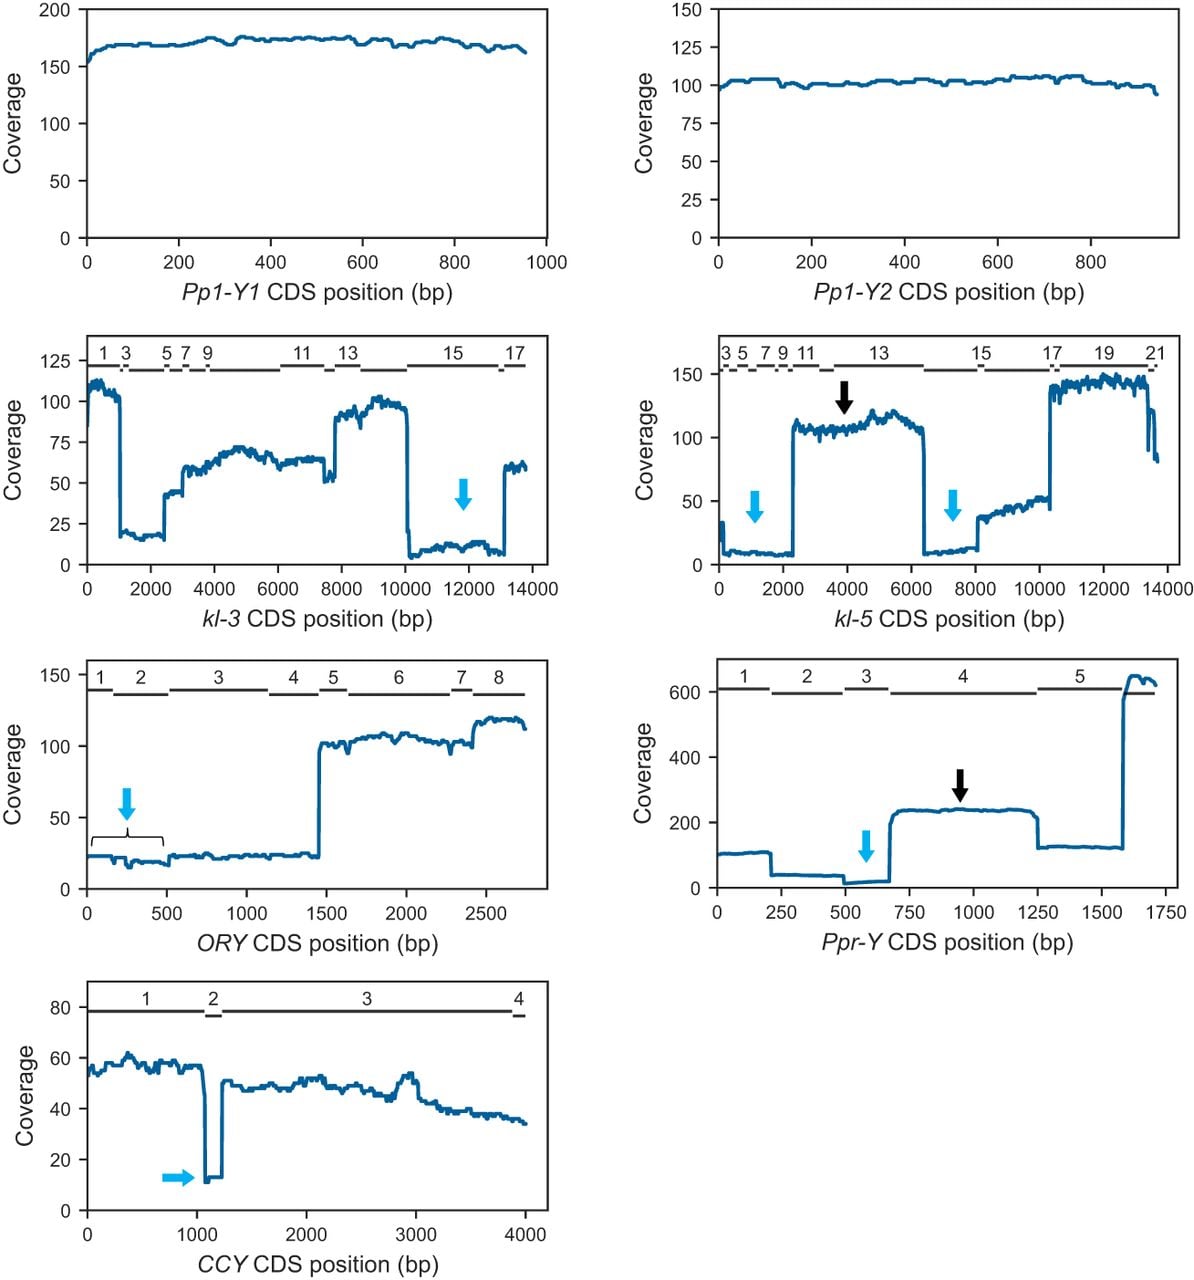
Figure 2.
Coverage of selected Y-linked genes in ONT raw reads (Kim et al. 2024). Pp1-Y1 and Pp1-Y2 exhibit uniform coverage, contrasting with other Y-linked genes with highly irregular coverage. The numbered bars at the top of the graphs mark exon positions (Pp1-Y1 and Pp1-Y2 are single-exon genes). Arrows point to the low-coverage exons (blue arrows) and normal-coverage exons (black arrows) that were investigated in detail. For the coverage data on additional Y-linked genes, see Supplemental Figure S2.