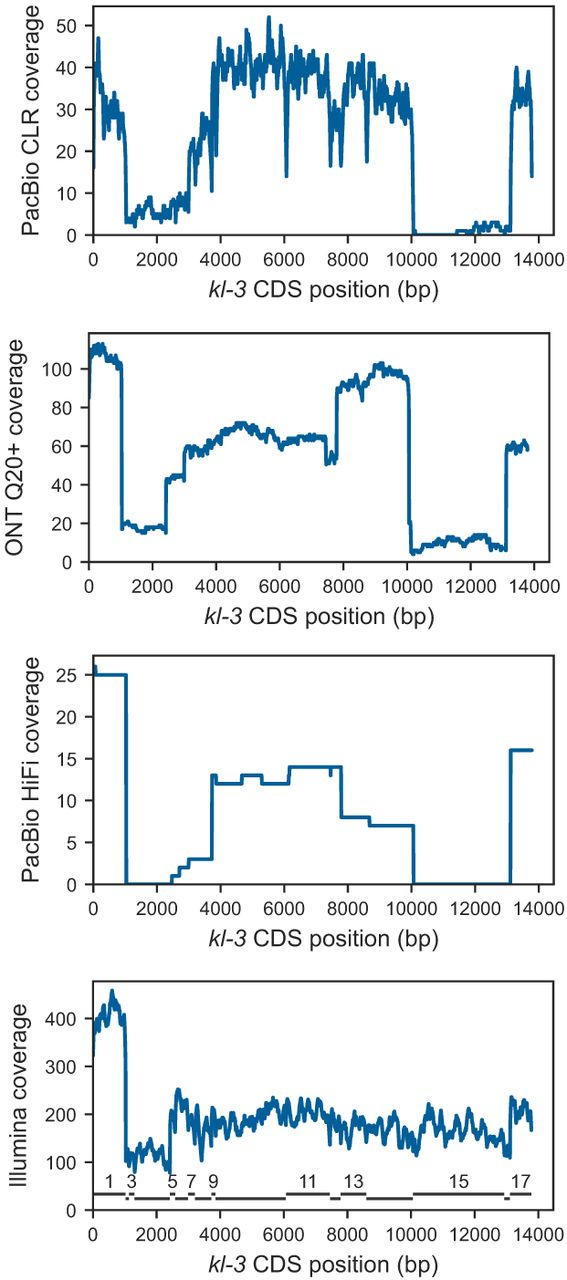
Figure 1.
Coverage of the Y-linked gene kl-3 by raw reads across different sequencing technologies. The three LRS data sets exhibit similar coverage profiles, with two regions of the kl-3 coding sequence (CDS) nearly absent in the raw reads. In contrast, these regions are well represented in the Illumina reads. The numbered bars inside the bottom graph mark exon positions. The coverage peak in exon 1 is caused by an exon duplication (release 6 scaffold armY, coordinates 347715–348740) that was collapsed in the Illumina assembly (Supplemental Fig. S1). For a similar analysis of the other Y-linked genes, see Supplemental Figure S2.