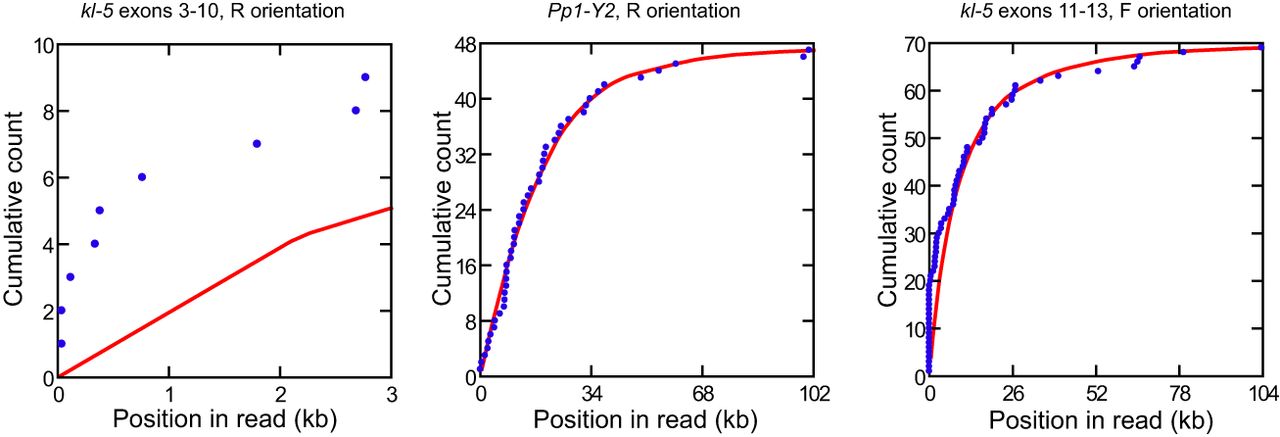
Random genome sampling and read start positions. Under random genome sampling, read start points are expected to follow a uniform distribution (red lines). Exon positions within reads (blue dots) serve as a proxy for read start points in the genome. (Left) The kl-5 exons 3–10, a low-coverage region, show a strong deviation from uniformity (Anderson–Darling test: P < 10−3). (Center) Pp1-Y2, a normal-coverage region, shows very good agreement with the expected distribution (P = 0.767). (Right) kl-5 exons 11–13, another normal-coverage region, show intermediate characteristics. Note the fairly good agreement; the P-value of the Anderson–Darling test (P < 10−3) reflects the much higher statistical power in normal-coverage regions owing to their much larger number of reads. For the remaining regions see Supplemental Figure S9. Figure 5 provides a formal statistical test for the stereotyped read patterns described in Supplemental Figures S6 and S7.