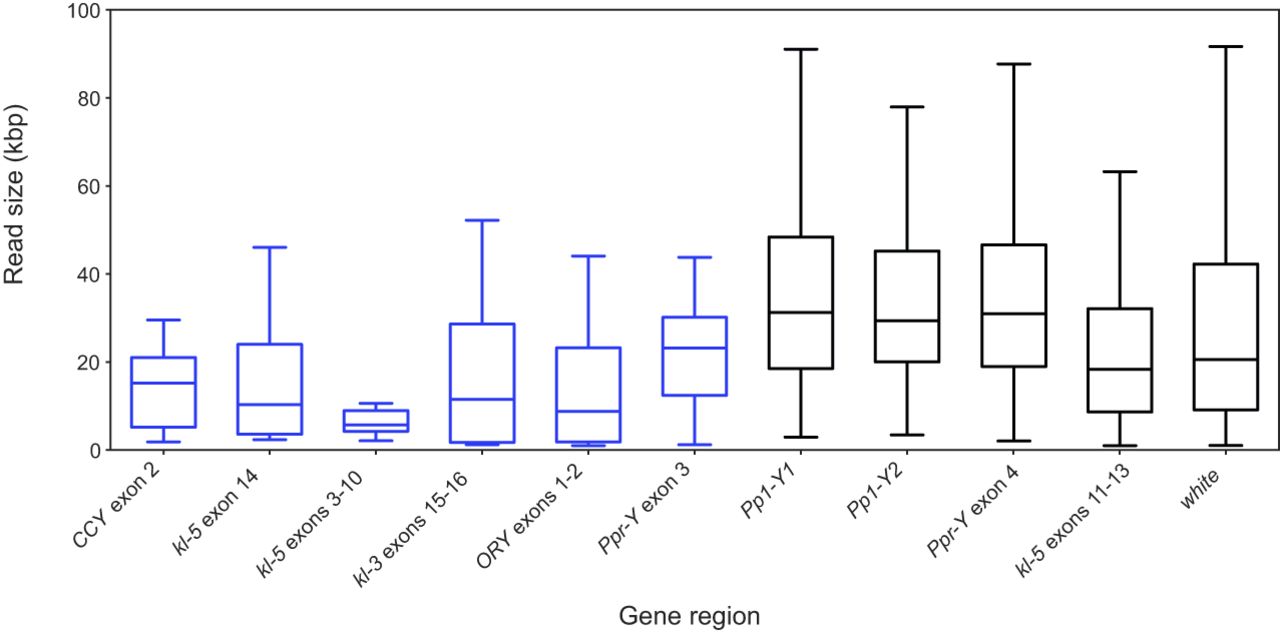
Raw read size in selected regions of the D. melanogaster genome. The six Y-linked regions on the left (blue) have very low read coverages, whereas the next four Y-linked regions and the control euchromatic white gene (black) have approximately normal coverage. The difference in read size between the two groups of Y-linked regions is statistically significant (F1,8 = 93.2; P = 10−4), as are the within-group differences (F8,708 = 8.6; P < 10−5 ; nested ANOVA on log-transformed values). Note that this figure likely underestimates the association between satellite DNA and smaller read sizes because the low-coverage regions CCY exon 2 and Ppr-Y exon 3 contain a large amount of nonsatellite sequence, whereas the normal-coverage region kl-5 exons 11–13 contain satellite DNA (Fig. 3).