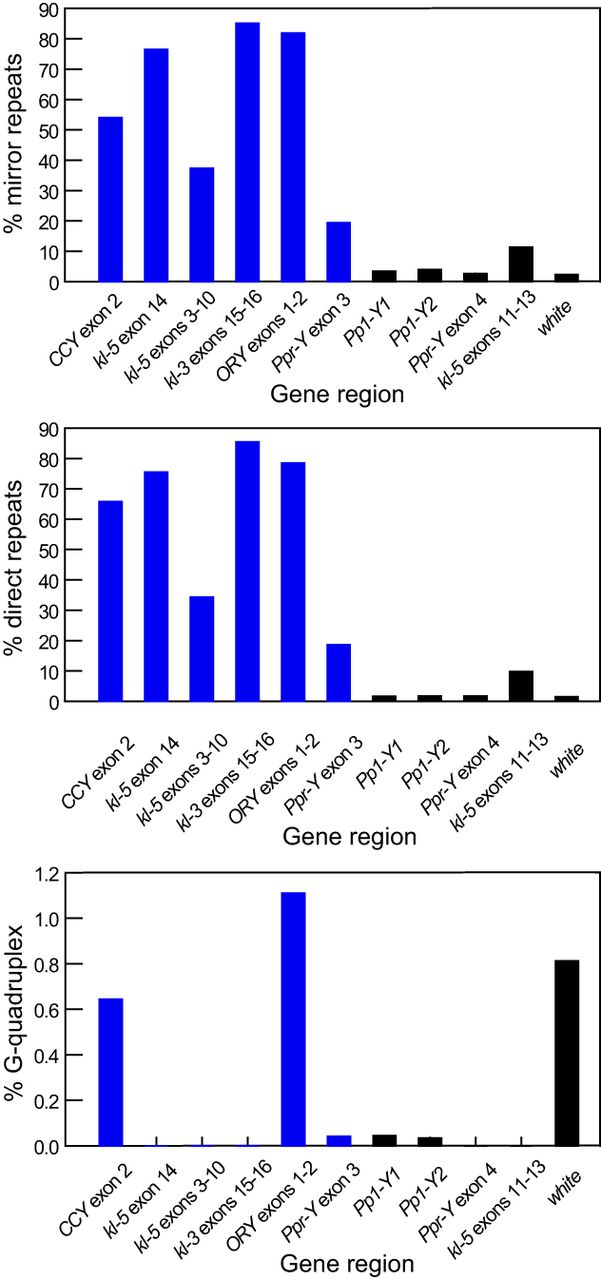
Figure 7.
Abundance of non-B DNA motifs in low- and normal-coverage regions. Motifs were detected using the nBMST program (Cer et al. 2013). The y-axis shows the proportion of each region's sequence occupied by non-B DNA motifs. Blue bars represent low-coverage Y-linked regions; black bars correspond to normal-coverage Y-linked regions and the euchromatic control region (white gene). Note that mirror repeats and direct repeats are consistently abundant in low-coverage regions but are rare in normal-coverage regions. In contrast, guanosine quadruplex motifs, and other motif types shown in Supplemental Figure S22, do not exhibit this pattern.