
Genome Scan and Congenic Strains for Blood Pressure QTL Using Dahl Salt-Sensitive Rats
Abstract
An F2 population (n = 151) derived from Dahl salt-sensitive (S) and Lewis rats was raised on a 8% NaCl diet for 9 weeks and analyzed for blood pressure quantitative trait loci (QTL) by use of a whole genome scan. Chromosomes 5 and 10 yielded lod scores for linkage to blood pressure that were significant; chromosomes 1, 2, 3, 8, 16, 17, and 18 gave lod scores suggestive for linkage. Chromosome 7 gave a significant signal for heart weight with a lesser effect on blood pressure. Congenic strains were constructed by introgressing Lewis low-blood-pressure QTL alleles for chromosomes 1, 5, 10, and 17 into the S genetic background. Congenic strains for chromosomes 1, 5, and 10 had significantly lower blood pressure than S, proving the existence of QTL on these chromosomes, but the chromosome 17 congenic strain failed to trap a contrasting QTL allele. The QTL allele increasing blood pressure originated from S rats for all QTL except those on chromosomes 2 and 7 in which the Lewis allele increased blood pressure. Interactions between each QTL and every other locus in the genome scan yielded significant interactions between chromosomes 10 and 4, and between chromosomes 2 and 3.
More than 30 years ago, Dahl et al. (1963) selectively bred rats for sensitivity (S rats) and resistance (R rats) to the hypertensive effect of a high-salt (NaCl) diet. Inbred strains of S and R rats were subsequently developed from Dahl’s selectively bred lines (Rapp and Dene 1985). These strains are the prototypic animal model for studying salt-induced hypertension.
S rats develop hypertension even on a low-salt diet, but this is markedly exacerbated by increased salt intake (Dahl et al. 1963; Rapp and Dene 1985). Chromosomal regions containing blood pressure quantitative trait loci (QTL) have been detected by the candidate gene approach starting in 1972 with a biochemical genetic marker for steroid 11β-hydroxylase (Rapp and Dahl 1972a, 1976), and then in 1989 when restriction fragment-length polymorphisms first became available (Rapp et al. 1989). More recently, additional chromosomal regions containing blood pressure QTL were identified around candidate genes by use of Dahl rats and more modern genetic markers (Deng and Rapp 1992, 1995;Cicila et al. 1993, 1994, 1997; Deng et al. 1994a,b, 1997a; Gu et al. 1996; Dukhanina et al. 1997). The candidate gene approach was driven initially by the availability of candidate gene markers and the lack of genome-wide markers. Availability of rat markers has improved and is continuing to improve for the rat (Jacob et al. 1995; Bihoreau et al. 1997).
The present work provides a systematic genome scan for blood pressure QTL with an F2 population derived from S and Lewis (LEW) rats. In our previous work, it proved very informative to cross S rats with various inbred normotensive strains, in addition to Dahl R rats, to introduce various contrasting alleles at the QTL and various genetic backgrounds into the experiments. Thus, crossing S with LEW in the present genome scan is a continuation of this approach. Complete genome scans for F2 populations derived from S and Brown Norway (BN), from S and Wistar-Kyoto (WKY), and a partial scan from S and the Milan normotensive strain (MNS), have also been completed (N. Kato, G. Hyne, M.T. Bihoreau, D. Gauguier, G.M. Lathrop, and J.P. Rapp, in prep.).
RESULTS
Comparison of LEW and R Strains
Blood pressure and body weight data for male R and LEW rats fed low (0.2% NaCl) or high (8.0% NaCl) salt diets are given in Table1. LEW rats were highly resistant to the hypertensive effect of a high-salt (8% NaCl) diet. If anything, LEW rats were more resistant than R ending up after 24 weeks on a high-salt diet with a blood pressure ∼15 mmHg lower than R rats. In both strains, an 8% NaCl diet reduced weight gain, and this was a little more marked in LEW rats (Table 1). No rats from either strain died during the 24-week test period. It can be concluded that the LEW strain is very resistant to salt-induced hypertension and, therefore, makes an interesting contrast to S rats, which on a high-salt diet show fulminant hypertension (>220 mmHg systolic blood pressure), and 100% die before 8 weeks on the 8% NaCl diet (Rapp and Dene 1985), or 100% die before 10 weeks on the 4% NaCl diet (Cicila et al. 1997).
Comparison of Systolic Blood Pressure and Body Weight for LEW and R Male Rats Fed Either 0.2% NaCl or 8% NaCl Diet for 24 Weeks
Genomic Coverage
Table 2 gives the genomic coverage obtained by use of the available microsatellite markers in the F2(S × LEW) population. Most of the 406 markers were genotyped on a random sample of 92 of the available 151 F2rats. For chromosome regions in which at least suggestive evidence for linkage to blood pressure was obtained, the entire population of 151 rats was genotyped. An average 97.3% of the genome was within 10 cM of a marker. The total length of the chromosome map was 1757 cM. The average spacing was 4.3 cM/marker. The total genome length can be calculated by correcting for the presumed lack of markers on the end of each telomere as (4.3 × 21 × 2) + 1757 = 1938 cM.
F2 (S × LEW) Genomic Coverage
Linkage to Blood Pressure
Figure 1 gives the results of analysis by use of the MAPMAKER/QTL program for linkage to blood pressure in the F2(S × LEW) population. The program allows fitting different genetic models to the data: additive, dominant/recessive, and free in which both additive and dominance effects are allowed. We fitted all models to each chromosome. In general, we chose the additive models for presentation unless there was evidence that one of the other models provided a better fit to the data. Such evidence showed that the maximum lod scores between models differed by a lod of 1 or more. Plots in Figure 1 are only for chromosomes that yielded lod scores at least at the suggestive level of significance (Lander and Kruglyak 1995). Table 3 lists the chromosomal region with the maximum lod score, the variance explained, along with the effect on blood pressure for each putative QTL. The blood pressure effect is calculated as the difference between homozygous SS minus homozygous LL (S = S-rat allele, L = LEW-rat allele). Table4 gives the blood pressure by genotype for one selected marker at each QTL region.
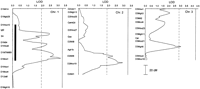
lod plots for linkage to blood pressure for all chromosomes for which at least suggestive statistical evidence for linkage was found. Because different models (listed in Table 3) were used to fit the data for each chromosome, the thresholds vary for different chromosomes. The broken, vertical line is the lod threshold for suggestive linkage; the solid line is for significant linkage as defined by Lander and Kruglyak (1995). The thick bars on the plots for 1, 5, 10, and 17 represent the area of the LEW chromosome introgressed into S rats in the construction of congenic strains. Only representative markers are shown.
Summary of Interval Mapping for Blood Pressure Using the MAPMAKER/QTL Program in the F2(S × LEW) Population Raised on an 8% NaCl Diet
Systolic Blood Pressure by Genotype for Putative QTLs in the F2(S × LEW) Population Raised on an 8% NaCl Diet
The total variance in the F2(S × LEW) population was 1225 mmHg2 and the variance of 30 F1(S × LEW) rats fed a 8% NaCl diet for 9 weeks was 60 mmHg2. From this observation, it appears that most (95%) of the total variance is caused by genetic factors.
Only chromosomes chromosome 5 and 10 yielded lod scores that can be considered significant for a blood pressure QTL without additional data. The remaining putative blood pressure QTL gave lod scores in the suggestive range. On chromosome 1 there was evidence for at least 2 QTL separated by ∼50 cM. The QTL on chromosomes 2 and 7 were unique in that the plus allele was from the LEW strain, whereas in all other cases the plus allele was from the S strain. The chromosome 3 blood pressure QTL showed strong overdominance with the heterozygotes being ∼20 mmHg lower than either homozygote. Chromosome 8 just reached the suggestive statistical level for linkage, and chromosomes 16, 17, and 18 also showed suggestive statistical evidence for blood pressure QTL (Fig. 1; Tables 3 and 4).
QTL analysis for linkage of heart weight gave lod scores in at least the suggestive range for all chromosomal regions in which there was evidence for a blood pressure QTL, except for chromosome 8. The direction of change of heart weight by genotype was always the same as for blood pressure. Thus, the S allele was always the plus allele for heart weight except for chromosome 2 (and 7, see below) in which the LEW allele was the plus allele for heart weight and for blood pressure.
In addition to all the blood pressure QTL regions that also influenced heart weight, a heart weight QTL was found on chromosome 7 in the region of D7Mit5 (Fig. 2). QTL interval analysis had not detected a blood pressure signal on this chromosome because the lod score for linkage to blood pressure in this region was 1.6. In this case, the plus allele for heart weight was from the LEW strain (Table5). Although the blood pressure linkage to this region had not reached significant thresholds, it did move in parallel to heart weight, that is, the plus allele for blood pressure also was from LEW. There was a significant linear relationship between heart weight and blood pressure in the F2 population (r = 0.75, P = < 0.001). Correcting heart weight for blood pressure did largely remove the effect on heart weight of the chromosome 7 region around D7Mit5 (Table 5). Thus, this chromosome 7 region can be interpreted as a potential blood pressure QTL and has been included in Tables 3 and 4.
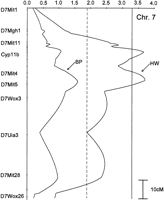
lod plot for linkage-to-heart weight and blood pressure for chromosome 7 with an additive model for both traits. The broken, vertical line is the lod threshold for suggestive linkage; the solid line is for significant linkage. Only representative markers are shown.
Systolic Blood Pressure and Heart Weight by Genotype at D7Mit5 for the F2(S × LEW) Population Raised on an 8% NaCl Diet
Interactions
Two-by-two factorial analyses of variance on blood pressure was performed on 92 of the F2(S × LEW) rats with a marker at each potential blood pressure QTL (Table 3) against all other markers representatively spaced (∼10–15 cM) throughout the genome. All of those yielding an F statistic >3.0 were arbitrarily chosen and data on all 151 rats at the relevant markers was obtained. The two interactions with the highest F statistics obtained with the complete data set will be presented.
Figure 3 shows data for the interaction (F = 4.59, P = 0.002) between D10Wox6 and D4Mit17. On the initial screen, chromosome 10 near D10Wox6 showed a major blood pressure QTL (Fig. 1; Tables 3 and 4), but there was no suggestive blood pressure signal at D4Mit17 in the initial screening. Figure 3 suggests that the slope of the lines relating alleles on chromosome 10 to blood pressure change depending on the genotype at chromosome 4.
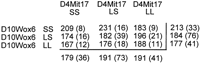
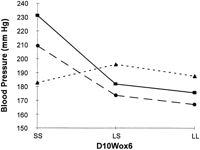
Interaction of the blood pressure effects linked to markers D10Wox6 and D4Mit17. (Top) The cell means for systolic blood pressure; the number of rats for each cell is in parenthesis; marginal means are also given. The interaction term from a 2 × 2 factorial analysis of variance had P = 0.002. (Bottom) (•) SS D4Mit17; (•) LS D4Mit17; (▴) LL D4Mit17.
Figure 4 shows data for the interaction (F = 4.21, P = 0.003) between D2Mco19 and D3Mco9. In the initial screen, chromosome 2 near D2Mco19 did show linkage to blood pressure. On chromosome 3 near D3Mco9 there was only a minor blood pressure signal (lod = 1.7) in the initial screening, although chromosome 3 did indicate a possible QTL ∼50 cM away from D3Mco9 at D3Mgh6. Thus, this analysis indicates that there are at least two loci on chromosome 3 influencing blood pressure, one showing up as a standard QTL, and the other is manifest largely as an interaction. This interaction depicted in Figure 4 arises because when chromosome 2 is SS, the effect of chromosome 3 on blood pressure is small relative to the large effect of chromosome 3 when chromosome 2 is LL. Remember that the chromosome 2 QTL plus allele originates from the LEW strain as contrasted to most of the QTL detected in which the plus allele is from S.
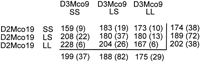
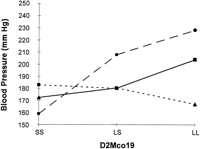
Interaction of the blood pressure effects linked to markers D2Mco19 and D3Mco9. (Top) The cell means for systolic blood pressure; the number of rats for each cell is in parenthesis; marginal means are also given. The interaction term from a 2 × 2 factorial analysis of variance had P = 0.003. (Bottom) (•) SS D3Mco9; (•) LS D3Mco; (▴) LL D3Mco9.
Congenic Strains
Prior to the availability of sufficient markers to do a full genome scan, we had detected possible blood pressure QTL on chromosomes 1, 5, 10, and 17 by use of the candidate gene approach. Thus, we were able to start construction of congenic strains for regions on these chromosomes some time ago. In constructing congenic strains, the QTL allele from the LEW strain was introgressed into the S strain.
The congenic regions for chromosomes 1, 5, 10, and 17 are shown in Figure 1 by a bar next to the map positions of genetic markers. The congenic strains are named S.LEW(chr1), S.LEW(chr5), S.LEW(chr10), and S.LEW(chr17), respectively. Table 6 gives data on blood pressure and heart weight for each congenic strain compared with S rats. For each of these congenic strains, the expected result is that the congenic strain will have lower blood pressure and heart weight compared with S, because the regions introgressed should all contain the minus blood pressure QTL allele. This was true for the chromosome 1, 5, and 10 congenics but not for chromosome 17 (Table 6) in which there was no blood pressure effect detected.
Comparison of Systolic Blood Pressure and Heart Weight between S Rats and Congenic Strains for Chromosomes 1, 5, 10, and 17
DISCUSSION
For the genetic dissection of hypertension in Dahl S rats, we have found it useful to cross S with various normotensive strains to introduce different alleles and genetic backgrounds into the experiments. In this regard, the LEW strain proved very useful. The LEW rats were slightly more resistant to salt-induced hypertension (8% NaCl diet for 24 weeks) than R rats. This was surprising because R rats have been selectively bred for such resistance, whereas LEW rats have not. LEW rats show ∼45% of microsatellite markers polymorphic with S, but between R and S only 18% are polymorphic (Jacob et al. 1995). The higher polymorphism rate between S and LEW is, of course, an advantage in a genome scan.
Our genome scan was essentially complete with 97% of the genome being within 10 cM of any marker. The total (sex averaged) genome length of 1938 cM obtained here agrees reasonably well with previously published figures of 1744 cM (Jacob et al. 1995) and 1998 cM (Bihoreau et al. 1997).
Using the criteria of Lander and Kruglyak (1995), only the blood pressure QTL on chromosomes 5 and 10 were statistically significant. Both chromosomes contain blood pressure QTL. The chromosome 10 QTL was originally reported in an F2 cross of spontaneously hypertensive rats (SHR) with WKY (Hilbert et al. 1991; Jacob et al. 1991) and subsequently was also seen by us in an F2 cross of S with the MNS (Deng and Rapp 1992, 1995). We have also proven the existence of a QTL on chromosome 10 by construction of a congenic strain introgressing the MNS low blood pressure allele into the S-rat genetic background; this congenic strain had a blood pressure ∼40 mmHg lower than S rats (2% NaCl diet, 24 days) (Dukhanina et al. 1997). The new congenic strain reported here for chromosome 10 with the LEW low blood pressure allele on the S background had a blood pressure 42 mmHg lower than S under the same salt diet regimen (Table 6).
The QTL on chromosome 5 (Fig. 1) had been noted previously by us (Deng et al. 1994a) but was inadequately mapped. This QTL is certainly real because the congenic strain introgressing the LEW low blood pressure allele into S rats lowered blood pressure by 15 mmHg (Table 6). This blood pressure effect is, however, about half of what was expected based on the difference of 31 mmHg between rats homozygous for the S allele and rats homozygous for the LEW allele (Table 5) for the marker Edn2 which is near the lod plot peak of the QTL. In general, we expect the S-rat genetic background to be highly permissive for demonstrating genetic effects, as this has been the case for blood pressure QTL on chromosome 3 (Cicila et al. 1994), chromosomes 7 (Cicila et al. 1993) and 13 (Rapp et al. 1990). The chromosome 5 QTL could be an exception to the enhancing effect of the S genetic background. The chromosome 5 QTL is also of interest because it corresponds approximately to a QTL for stroke (Jeffs et al. 1997).
The other putative blood pressure QTL detected here on chromosomes 1, 2, 3, 7, 8, 16, 17, and 18 reached only suggestive statistical levels for their existence. The data for chromosome 1 had been reported previously and interpreted as suggesting two QTL on chromosome 1, one near the SA locus and one near D1Mco1 (Gu et al. 1996). The congenic strain constructed here for a large region of chromosome 1 proves the existence of at least one QTL in the congenic region of chromosome 1. The region in the congenic strain may, however, have missed a QTL near D1Mco1 because: (1) the blood pressure effect of the congenic strain (26 mmHg) is not as large as the 54 mmHg expected for two QTL, one at SA (24 mmHg, Table 3) plus one at D1Mco1 (30 mmHg, Table 3); and (2) during the early phases of constructing the chromosome 1 congenic strain, sufficient markers distal to D1Mco1 were not available, and it was impossible to monitor that portion of the chromosome during the breeding procedure. A separate congenic strain in this region is presently being constructed.
For chromosome 2, we previously reported strong evidence for the existence of a blood pressure QTL by linkage analysis in the region between CamK2d and D2Mit8 using F2(S × WKY) and F2(S × MNS) populations (Deng et al. 1994b). This was confirmed recently by construction of two congenic strains introgressing that region of chromosome 2 from WKY or MNS into the S background. These strains had blood pressure 44 mmHg and 29 mmHg lower, respectively, than S rats (2% NaCl diet, 24 days) proving the existence of a QTL in that region (Deng et al. 1997a). The QTL detected on chromosome 2 in the present work between Agtrlb and D2Mit1 (Fig. 1) falls outside of the region of the previously detected QTL and could represent a second QTL on chromosome 2, although it achieves only suggestive statistical significance here. Evidence by others (Dubay et al. 1993) using Lyon hypertensive rats has suggested a QTL for systolic and pulse pressure in the region of chromosome 2 around Agtrlb (angiotensin receptor 1b).
For chromosome 3, we had previously detected modest evidence for a blood pressure QTL near endothelin-3 (Edn3) in crosses involving S and R rats (Cicila et al. 1994). This was proven to be a QTL by construction of a congenic strain around Edn3 with the R strain as donor and S as the recipient strain. The congenic strain had blood pressure 22 mmHg lower than S (2% NaCl diet, 24 days) (G.T. Cicila, C. Choi, H. Dene, S.S. Lee, and J.P. Rapp, in prep.). The congenic region extends approximately from D3Wox1 to D3Mco9 in Figure 1 and, thus, is clearly at the opposite end of chromosome 3 from the putative QTL detected in Figure 1 between D3Mco21 and D3Wox3.
For chromosome 7 in Figure 2, the evidence for a blood pressure QTL was indirectly obtained by heart weight achieving an acceptable lod score. This QTL is in the vicinity of steroid 11β-hydroxylase, designated as cytochrome P45011β (Cyp11b) in Figure 2. This enzyme catalyzes both 11β and 18 hydroxylation of deoxycorticosterone. The Cyp11b locus has been known since 1972 (1) to be variant between S and R rats, (2) to cosegregate with blood pressure, and (3) to cosegregate with a distinctive adrenal steroid biosynthetic pattern that itself follows simple Mendelian inheritance (Rapp and Dahl 1972a, 1976; Cicila et al. 1993; Matsukawa et al. 1993). Differential production between S and R rats of 18-hydroxyl-11-deoxycorticosterone, which is synthesized by 11β-hydroxylase, almost certainly accounts for the associated blood pressure differences between S and R strains (Rapp and Dahl 1972b). Because LEW and S rats carry the same allele at Cyp11b based on their steroid biosynthetic patterns (Cicila et al. 1993), the putative heart weight/blood pressure QTL shown in Figure 2 is probably not accounted for by variants at Cyp11b. This implies that two QTL ∼20 cM apart could reside on chromosome 7, one at Cyp11b (detected in S × R crosses) and the other close to D7Mit5 (detected here in a S × LEW cross). The QTL at Cyp11b (and presumably identical to Cyp11b) has been proven to exist by construction of a congenic strain substituting Cyp11b (and flanking chromosomal segments) from R rats onto the S background. The congenic strain has a markedly lower blood pressure (63 mmHg lower in males, 35 mmHg lower in females; 24 days on a 4% NaCl diet) and increased survival time compared with S rats (Cicila et al. 1997).
The putative blood pressure QTL on chromosome 8 just barely reached suggestive statistical significance (Fig. 1). Nevertheless, this may well be a QTL. Kren et al. (1997) reported that a congenic strain introgressing a segment of chromosome 8 around the Lx locus (polydactylism) from a BN donor into the SHR background had a significantly lower (17 mmHg) blood pressure than SHR (normal rat chow 19 week-old males). Their congenic region contained D8Mit3 near its center, and this marker is near our lod peak on chromosome 8 (Fig. 1).
The putative QTL on chromosomes 16 and 18 reached only suggestive statistical significance. These are not corroborated by strong independent evidence and thus remain problematic, although a recent paper (Kovacs et al. 1997) reported evidence for linkage of blood pressure to a very broad region of chromosome 18.
The QTL signal on chromosome 17 had been noted by us previously (Deng et al. 1994a), but it was inadequately mapped. This QTL was not corroborated by the congenic strain constructed for the chromosome 17 region, and thus, this signal appears to be a false positive. Two facts warrant further investigation of this region, however, before reaching that conclusion. First, the congenic strain did not introgress as large a chromosome 17 segment as is desirable, because at the time it was started only the Hith marker was available. Thus, the QTL could have been omitted from the congenic region by chance (e.g., between D17Mco3 and D17Mit5, see Fig. 1). Second, a recent report (Yagil et al. 1998) with Sabra salt-sensitive rats located a putative QTL region on chromosome 17 overlapping with the region suggested by our QTL analysis.
The total of all of the blood pressure effects from Table 3 is 168 mmHg (omitting chromosome 17 and assuming additivity). From this observation one would predict that an S rat on an 8% NaCl diet for 9 weeks would have a blood pressure of 308 mmHg (i.e., the blood pressure of 140 mmHg for LEW rats on an 8% NaCl diet for extended times plus 168 mmHg, which equals 308 mmHg). Although this prediction appears unreasonable, it is not. First, the 168 mmHg is probably near a maximal value because there may be false positives for the QTL listed in Table 3. Second, the present day S rats in our colony cannot survive on an 8% NaCl diet for 9 weeks because they die (usually of strokes) as blood pressure goes above 240 mmHg, but pressures up to 300 mmHg can be observed (e.g., see Fig. 3 of Cicila et al. 1997 for rats on a 4% NaCl diet). Thus, the only reason that pressures in the 300 mmHg range are not easily observed is because such high pressures are quickly lethal. The S strain is, of course, maintained on a low-salt diet that ameliorates excessively high pressures and allows the S rat to carry a lethal high load of plus blood pressure alleles. S rats had been (intermittently) selected for salt sensitivity >15 years by Dahl et al. (1963) before they were finally inbred (Rapp and Dene 1985).
A priori multiple interactions among QTL are expected. Detection of such interactions in segregating populations of modest size has been considered to be problematic (Tanksley 1993; Frankel and Schork 1996). Thus, some recent reports of interactions among QTL for various traits have utilized specialized techniques such as crossing of recombinant congenic strains in studying mouse tumors (Fijneman et al. 1996; van Wezel et al. 1996) or crossing of nearly isogenic lines in tomato (Eshed and Zamir 1996). QTL interactions have, however, also been reported in studies with segregating populations of mice for epilepsy (Frankel et al. 1995), airway hyper-responsiveness (DeSanctis et al. 1995), and sucrose consumption (Bachmanov et al. 1997). In our work with blood pressure in rats, an interaction between chromosomes 2 and 10 was reported in an F2(S × MNS) population (Deng and Rapp 1992). Although this interaction was only weakly supported statistically, it has been proven to be correct and to account for 23 mmHg of blood pressure by the use of congenic and double congenic strains for chromosomes 2 and 10 (Rapp et al. 1998).
In experiments in which the whole genome is segregating with many QTL, there are an inordinate number of potential interactions among the QTL. Adequate statistical criteria for evaluating interactions are currently lacking (Frankel and Schork 1996). Thus, our statistical analysis of interactions is admittedly somewhat arbitrary, and the interactions presented are considered to be suggestive until confirmed by study with congenic and double congenic strains. Both the interactions presented are interesting in that they draw attention to chromosomal regions (D4Mit17 and D3Mco9) that would otherwise be ignored.
Complete genome scans for F2 populations derived from S and BN, and from S and WKY rats, and a partial scan involving S and the MNS, have also been completed (N. Kato, G. Hyne, M.T. Bihoreau, D. Gauguier, G.M. Lathrop, and J.P. Rapp, in prep.). An additional strong blood pressure QTL was detected on chromosome 12 in the F2(S × WKY) population and was associated with a blood pressure effect of ∼27 mmHg and lod = 5.4. In the F2(S × BN), a blood pressure QTL (lod = 3.5) was detected on chromosome 3 between D3Wox1 and D3Mit2. This region contains endothelin-3 as a candidate gene and has been shown to be linked to blood pressure in crosses of S with R rats (Cicila et al. 1994) and a successful congenic strain was made for this region with R-rat chromosome 3 as donor on the S background as noted above (G.T. Cicila, C. Choi, H. Dene, S.J. Lee, and J.P. Rapp, in prep.). In the present study, a weak signal (lod = 2.0) was seen in this region. The QTL on chromosome 10, which is very prominent here, was very prominent in F2(S × MNS), and a weaker signal was also seen in F2(S × WKY) and F2(S × BN). Thus, the QTL on chromosome 10 is clearly the one most consistently seen among various crosses.
METHODS
Animal Procedures
Inbred Dahl salt-sensitive (SS/Jr) and Dahl salt-resistant (SR/Jr) rats, designated S and R, respectively, were from our colony (Rapp and Dene 1985). Lewis rats (LEW/NCrlBR) were obtained from Charles River Laboratories (Wilmington, MA). All rats were identified by a numbered skin clip placed on the back of the neck at weaning (National Band and Tag Co., Newport, KY). Rats were euthanized with an overdose of pentobarbital given intraperitoneally.
An F2 population of 151 male rats was produced by crossing LEW × S rats to yield F1, and then intercrossing F1 to produce F2. Rats were weaned at 30 days of age to normal rat chow and then fed an 8% NaCl diet (Teklad diet TD 82050; Teklad, Madison, WI) starting at 37 days of age. After 9 weeks on an 8% NaCl diet, systolic blood pressure was measured by the tail cuff method on conscious restrained rats warmed to 28°C (Bunag and Butterfield 1982). Blood pressure was measured on three separate days during a 5-day period. During each session three to four consistent readings were made and averaged as that session’s reading. The final blood pressure of the rat was the average of the three sessions’ readings.
Congenic strains were developed for certain chromosomal regions containing blood pressure QTL. In all cases, the low blood pressure allele from LEW rats was introgressed onto the S-rat genetic background. S were crossed with LEW and the F1 were backcrossed to S. Rats heterozygous in the chromosomal region of interest were selected for the next generation of backcrossing. A total of eight such backcrosses were made before intercrossing two heterozygotes and selecting rats homozygous for the LEW alleles at markers through the target region to fix the LEW chromosomal segment on the S background.
Each congenic strain was compared with S rats in separate experiments. The congenic strains and S rats were bred concomitantly and litters were culled to 8–10 pups/litter. Pups were weaned at 30 days of age, with four rats per cage, two S and two congenic. The rats were fed 0.4% NaCl rat chow (Teklad diet 7034) until 45 days of age and then placed on a 2% NaCl diet (Teklad diet 94217) for 24 days. On day 24 blood pressure was taken by the tail cuff method on 4 consecutive days as described above. Two technicians each made measurements on 2 separate days on each rat. The blood pressure of all four sessions was averaged as the final value for each rat.
The blood pressure response to a high-salt diet of LEW rats was compared with that of Dahl R rats. LEW and R rats were bred concomitantly, and the pups were weaned at 30 days of age to a low salt (0.2% NaCl) diet (Teklad diet 82049). Rats were housed four per cage, two LEW and two R. At 35 days of age, half of the rats were continued on the low-salt diet and half were fed an 8% NaCl diet (Teklad diet 82050) for 24 weeks. Blood pressure was measured in the conscious restrained rat as described above; three recording sessions per rat were made after 4, 8, 16, and 24 weeks on the test diets.
Genotyping
DNA was prepared from the liver of F2 rats by the method of Blin and Stafford (1976). In the development of the congenic strains, DNA was extracted from tail biopsy tissue with the QIAamp Tissue Kit (Qiagen, Inc., Chartsworth, CA). Microsatellite genetic markers were amplified by PCR and evaluated by electrophoresis by use of methods given in detail previously (Dukhanina et al. 1997). PCR primers were selected from those developed by the following sources: (1) Massachusetts Institute of Technology [(MIT) Cambridge, MA;http://www.genome.wi.mit.edu], available from Research Genetics (Huntsville, AL); (2) Wellcome Trust Centre for Human Genetics (Oxford, UK; ftp://ftp.well.ox.ac.uk/pub/genetics/ratmap), available from Genosys (Cambridge, UK); (3) University of Iowa (R. Walder et al., unpubl.); and (4) literature sources (Serikawa et al. 1992; Gu et al. 1966; Deng and Rapp 1997; Deng et al. 1997b,c; Dukhanina et al. 1997).
Linkage and Statistical Analysis
Linkage maps and QTL localization were performed with the MAPMAKER/EXP (Lander et al. 1987; Lincoln et al. 1992b) and MAPMAKER/QTL programs (Paterson et al. 1988; Lincoln et al. 1992a), obtained from Eric Lander (Whitehead Institute, Cambridge, MA). The MAPMAKER programs also detect potential genotyping errors based on results of flanking markers. These samples were always retyped to confirm or correct the results. A one-way analysis of variance (ANOVA) or t-tests for comparing blood pressures among congenic strains was done with SPSS programs (SPSS, Chicago, IL).
Acknowledgments
This work was supported by grants from the National Institutes of Health to J.P.R. and G.T.C. and by the Helen and Harold McMaster Endowed Chair in Biochemistry and Molecular Biology to J.P.R., by a grant-in-aid from the National American Heart Association, and by a grant-in-aid from the American Heart Association, Ohio Affiliate, to A.Y.D.
The publication costs of this article were defrayed in part by payment of page charges. This article must therefore be hereby marked “advertisement” in accordance with 18 USC section 1734 solely to indicate this fact.
Footnotes
-
↵3 Corresponding author.
-
E-MAIL rbach{at}mco.edu; FAX (419) 383-6168.
-
- Received January 22, 1998.
- Accepted May 4, 1998.
- Cold Spring Harbor Laboratory Press


