
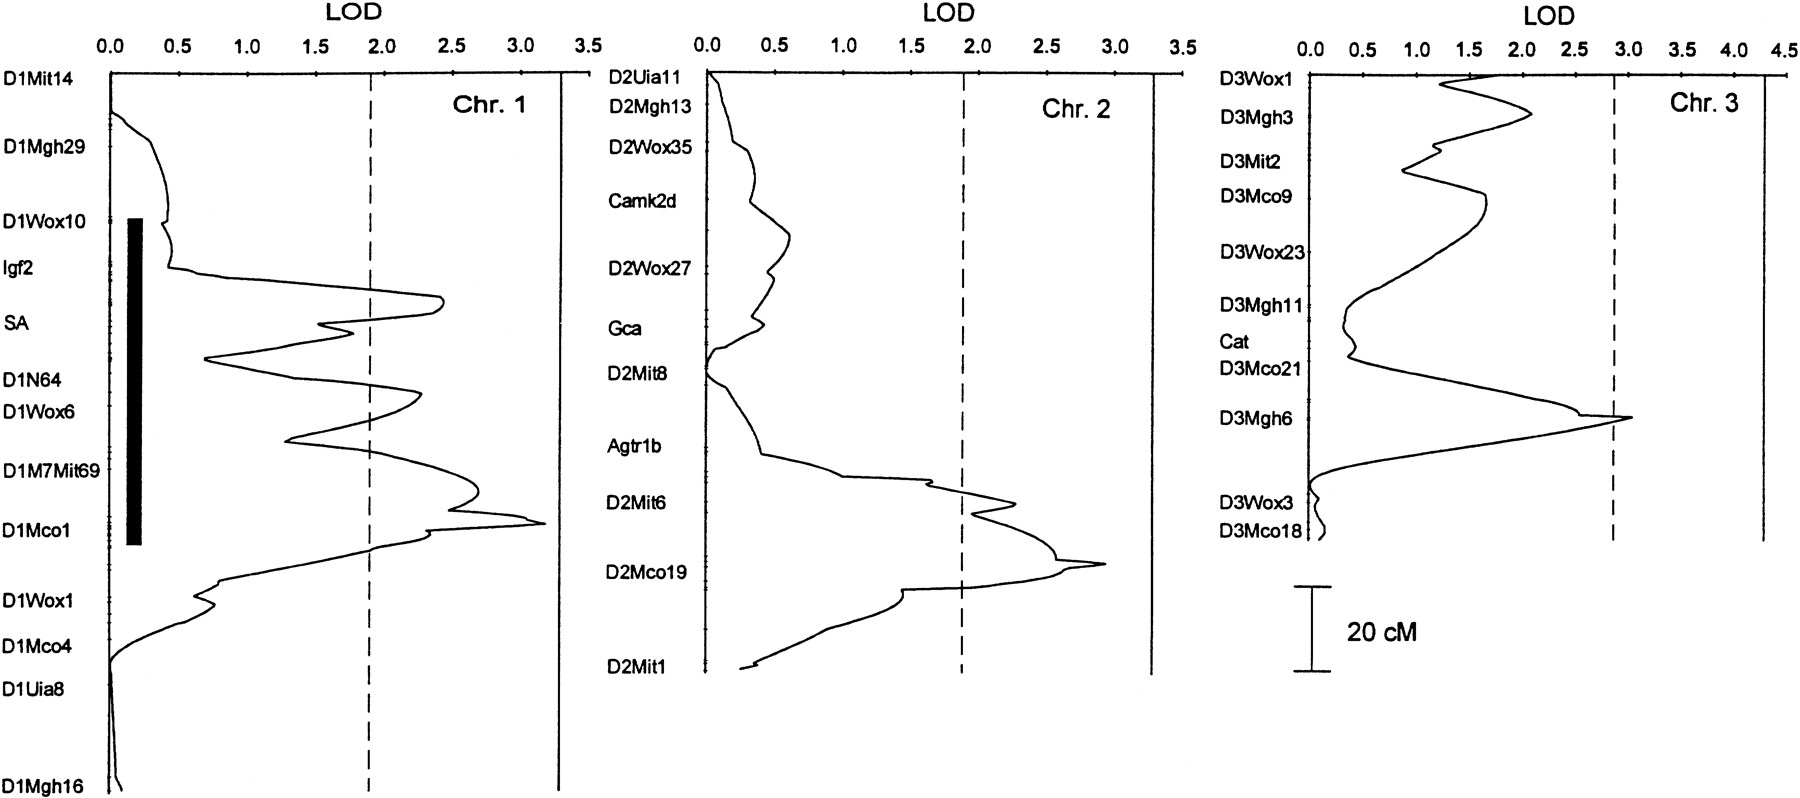
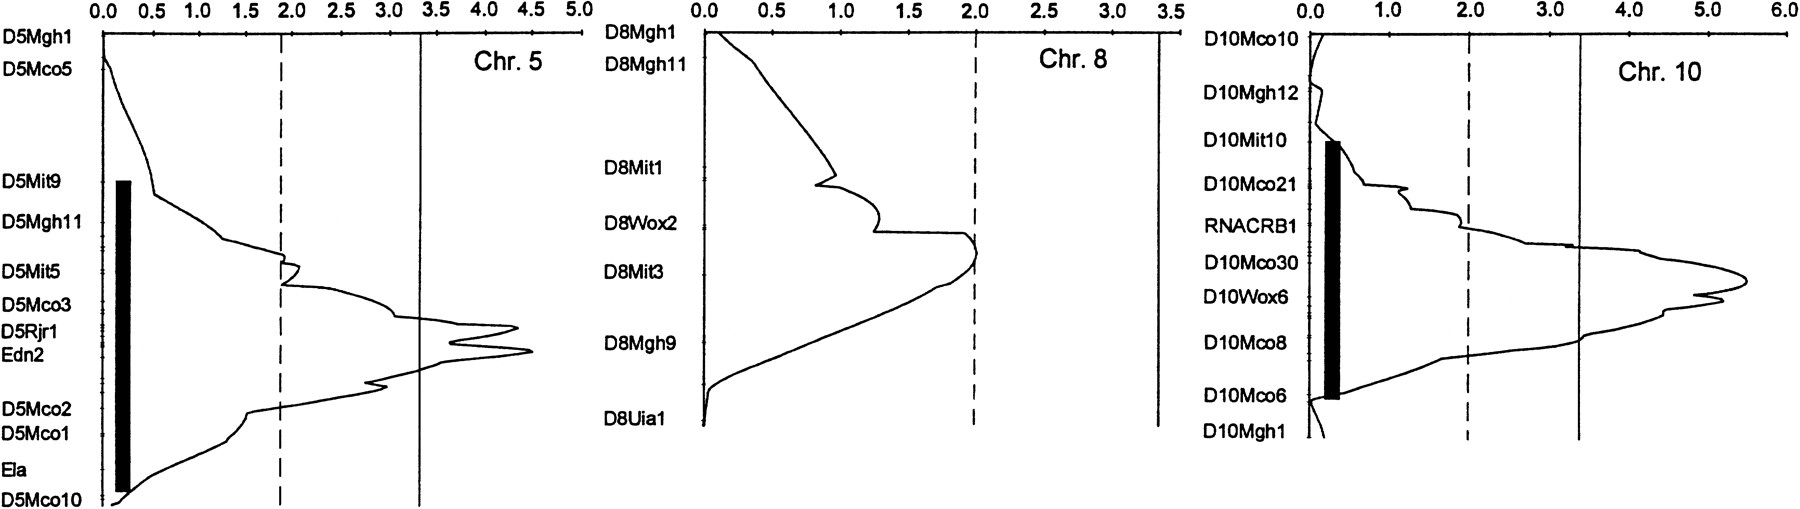
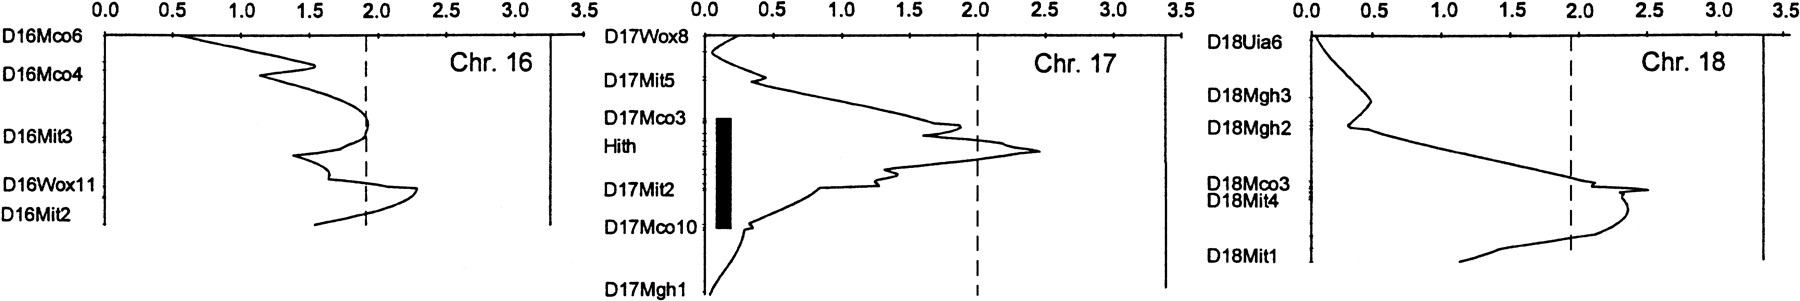
Figure 1.
lod plots for linkage to blood pressure for all chromosomes for which at least suggestive statistical evidence for linkage was found. Because different models (listed in Table 3) were used to fit the data for each chromosome, the thresholds vary for different chromosomes. The broken, vertical line is the lod threshold for suggestive linkage; the solid line is for significant linkage as defined by Lander and Kruglyak (1995). The thick bars on the plots for 1, 5, 10, and 17 represent the area of the LEW chromosome introgressed into S rats in the construction of congenic strains. Only representative markers are shown.


