
Abstract
Intronic polyadenylation (IPA) is a key mechanism driving transcriptome diversity, yet its detection and functional characterization remain challenging owing to complex splicing patterns and the complexity of intronic regions. Here, we introduce IPAseek, a dynamic programming based computational framework that leverages the pruned exact linear time (PELT) algorithm and changepoints over a range of penalties (CROPS) to enable de novo identification of IPA events from bulk RNA-seq data. IPAseek robustly detects both composite and skipped IPA isoforms. Applying IPAseek to bulk RNA-seq of hematopoietic cell types reveals lineage and stage-specific IPA signatures, with lymphoid cells exhibiting higher IPA site usage compared with myeloid cells. Temporal profiling during megakaryocyte differentiation uncovers dynamic, gene-specific IPA regulation linked to functional pathways including peroxisomal metabolism and autophagy, which are known to play a crucial role in megakaryocytic differentiation, impacting the development and maturation of megakaryocytes. Further, integrative analysis demonstrates that IPA site usage is associated with lower DNA methylation within introns, supporting a regulatory axis connecting epigenetic state and IPA. This finding aligns with emerging evidence that DNA methylation modulates alternative polyadenylation via CTCF-mediated chromatin looping. Thus, IPAseek provides a platform to characterize IPA across physiological systems and disease contexts using widely available bulk RNA-seq data. These IPA events can be further integrated with other regulatory data sets to elucidate their interplay and functional significance.
Cleavage and polyadenylation are a central step in mRNA biogenesis that determines transcript 3′-ends and contributes to gene regulation complexity. Extensive work over the past two decades has established alternative cleavage and polyadenylation (APA) as a widespread mechanism for generating transcript isoforms with distinct 3′ untranslated regions (3′ UTRs) (Tian et al. 2005; Wang et al. 2008; Proudfoot 2011; Elkon et al. 2013). Variation in 3′-UTR length can influence post-transcriptional regulation by modulating the presence of cis-regulatory elements that affect mRNA stability, localization, and translation (Mayr and Bartel 2009; Berkovits and Mayr 2015; Mayr 2019). Consistent with these regulatory roles, APA has been implicated in diverse biological processes, including immune activation and tumorigenesis, whereas genetic variation near polyadenylation signals (PASs) has been linked to disease-associated traits (Sandberg et al. 2008; Neve et al. 2017; Gabel et al. 2024).
Intronic polyadenylation (IPA) represents a distinct class of APA in which RNA isoform terminates within intronic regions, generating truncated mRNA isoforms with altered coding region (Tian et al. 2007; Singh et al. 2018). IPA events can arise through different splicing configurations, including composite terminal exons (TEs) or skipped TEs, and have been shown to expand transcript diversity. A well-studied example occurs at the immunoglobulin heavy-chain locus, in which developmentally regulated IPA site usage in B cells controls the production of membrane-bound versus secreted IgM (Early et al. 1980; Tian et al. 2007). More broadly, IPA has been associated with cell differentiation, immune function, stress responses, and cancer, underscoring its potential impact on gene regulation and cellular identity (Ni and Kuperwasser 2016; Singh et al. 2018; Zhao et al. 2021; Sun et al. 2024). Despite these observations, the factors that shape cell-type-specific IPA site usage remain largely underexplored.
Although numerous computational approaches have been developed to study APA using RNA sequencing (RNA-seq) data, most were designed to detect 3′ cleavage events within annotated 3′ UTRs and are not optimized for intronic regions (Xia et al. 2014; Gruber et al. 2018; Ha et al. 2018). Detecting IPA poses additional challenges owing to lower transcript abundance, complex splicing patterns, and confounding signals from intron retention. Although experimental methods such as 3′-end sequencing provide high-resolution maps of polyadenylated RNA cleavage sites, their scalability limits their use in large data sets (Derti et al. 2012; Lianoglou et al. 2013). Recent bulk RNA-seq-based tools, like IPAFinder and InPACT, targeting IPA have begun to address these limitations but remain sensitive to coverage biases or sequence-based assumptions, highlighting the need for robust methods specifically tailored to genome-wide analysis of IPA dynamics (Scotto-Lavino et al. 2006; Liu et al. 2024).
Hematopoietic differentiation provides a well-defined biological framework in which to examine dynamic RNA processing events across closely related cell states. Epigenetic mechanisms, including DNA methylation, play essential roles in regulating gene expression during hematopoiesis and have been implicated in modulating polyadenylation site usage in selective contexts (Wood et al. 2008; Cowley et al. 2012; Nanavaty et al. 2020). However, the extent to which DNA methylation contributes to cell-type-specific regulation of IPA remains unclear.
In this study, we investigate the dynamics of IPA across hematopoietic lineage using genome-wide transcriptomic and epigenomic data. We develop and apply a computational framework called IPAseek for systematic identification and quantification of IPA events and use this approach to characterize lineage-associated patterns of IPA site usage. We further examine the relationship between DNA methylation and IPA to explore potential epigenetic contributions to cell-type-specific IPA regulation.
Results
IPAseek: a method for IPA site detection
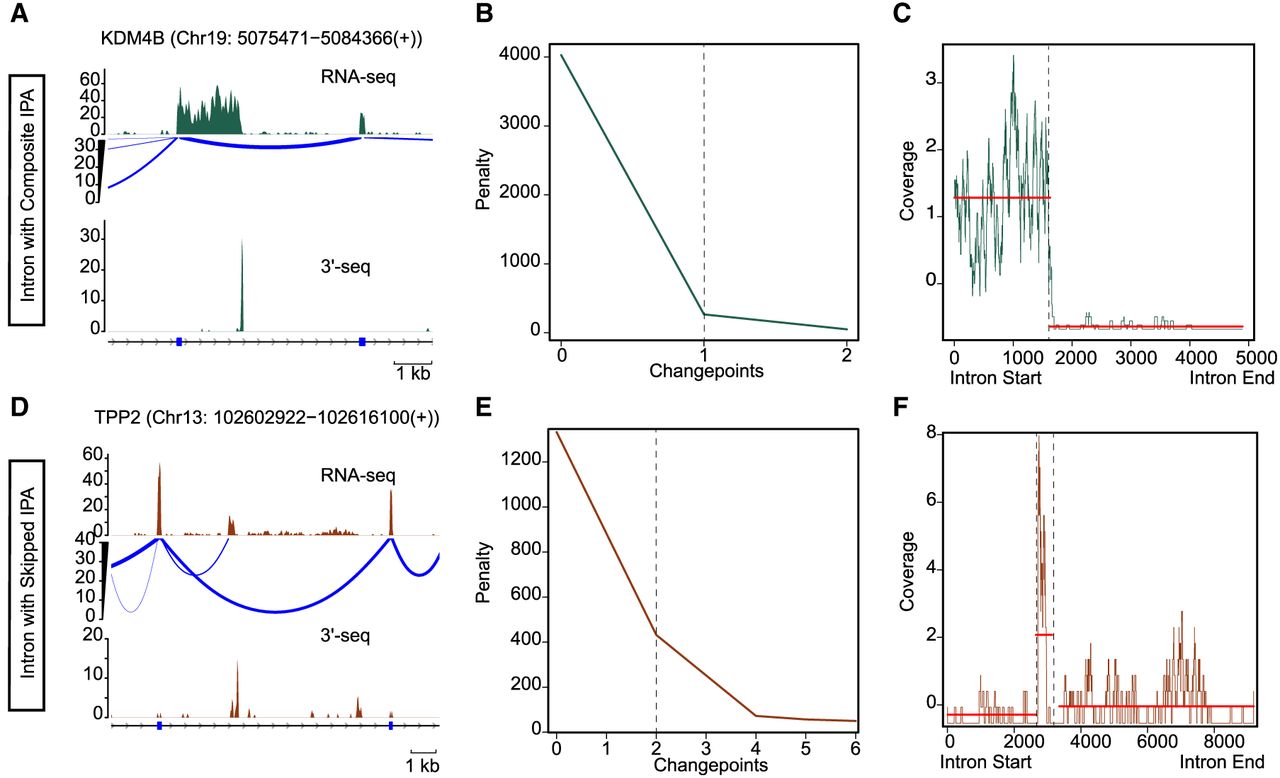
Changepoints are positions within a data sequence in which there is a shift in statistical properties, such as mean or variance. In the context of bulk RNA-seq data, a used IPA site manifests as a transition in transcript coverage: There is coverage upstream of the site and a drop or absence of coverage downstream, creating a clear changepoint signature (composite IPA) (Fig. 1A). This pattern can become more complex when splicing events are coupled with 3′-end formation, resulting in multiple changepoints (e.g., skipped IPA) (Fig. 1D), and bulk RNA-seq coverage biases further add to the challenges of changepoint detection (Killick et al. 2012; Haynes et al. 2017).
Changepoint detection of IPA sites by PELT. (A, top) Bulk RNA-seq coverage (raw read count of uniquely mapping reads) over a genomic locus annotated as intron by RefSeq. The sashimi plot shows the splicing complexity at the locus. (Bottom) Peaks (raw read count of mapped reads at the locus) detected by 3′-seq, a high-throughput 3′-end detection and quantification approach. This is a representation of a composite IPA event. The gene locus presented here is located on the sense strand of DNA. (B) Elbow plot demonstrates the number of changepoints (x-axis) detected by PELT over a range of penalties (y-axis) over the locus shown in A. This plot shows detection of one changepoint generated owing to 3′-end formation. (C) Plot shows the read coverage over the intron in A. It highlights the two segments detected by PELT with the maximum difference in mean of the segments. (D) As in A but shows the locus of a skipped IPA event. The gene locus presented here is located on the sense strand of DNA. (E) As in B but shows detection of two changepoints for the locus shown in D. One changepoint explains the splicing, and the second changepoint highlights the 3′-end formation. (F) As in C but for the locus shown in D. PELT detects three segments with different means using the read coverage over the intron shown in D.
To enable de novo detection of IPA sites from individual bulk RNA-seq profiles, we developed a computationally efficient methodology capable of identifying multiple changepoints within the vast search space of intronic regions of expressed genes. Our approach leverages the pruned exact linear time (PELT) algorithm, a dynamic programming method with linear computational complexity that applies a penalty for each additional changepoint to balance sensitivity and specificity (Killick et al. 2012). Because coverage biases and inherent fluctuations in bulk RNA-seq data can lead to overfitting (too many changepoints) or underfitting (too few changepoints) when using a fixed penalty, we integrated PELT with the changepoints over a range of penalties (CROPS) method, which systematically explores optimal segmentations across a spectrum of penalty values (Haynes et al. 2017).
Our algorithm proceeds as follows: (1) Bulk RNA-seq reads are aligned to the genome to generate coverage profiles; (2) introns of protein-coding genes that exhibit retention are identified and filtered out to avoid spurious signals; (3) introns of protein-coding genes with contiguous coverage over at least 100 consecutive bases are selected, as very short covered regions within introns might not be functionally relevant; (4) PELT is applied to these coverage profiles to detect changepoints; and (5) differential expression upstream of and downstream from each detected changepoint is assessed to confirm a shift in the coverage profile (see Methods) (Supplemental Fig. S1). By running changepoint detection over a range of penalties, the algorithm determines the optimal number of changepoints and evaluates the risk of overfitting at lower penalties and underfitting at higher penalties (Fig. 1B,C,E,F). The resulting changepoints are further evaluated by checking for junction-spanning reads upstream and downstream to distinguish IPA sites from splicing events.
A key feature of IPAseek is its use of per-base resolution coverage data from uniquely mapping reads across introns and flanking coding regions, providing a high-resolution foundation for changepoint detection. The integration of the PELT algorithm with CROPS, combined with filtering for intron retention and splicing, enables efficient and robust identification of both single and multiple changepoints in bulk RNA-seq data sets, thereby enhancing the accuracy and reliability of IPA site detection (Fig. 1).
Enhanced detection of IPA sites by IPAseek using bulk RNA expression coverage
To evaluate IPAseek performance in de novo IPA detection, we applied it to 18 test bulk RNA-seq samples that also had paired 3′-seq data (see Supplemental Table S1; Lee et al. 2018; Samur et al. 2018). We first assessed the quality of these bulk RNA-seq samples by comparing reads aligned to intronic versus exonic regions (Supplemental Fig. S2A) and categorized them as high, moderate, or low quality based on the relative coverage in these regions.
To define ground truth for IPA site validation, we used IPA sites detected with five or more tags per million (TPM) expression in the 3′-seq atlas as described by Lee et al. (2018) and Singh et al. (2018). Currently, 3′-end sequencing techniques represent the state-of-the-art methodology for the precise identification and quantification of transcript 3′ ends. Thus, after removal of known artifacts as described by Singh et al. (2018), it was used as a reference standard to evaluate the performance of IPAseek. Because achieving single-nucleotide precision from bulk RNA-seq is challenging owing to read length and coverage resolution (Shenker et al. 2015; Arefeen et al. 2018), IPA sites detected within 350 nt of a ground-truth site were considered true positives (TPs); ground-truth sites missed in RNA-seq were considered false negatives (FNs); and IPA sites detected only in RNA-seq or expressed at five or fewer TPM in the 3′-seq atlas were categorized as false positives (FPs), hereafter referred to as uncharacterized IPA sites.
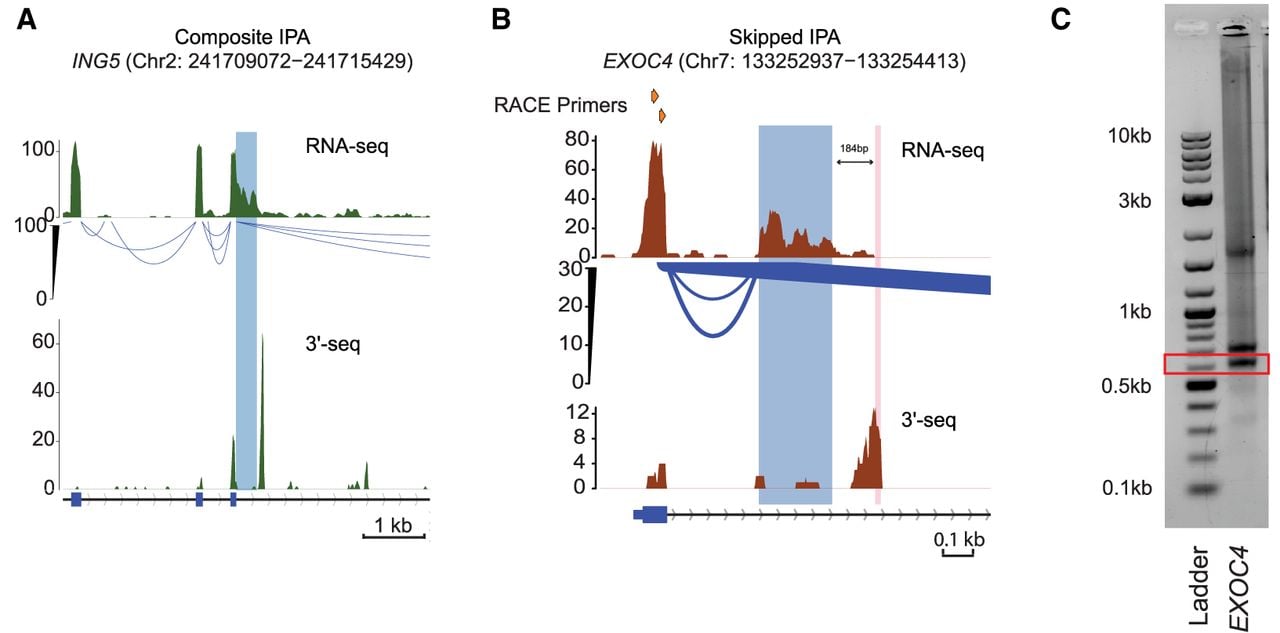
Using this framework, IPAseek identified IPA events that were not detected by IPAFinder or InPACT but were supported by ground truth. These included a composite IPA site in ING5 (106 bp upstream of the 3′-seq sites) (Fig. 2A) and a skipped IPA site in EXOC4 (185 bp upstream) (Fig. 2B). We validated the 3′-end of the EXOC4 IPA isoform using 3′-RACE (Fig. 2C), confirming that IPAseek detected a cleavage site 184 bp upstream of the site mapped by 3′-RACE.
Comprehensive analysis of IPA events detected by IPAseek. (A) Same as Figure 1A but a composite IPA event detected only by IPAseek. The highlighted region shows the new terminal exon (TE), in which the termination site was detected as a changepoint by IPAseek. The gene locus presented here is located on the sense strand of DNA. (B) Similar visualization as in A but depicting a skipped IPA event detected by IPAseek. The top track here indicates the position of the two nested primers used for 3′-RACE validation. The blue highlighted region shows the TE detected by IPAseek, and the pink highlighted region shows the cleavage site detected by 3′-RACE (±20 nt). The gene locus presented here is located on the sense strand of DNA. (C) Validation of 3′-end detected by IPAseek in B using 3′-RACE. Total RNA extracted from K562 cells was used to perform 3′-RACE.
To further evaluate the biological relevance of IPAseek-detected events, we analyzed PAS enrichment within ±200 nt of IPA sites and observed enrichment for canonical AAUAAA/AUUAAA motifs across all test samples (Supplemental Fig. S2B), consistent with known PAS driven cleavage (Tian et al. 2005). Approximately 37% of IPAseek-detected IPA isoforms retained ≤25% of the coding sequence (CDS) (Supplemental Fig. S2C), aligning with previous reports that many IPA isoforms truncate early in the transcription unit (Singh et al. 2018). Together, these results demonstrate that IPAseek can detect biologically relevant IPA events.
Enhanced IPA detection with IPAseek
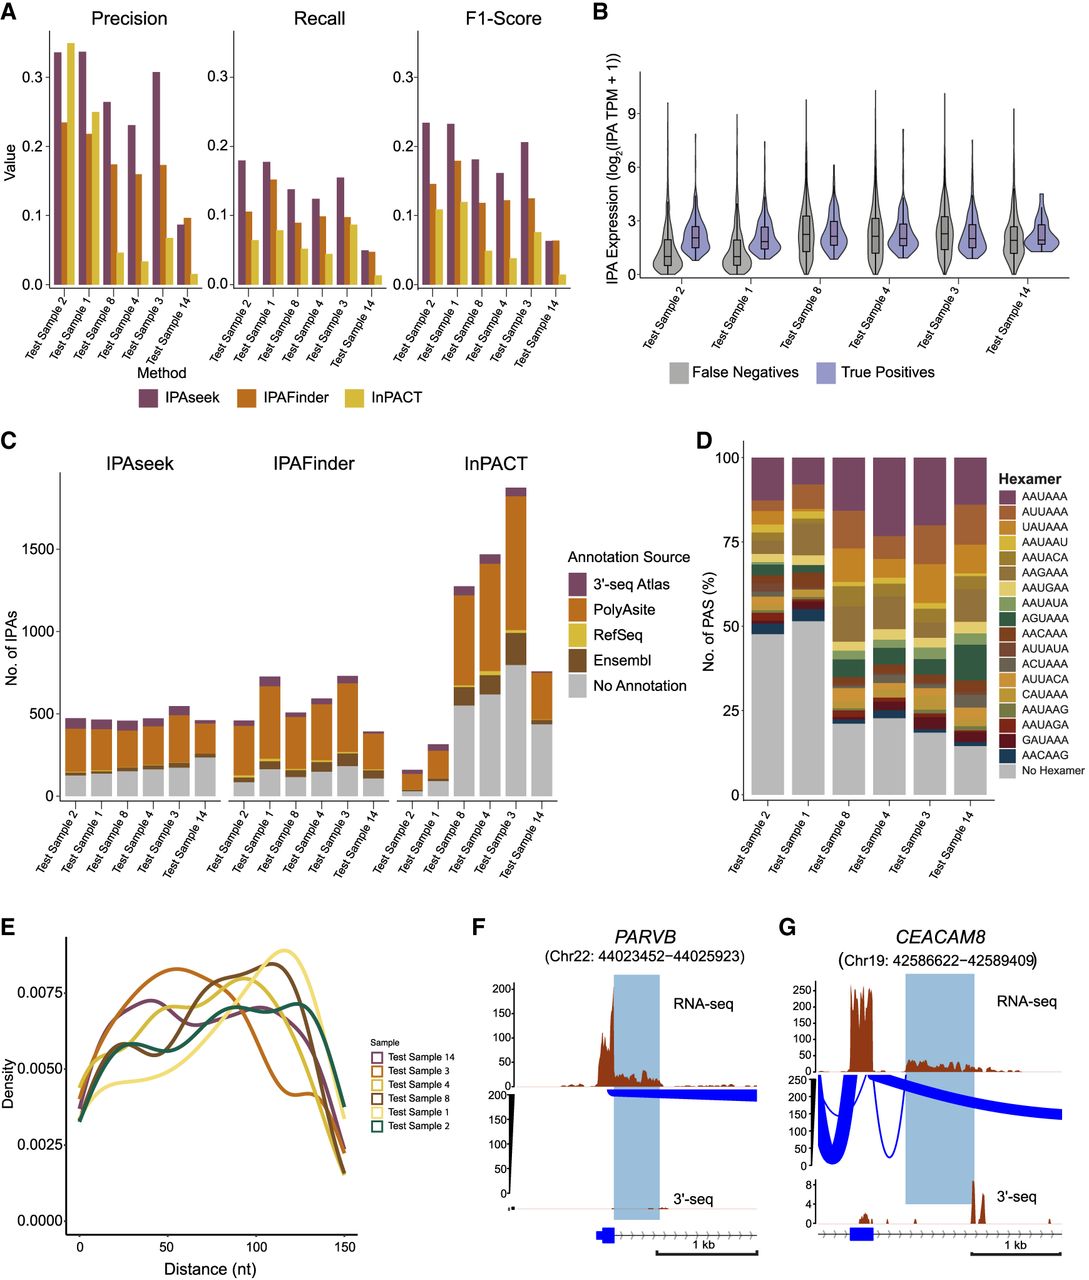
We next evaluated IPAseek's performance more systematically by comparing it with two published IPA detection methods, InPACT and IPAFinder, using precision, recall, and F1-score metrics (Fig. 3A; Supplemental Fig. S3A). Across all 18 test samples, IPAseek achieved a mean precision of 0.16, mean recall of 0.08, and mean F1-score of 0.10, compared with 0.12, 0.06, and 0.08, respectively, for IPAFinder and 0.05, 0.03, and 0.03 for InPACT (see Supplemental Table S2). When stratified by sample quality, IPAseek demonstrated improvement in metrics within each group; in high-quality samples, precision, recall, and F1-score reached 0.28, 0.14, and 0.19, respectively, outperforming IPAFinder and InPACT.
Comparative analysis of IPAseek-detected IPA events with existing methods. (A) A comprehensive evaluation of the performance metrics for IPAseek, InPACT, and IPAFinder in detecting IPA events across the multiple six test samples (ordered by sample quality). The analysis employs three key metrics: precision, recall, and F1-score. The IPA 3′-ends detected by 3′-seq (expressed at five or higher TPM) were utilized as ground truth. Precision measures the proportion of correctly identified IPA events among all detected events, and recall quantifies the fraction of true IPA events successfully identified by each method. The F1-score, the harmonic mean of precision and recall, provides a balanced measure of overall performance. (B) Comparison of bulk RNA-seq expression levels of TEs, represented as log2 (RPKM+1), between IPA events detected by both IPAseek and 3′-seq (true positives) and those identified exclusively by 3′-seq (false negatives). Statistical significance of the difference in TE expression between true positives and false negatives was assessed using the Kolmogorov–Smirnov test (P-value < 0.001 of test samples 1, 2, 4, and 8 and P-value < 0.01 of test sample 14). (C) This figure presents a quantitative comparison of previously uncharacterized IPA events (false positives) identified by IPAseek, InPACT, and IPAFinder across the six test samples (ordered by sample quality). Previously uncharacterized IPAs are defined as those detected using RNA-seq coverage profiles that either are not present in the 3′-seq atlas or have low expression (five or lesser TPM) in the 3′-seq atlas. The color-coded segments within each bar represent the distribution of annotation sources for these uncharacterized IPA sites, including the 3′-seq atlas (expressed five or lesser TPM), PolyASite database, RefSeq, and Ensembl annotations, prioritized in that order. The gray region indicates IPA events detected by each method that lack any prior annotation. (D) Proportion of uncharacterized IPA events without annotations detected in six test samples (ordered by sample quality; gray events in C for IPAseek) with a canonical/noncanonical PAS within ±150 nt of the detected IPA site. (E) Density plot of the distance of the nearest PAS from the IPA cleavage site detected by IPAseek. (F) Same as Figure 1A, showing an uncharacterized composite IPA isoform without annotation detected by IPAseek but not by InPACT and IPAFinder. The gene locus presented here is located on the sense strand of DNA. (G) Same as Figure 1A, showing an uncharacterized skipped IPA isoform without annotation detected by IPAseek but not by InPACT and IPAFinder. The gene locus presented here is located on the antisense strand of DNA.
As demonstrated above, under the default settings, IPAseek performs best on high-quality RNA, with more modest gains over IPAFinder in moderate and low-quality samples. To improve sensitivity, we relaxed the intron retention filter, defined as the ratio of median intronic to upstream exon coverage, which increased detectable IPA events but also raised FPs, in a sample-quality-dependent manner. These user-defined thresholds allow IPAseek to be tuned to different data qualities and tolerances for FPs.
Even though IPAseek outperforms the other methods, the mean recall remains low, indicating that a substantial number of IPAs are hard to detect from bulk RNA-seq alone. To examine factors influencing detection, we compared terminal IPA exon expression between TPs and FNs and found that TPs exhibit significantly higher expression than FNs across multiple test samples (Fig. 3B; Supplemental Fig. S2D). This supports IPA expression level to be a key determinant of detectability in bulk RNA-seq-based IPA calling.
To investigate the validity of FPs, we assessed whether these sites represent authentic IPA events that are unannotated or missed by our 3′-seq cutoff or instead reflect artifacts. We examined additional evidence for 3′-end formation by querying PolyASite, RefSeq, Ensembl, and lowly expressed 3′-seq events (five or lesser TPM) and by assessing the presence of essential PAS motifs near the determined cleavage sites (O'Leary et al. 2016; Herrmann et al. 2020; Martin et al. 2023). IPAseek detected fewer FPs overall, especially in high-quality samples compared with IPAFinder and InPACT (Fig. 3C; Supplemental Fig. S3B). For example, in test samples 1, 2, 3, 4, 8, and 11, IPAseek identified 466, 474, 547, 473, 459, and 377 FPs, respectively, compared with 727, 460, 731, 594, 508, and 547 for IPAFinder and 315, 160, 1874, 1469, 1275, and 1742 for InPACT.
Most IPAseek FPs could be cross-referenced to existing databases or supported by lowly expressed isoforms in the 3′-seq atlas, indicating that many of these sites likely correspond to bona fide IPA events not captured by the stringent ground-truth definition. FPs from InPACT and IPAFinder also contained previously unannotated sites, underscoring the potential of all three methods to expand the landscape of known IPA events. To further evaluate the biological relevance of unannotated IPAseek FPs, we examined PAS motifs within ±150 nt of the potential cleavage sites and observed a strong enrichment for canonical and noncanonical PAS sequences, with most motifs located close to the IPA sites (Fig. 3D,E; Supplemental Fig. S3C,D).
We conducted further characterization of selected FP sites and identified a distinct composite IPA event within the PARVB gene (Chr 22: 44,024,452–44,024,923 (+)) and a skipped IPA event in the CEACAM8 gene (Chr 19: 42,587,622–42,588,409 (−)) (Fig. 3F,G). These IPA events were not detected by the two other methods, InPACT and IPAFinder. Collectively, these results establish IPAseek as an effective tool for detecting diverse IPA events across complex transcriptomic landscapes.
IPAseek reveals stage-specific IPA site usage during megakaryocyte differentiation
In this section, we used IPAseek to systematically analyze changes in IPA during the differentiation of myeloid progenitor K562 cells into megakaryocytes. Bulk RNA-seq data from eight sequential time points spanning 0–4320 min, with two biological replicates per time point, were obtained from the NCBI Gene Expression Omnibus (GEO; https://www.ncbi.nlm.nih.gov/geo/) accession number GSE213909 (Bond et al. 2023). IPAseek identified 2342 confident IPA events across replicates (present in both replicates at any time point), with 225 highly used events (≥25% usage in two or more samples) selected for detailed analysis.
Temporal analysis contrasting early (0–360 min) and late (1440–4320 min) stages revealed distinct clusters of IPA events with differential usage (Fig. 4A). A heatmap visualizing dynamic IPA site usage showed clear separation of the early and late time points, demonstrating progressive change of the IPA landscape over 72 h (Fig. 4A).
Temporal analysis of IPA during myeloid progenitor to megakaryocyte differentiation. (A) IPA sites with differential usage (≥10% usage difference) with respect to full-length mRNA in myeloid progenitor cells (K562) to megakaryocytic differentiation (n = 166). The sites were determined by the calculating the difference in IPA site usage of all the IPA events, using the two early and two end differentiation time points. Each row is a unique IPA isoform, and columns are samples captured at different time points of the differentiation process. The color scheme indicates regulation status, with higher usage shown in orange and lower usage in blue. IPA site usage is quantified on a zero-to-one scale relative to full-length isoform usage, with the color intensity reflecting the degree of IPA site usage. (B) RNA-seq read coverage (in TPM) over the ACOT8 locus across different time points of myeloid progenitor (K562) to megakaryocytic differentiation. The read coverage was determined using uniquely mapping reads. The top track indicates the position of the two nested primers used for 3′-RACE validation. The blue-highlighted region shows the TE determined by IPAseek, and the pink-highlighted region shows the cleavage site detected by 3′-RACE (±20 nt). The gene locus presented here is located on the antisense strand of DNA. (C) As in B but showing the PEX13 locus. The gene locus presented here is located on the sense strand of DNA. (D) Validation of the 3′-end detected by IPAseek in B and C using 3′-RACE. Total cell RNA extracted from K562 cells was used to perform 3′-RACE. (E) Morphological assessment of myeloid progenitor cells. Phase-contrast microscopy (20× magnification; BioTek Lionheart FX automated microscope) captured progressive morphological changes during PMA-induced megakaryocytic differentiation of myeloid progenitor cells. Columns represent treatment groups: untreated control (left), 0.0025% DMSO vehicle (middle), and 25 nM PMA-treated cells (right). Rows correspond to time points: 24 h (top), 48 h (middle), and 72 h (bottom). PMA-treated cells exhibited hallmark differentiation features including increased cell size compared with the controls. Scale bars, 10 µm. (F) IPA isoform usage in ACOT8 during myeloid progenitor differentiation to megakaryocytes. (Left) IPA site usage measured across eight time points (0 min to 4320 min) following PMA treatment, quantified using IPAseek analysis of bulk RNA-seq data from GSE213909. (Right) IPA isoform usage, identified by 3′-RACE, measured at six time points (6 h to 96 h) post-PMA treatment or vehicle control (DMSO 96 h), validated by qRT-PCR. Together, these plots demonstrate an increase in ACOT8 IPA isoform usage throughout differentiation. (G) Same as in F but for PEX13. It demonstrates a decrease in PEX13 IPA isoform usage throughout differentiation.
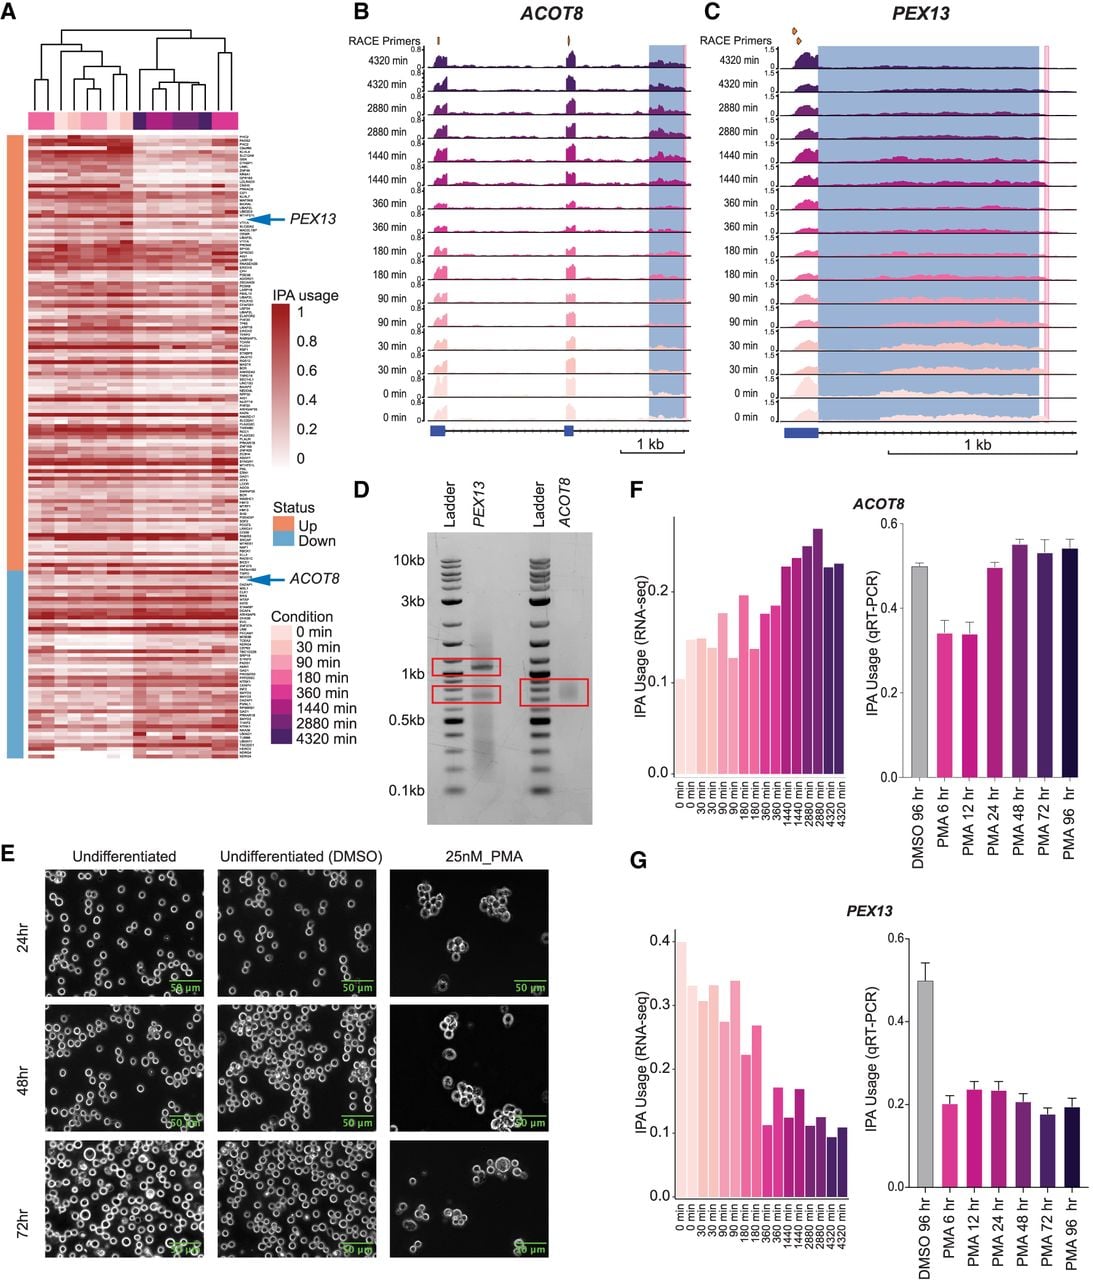
Our analysis highlighted two genes, ACOT8 and PEX13, exhibiting contrasting patterns of IPA site usage linked to differentiation stage (Fig. 4A). ACOT8 showed increased IPA site recognition at later time points (Fig. 4B,F; Supplemental Fig. S4B), whereas PEX13 displayed reduction in IPA site usage as differentiation proceeded (Fig. 4C,G; Supplemental Fig. S4C). Protein–protein interaction network analysis confirmed a direct functional relationship between ACOT8 and PEX13 (Supplemental Fig. S4A), supporting coordinated regulation of peroxisomal function and lipid metabolism during megakaryopoiesis (Hunt et al. 2012; Lee et al. 2018; Plessner et al. 2024).
To validate these IPA events, we performed 3′-RACE for ACOT8 and PEX13, confirming the IPA isoforms detected by IPAseek (Fig. 4D). 3′-RACE revealed an additional intronic cleavage site in PEX13 within the intronic TE, suggesting multiple IPA cleavage sites around this locus. However, the complexity of the locus and bulk RNA-seq resolution constrained IPAseek's ability to reliably detect the additional site (detected at multiple time points but not consistently across replicates).
Megakaryocytic differentiation was induced in K562 cells using 25 nM PMA and confirmed by phase-contrast microscopy showing hallmark morphological changes (Fig. 4E) and upregulation of ITGB3, a megakaryocyte marker (Bond et al. 2023) (Supplemental Fig. S4D). In-house time course validation showed ACOT8 IPA site usage increasing and PEX13 IPA site usage decreasing over time (Fig. 4F,G), mirroring bulk RNA-seq patterns determined from the data set obtained from the public domain (Supplemental Fig. S4E,F). Together, these results demonstrate that IPAseek captures stage-specific IPA events during megakaryocyte differentiation.
Comprehensive atlas of IPA events reveals lineage and stage-specific regulation in hematopoietic lineage
To systematically characterize IPA events across hematopoietic cell types, we constructed an IPA atlas using bulk RNA-seq data from 78 samples representing 10 hematopoietic populations, including differentiated cells (myeloid: granulocytes, monocytes; lymphoid: naive B cells, CD4+/CD8+ T cells, NK cells) and undifferentiated precursors (granulocytic, monocytic, erythroid precursors, and CD34+ HSPCs).
To assess whether IPA site usage distinguishes cell lineages and differentiation states, PCA followed by k-means clustering (k = 3) of IPA site usage in differentiated cells (GEO; GSE184264) revealed three distinct clusters: granulocytes (myeloid; cluster 1, n = 7, silhouette width = 0.36) and lymphoid/monocytes (clusters 2/3, n = 13/19, silhouette width = 0.52/0.56), with an overall average silhouette width of 0.511 (Fig. 5A; Supplemental Fig. S5C). To further enhance the separation, we repeated the PCA and clustering excluding granulocytes (Supplemental Fig. S5A). In this subset, k-means (k = 5) identified five clusters, with most monocyte samples (five out of seven) forming cluster 1, and all lymphoid samples distributed among the remaining clusters. For undifferentiated precursors (GEO; GSE114922), k-means clustering (k = 4) identified four groups, with HSPCs dominating clusters 1/2 (n = 65/17, silhouette width = 0.49/0.71) and an overall average silhouette width 0.52 (Fig. 5B; Supplemental Fig. S5D). Given the higher number of HSPC samples, we performed PCA and clustering after excluding HSPCs (Supplemental Fig. S5B). This analysis identified three groups, with granulocytic precursors and monocytic precursors primarily clustering together (cluster 1), demonstrating their lineage similarity. We did this independently for the two data sets to avoid factors like differences in sample preparation, sequencing techniques, etc., that could convolute the interpretation of results.
Immune cell IPA atlas and functional enrichment analysis. (A) Principal component analysis (PCA) of differentiated immune cell types from the NCBI Gene Expression Ominbus (GEO; https://www.ncbi.nlm.nih.gov/geo/) data set GSE184264 based on IPA site usage. Three clusters identified through k-means clustering are indicated by dotted enclosures. The plot reveals clear segregation between the myeloid (clusters 1 and 2) and lymphoid (clusters 2 and 3) lineages, reflecting distinct lineage-specific IPA patterns. The analysis includes 4994 IPA events across 39 samples. (B) PCA of undifferentiated immune cell types from GEO data set GSE114922 based on IPA site usage. Four clusters identified through k-means clustering are indicated by dotted enclosures. The analysis reveals separation between the individual cell types, emphasizing their unique IPA signatures (no. of IPA = 592, no. of samples = 108). (C) Heatmap of IPA site usage across differentiated immune cell types, showcasing myeloid- and lymphoid-specific enrichment patterns. Each row represents a unique IPA isoform (n = 1863), and columns correspond to individual immune cell samples (n = 42). Rows are color-coded to indicate enrichment status: myeloid-enriched IPAs in seafoam green and lymphoid-enriched IPAs in dark orange. IPA site usage is quantified on a zero-to-one scale relative to full-length isoform usage, with the color intensity reflecting the degree of IPA site usage. Statistical significance was determined using the Wilcoxon rank-sum test with Benjamini–Hochberg FDR correction (P-adj < 0.05). (D) Heatmap of IPA site usage across undifferentiated immune cell types, focusing on the cell types shown in B. Each row represents a unique IPA isoform (n = 431), and columns denote individual immune cell samples (n = 108). Statistical significance for enrichment in specific cell types was assessed using the Kruskal–Wallis test with Benjamini–Hochberg FDR correction (P-adj < 0.05). IPA site usage is displayed on a zero-to-one scale, with color intensity indicating the degree of IPA site usage. (E) Differential IPA site usage between the myeloid and lymphoid lineages, with RPN1 shown as an example of a lineage-specific IPA event. Bulk RNA-seq read coverage (in TPM) over the RPN1 locus is visualized across different immune cell types. Read coverage was calculated using uniquely mapping reads.
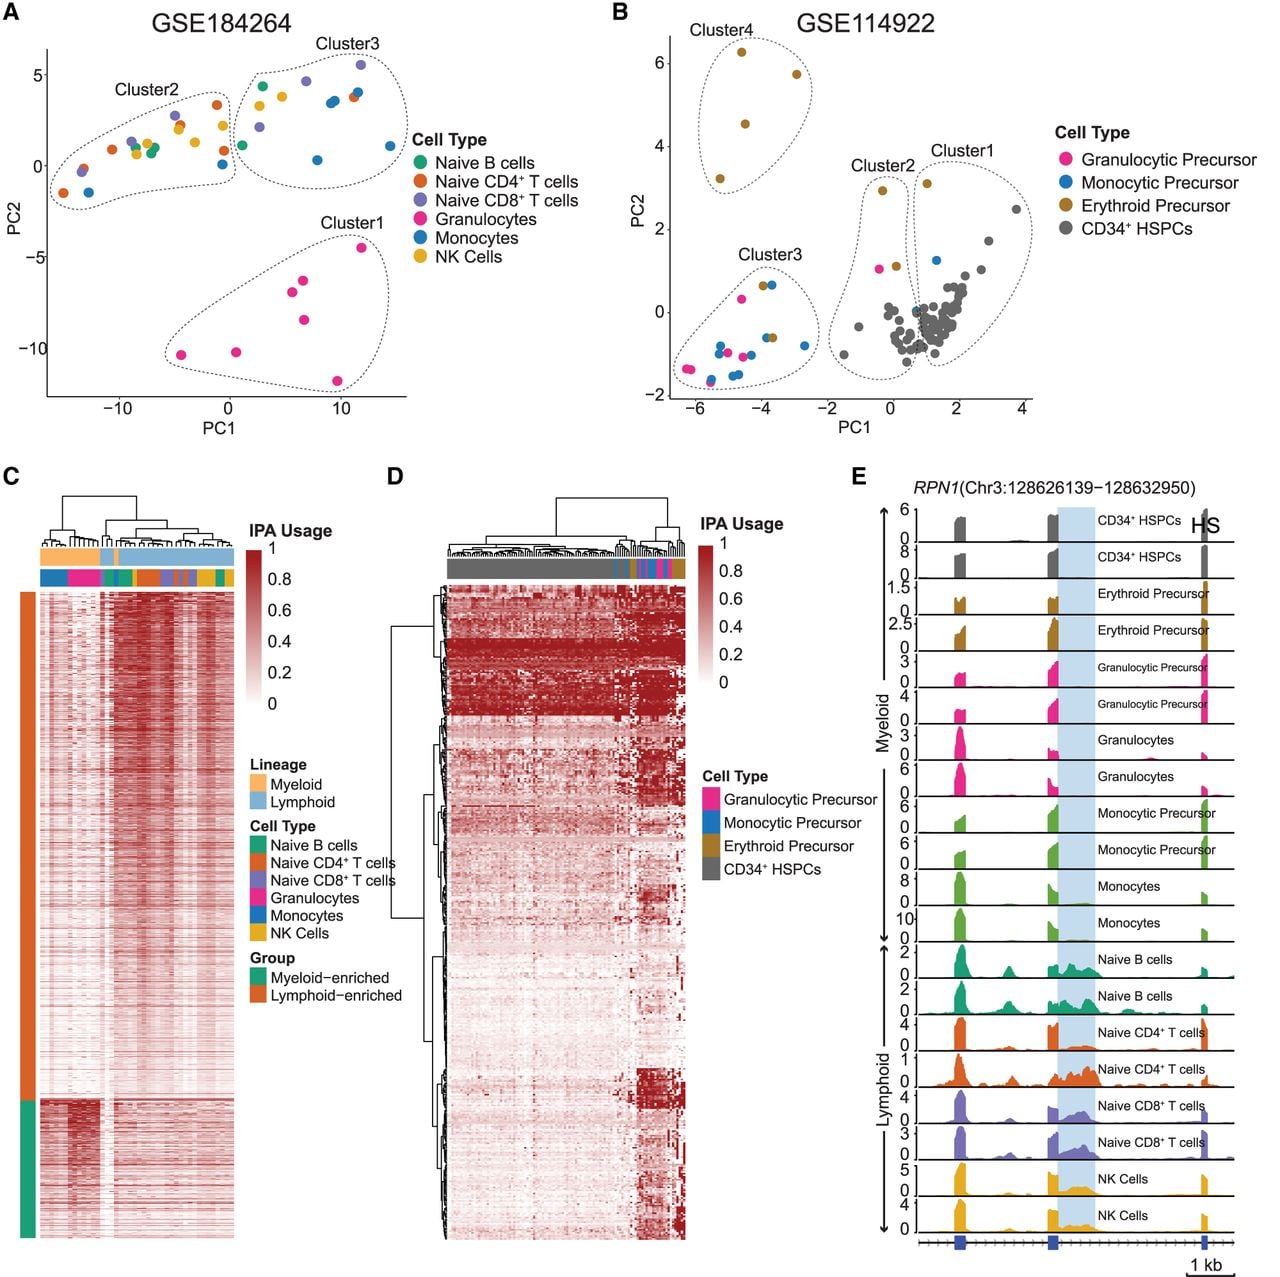
To identify lineage-enriched IPA events, differential analysis between myeloid and lymphoid lineages identified 981 lineage-enriched IPA events (Wilcoxon rank-sum test, P-adj < 0.05), with hierarchical clustering revealing clear separation (Fig. 5C). Similarly, analysis of 36 undifferentiated precursor samples identified 372 cell-type-specific IPA events (Kruskal–Wallis test, P-adj < 0.05), showing distinct patterns among granulocytic precursors, monocytic precursors, and CD34+ HSPCs (Fig. 5D).
RPN1 exemplified lymphoid-enriched IPA site usage (Fig. 5C,E), with bulk RNA-seq coverage confirming approximately 4.5-fold higher IPA site usage in lymphoid versus myeloid cells (Wilcoxon rank-sum test, P-adj < 0.05). Together, these validated clusters and differential analyses demonstrate lineage and stage-specific IPA regulation during hematopoiesis.
Distinct DNA methylation landscapes surround IPA sites in hematopoietic lineage cells
Although IPA is widespread, gene and cell-type-specific, and responsive to stimuli, we know little about factors enhancing or preventing the recognition of PAS sites in introns (Lee et al. 2018; Singh et al. 2018). Epigenetic modifications like DNA methylation modulate gene expression without altering DNA sequence, which is analogous to regulated IPA site recognition, although IPA differs from 3′-UTR APA owing to concurrent splicing.
Prior studies showed DNA methylation ablation increases proximal PAS usage by disrupting CTCF/cohesin binding (Nanavaty et al. 2020; Fink et al. 2025) and influences allele-specific IPA of imprinted genes H13/Nap1l5 (Wood et al. 2008; Cowley et al. 2012). No studies have investigated DNA modifications regulating cell-type-specific IPA site usage in its endogenous state. We therefore examined how the endogenous DNA methylation state impacts IPA site selection across immune cells and cancers.
To test this systematically, we integrated 198 bulk RNA-seq and 189 BS-seq samples (RRBS/WGBS) across 12 immune cell types (Supplemental Fig. S6A,B). IPAseek identified IPA sites from RNA-seq data. We compiled PAS signals and categorized them as “used” (within 200 bp of high-confidence IPA: RPKM ≥ 0.5, usage ≥10% in ≥10% samples) or “unused” to control for sequence biases (Supplemental Fig. S6C).
Among 910 used and 1820 unused PAS (more than 5.7 million methylation sites), used PAS consistently exhibited higher surrounding DNA methylation (Kolmogorov–Smirnov test, P-value ≤ 9.88 × 10−270) (Fig. 6A), indicating methylation influences PAS recognition. This pattern persisted across cell types: B cells (679 vs. 1358, P-value ≤ 5.14 × 10−177) (Fig. 6B), CD14+ monocytes (325 vs. 650, P-value ≤ 3.94 × 10−244) (Fig. 6C), and AML cells (552 vs. 1104, P-value < 10−244) (Fig. 6D), each analyzing 2.95 million to 3.4 million sites.
Epigenetic regulation of IPA in immune cells. (A) Integrated methylation analysis at IPA sites. Metagene analysis of DNA methylation patterns within ±2500 bp of PAS revealed distinct epigenetic landscapes between used (orange) and unused (navy) PAS loci. Used PAS sites exhibited significantly higher methylation levels across all samples compared with unused PAS (Kolmogorov–Smirnov test, P-value ≤ 9.88 × 10−270), with mean methylation differences persisting across the entire genomic window. This analysis encompassed 910 used PAS sites, 1820 unused PAS sites, and about 5.7 million genomic methylation sites. (B) The cell-type-specific methylation state around IPA sites in B cells. Metagene analysis of DNA methylation within ±2500 bp of PAS in B cells revealed distinct epigenetic profiles between used (orange) and unused (navy) PAS loci. Used PAS sites exhibited higher methylation levels compared with unused PAS sites across the entire genomic window (Kolmogorov–Smirnov test, P-value ≤ 5.14 × 10−177). This analysis included 679 used PAS sites, 1358 unused PAS sites, and about 3.4 million methylation sites. (C) Cell-type-specific methylation patterns at IPA sites in CD14+ cells. Metagene analysis of DNA methylation within ±2500 bp of PAS in CD14+ cells revealed that used PAS sites (orange) are consistently flanked by higher methylation levels compared with unused PAS sites (navy; Kolmogorov–Smirnov test, P-value ≤ 3.94 × 10−244). This analysis included 325 used PAS sites, 650 unused PAS sites, and ∼2.95 million methylation sites. (D) DNA methylation landscapes at IPA sites in AML. Metagene analysis of DNA methylation within ±2500 bp of PAS sites in AML demonstrates that used PAS sites (orange) are consistently associated with higher levels of DNA methylation compared with unused PAS sites (navy; Kolmogorov–Smirnov test, P-value < 10−244). This analysis encompassed 552 used PAS sites, 1104 unused PAS sites, and about 2.4 million methylation sites. (E) Rolling window analysis of DNA methylation in IPA and non-IPA introns. Mean DNA methylation levels (y-axis) were calculated for IPA introns (violet), non-IPA introns within IPA genes (yellow), and introns from genes without IPA events (brown) using a sliding window of 100 bp along the intron length (x-axis) with a 50 bp step size. This analysis included 696 IPA introns, 1758 non-IPA introns from IPA genes, and 1303 introns from non-IPA genes, encompassing about 5.7 million methylation sites in total. IPA introns consistently showed significantly higher methylation levels across their entire length compared with both non-IPA introns and introns from non-IPA genes (Kolmogorov–Smirnov test, P-value ≤ 2 × 10⁻¹⁶ for both comparisons). (F) Heatmap of IPA site usage and mean methylation in the introns with differentially methylated sites (GSE184314). The left heatmap shows the mean methylation in the introns coming from differentially methylated sites, and the right heatmap shows the IPA site usage in the corresponding introns. Each row represents a unique intron (n = 101), and columns correspond to individual patient samples (n = 10). Rows are color-coded to indicate the differential methylation status in the introns: hypermethylation (green; n = 38) and hypomethylation (orange; n = 63). Columns are color-coded to indicate the sample groups: control (blue; n = 5) and diseased (pink; n = 5). Methylation is quantified on a zero-to-one scale (blue) with the color intensity reflecting the degree of methylation, and IPA site usage is quantified on a zero-to-one scale (red) relative to full-length isoform usage, with the color intensity reflecting the degree of IPA site usage. (G) Density plot of IPA site usage in introns with differentially methylated sites. Density plots compare IPA site usage in introns harboring differentially methylated sites, separated into hypomethylated (left) and hypermethylated (right) groups as identified in F. In the hypomethylated group (n = 380), IPA site usage differs significantly between the control (blue) and diseased (pink) samples (Wilcoxon paired test, P-value ≤ 3 × 10 −10), whereas in the hypermethylated group (n = 630), no significant difference is observed (Wilcoxon paired test, P-value < 0.56). (H) Heatmap of IPA site usage and mean methylation in the introns with differentially used IPA sites (GSE184314). The left heatmap shows the IPA site usage in the introns coming from differentially used IPA sites, and the right heatmap shows the methylation in the corresponding introns. Each row represents a unique intron (n = 102), and columns correspond to individual patient samples (n = 10). Rows are color-coded to indicate the differential IPA site usage status in the introns: highly used (dark green; n = 36) and lowly used (brown; n = 66). Columns are color-coded to indicate the sample groups: control (blue; n = 5) and diseased (pink; n = 5). Methylation is quantified on a zero-to-one scale (blue) with the color intensity reflecting the degree of methylation, and IPA site usage is quantified on a zero-to-one scale (red) relative to full-length isoform usage, with the color intensity reflecting the degree of IPA site usage. (I) Density plot of methylation levels in introns with differentially used IPA sites. Density plots illustrate methylation levels in introns containing differentially used IPA sites, divided into highly used (left) and lowly used (right) groups as defined in H. For highly used IPA sites (n = 660), a modest but significant difference in methylation is observed between the control (blue) and diseased (pink) samples (Wilcoxon paired test, P-value < 0.15). In contrast, lowly used IPA sites (n = 360) show a pronounced and highly significant methylation difference between the groups (Wilcoxon paired test, P-value ≤ 2.1 × 10⁻¹⁰).
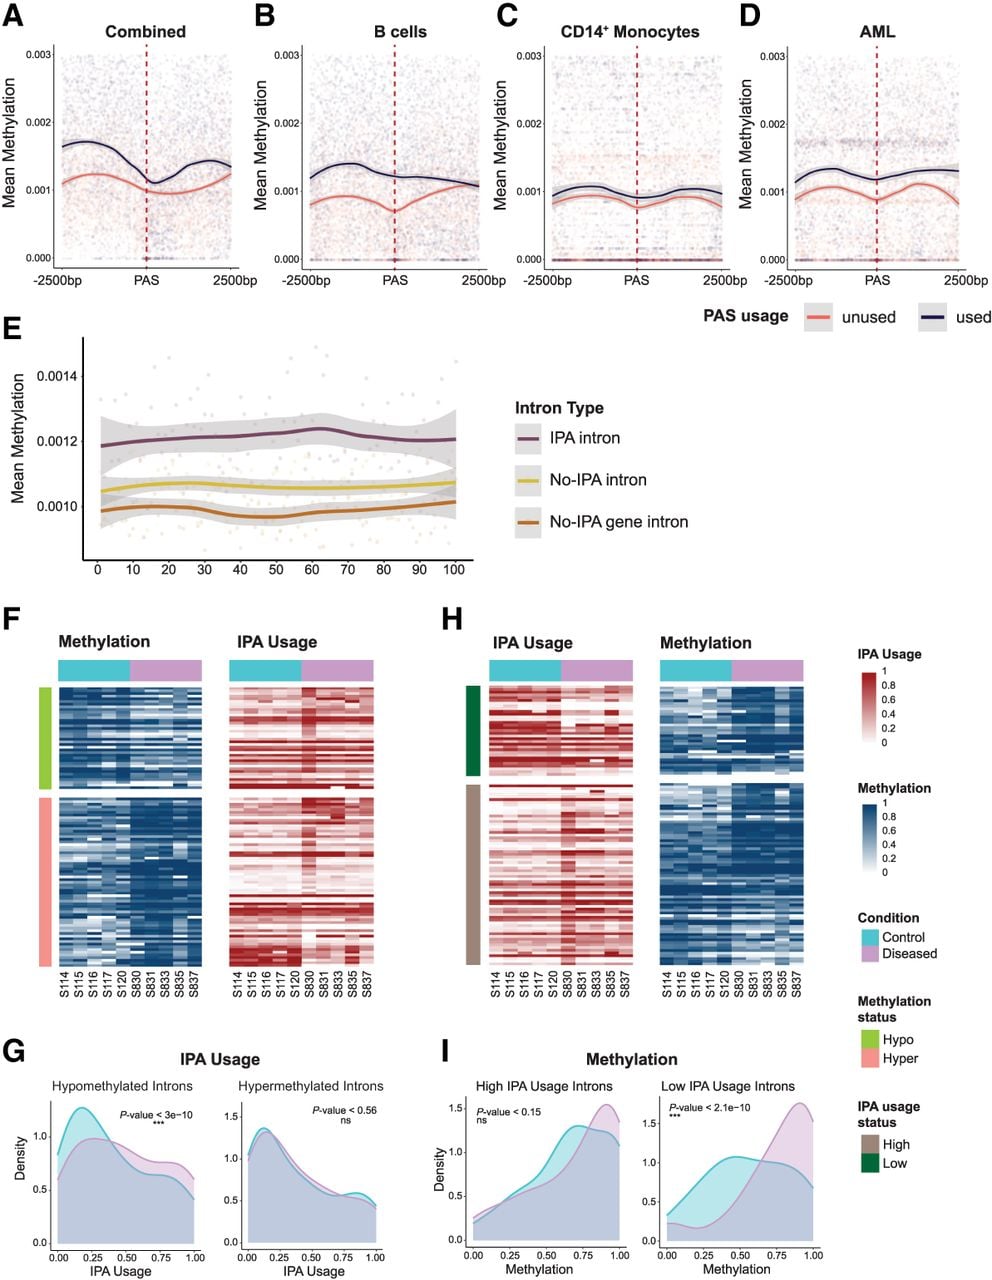
To test if methylation differences extend intron-wide, we performed rolling window (100 bp windows, 50 bp steps) and equal-tile (500 bins) analyses comparing IPA introns (n = 696) to non-IPA introns from IPA genes (n = 1758) and non-IPA genes (n = 1303; KS-test P-value ≤ 2 × 10⁻¹⁶) (Fig. 6E; Supplemental Fig. S6D). Higher methylation across IPA introns suggests broader chromatin context influences cleavage.
To determine if methylation changes drive IPA site usage changes, we analyzed GEO data set GSE184314 (CD4+ cells), in which hypomethylated introns (n = 80) were enriched for increased IPA site usage (Fisher's exact, P-value ≤ 2.78 × 10⁻³) (Fig. 6G), whereas hypermethylated introns (n = 135) showed no association (Fig. 6F,G). Reciprocally, low-usage IPA introns (n = 19) were enriched for increased methylation (P-value ≤ 5.24 × 10⁻³) (Fig. 6H), but high-usage introns (n = 34) showed no association (Fig. 6H,I). Patterns were partially replicated in GEO data set GSE66117 (Supplemental Fig. S7A) but were inconsistent elsewhere (Supplemental Fig. S7B–F).
Collectively, increased intronic DNA methylation correlates with reduced IPA site usage across contexts, although causality remains untested. Unlike distal CpG island effects on APA, we found robust proximal (≤2500 bp) methylation–IPA associations (Fig. 6A–E).
Discussion
In this study, we present IPAseek, a computational framework that leverages dynamic programming and changepoint detection algorithms to accurately identify IPA events from bulk RNA-seq data. Unlike previous methods primarily focused on 3′-UTR APA, IPAseek robustly detects both composite and skipped IPA isoforms, addressing challenges posed by complex splicing patterns and complexity in intronic regions. Our benchmarking against paired 3′-end sequencing data and its comparison with established tools such as IPAFinder and InPACT demonstrate that IPAseek achieves superior sensitivity and precision, enabling the discovery of IPA events that were also validated by orthogonal techniques like 3′-RACE. This advancement fills a critical gap in transcriptome analysis, as IPA has been historically undercharacterized despite its emerging importance in gene expression regulation (Gruber et al. 2018; Singh et al. 2018).
Applying IPAseek to a comprehensive data set of immune cell types and hematopoietic differentiation time course, we reveal that IPA site usage is highly dynamic and exhibits lineage and stage-specific patterns. Consistent with previous reports indicating that IPA contributes to transcriptome diversification in hematopoietic cells, we observed that lymphoid cells exhibit higher IPA site usage compared with myeloid cells. This finding aligns with the notion that IPA modulates immune cell identity and function, as exemplified by the well-characterized IPA of the immunoglobulin M heavy-chain (IGHM) locus, which controls the production of secreted versus membrane-bound IgM isoforms in B cells (Early et al. 1980; Takagaki and Manley 1998). Our temporal profiling during megakaryocyte differentiation further highlights gene-specific IPA regulation linked to key biological processes like autophagy, extending prior observations that IPA influences gene expression programs during differentiation and stress responses (Thomas et al. 2012; Cheng et al. 2020).
A major contribution of our study is the integrative analysis of endogenous DNA methylation state and IPA site usage, which uncovers a previously underappreciated epigenetic layer modulating IPA. We demonstrate that introns containing IPA sites exhibit elevated DNA methylation compared with non-IPA introns, a pattern that holds true across multiple cell types. This observation is in line with recent findings that DNA methylation can influence APA by modulating chromatin architecture and the recruitment of RNA processing factors (Cowley et al. 2012; Smith 2019; Nanavaty et al. 2020; Jia et al. 2024; Fink et al. 2025). For instance, DNA methylation-dependent CTCF binding has been shown to regulate APA site choice by altering chromatin looping and polymerase pausing, thereby affecting transcript isoform diversity. Our results extend these insights by demonstrating a genome-wide association between methylation and IPA site usage, supported by enrichment in hypermethylated introns exhibiting reduced IPA site usage.
The complex relationship between methylation and IPA site usage we observed suggests that DNA methylation acts as a context-dependent modulator rather than a simple on/off switch. We observed that hypermethylation is associated with the suppression of IPA. This finding underscores the need for further mechanistic studies to dissect how epigenetic states integrate with RNA processing machinery to fine-tune transcript isoform expression in a cell-type-specific and condition-specific manner.
The biological implications of our findings are profound. IPA-mediated transcript truncation can generate noncoding RNAs or protein isoforms with altered functional domains, impacting processes such as immune signaling, cell fate determination, and disease progression. Dysregulated IPA has been implicated in cancer, in which IPA events can produce truncated tumor suppressors or oncogenic isoforms, contributing to tumorigenesis and therapy resistance (Ni and Kuperwasser 2016; Lee et al. 2018; Li et al. 2020; Zhao et al. 2021; Cheng et al. 2024). Our demonstration that DNA methylation is associated with IPA site selection suggests an epigenetic mechanism by which cancer cells and immune cells may modulate transcriptome complexity to adapt to environmental cues.
IPAseek's scalability and accuracy make it a valuable tool for future investigations into the regulatory landscape of IPA across diverse biological contexts. Integrating IPA detection with epigenomic profiling will be important to elucidate how IPA contributes to development and disease. Future studies leveraging single-cell and long-read sequencing technologies may further resolve IPA isoform heterogeneity and its functional consequences at higher resolution. Additionally, experimental perturbation of DNA methylation and chromatin modifiers will be essential to establish causal links between epigenetic states and IPA regulation.
In conclusion, our work establishes IPAseek as a platform for dissecting the complexity of IPA and its epigenetic regulation. By revealing the dynamic interplay between DNA methylation and IPA site usage, we provide insights into the multilayered control of gene expression.
Methods
IPAseek algorithm
Intron preprocessing
We obtained the human genome annotation (version hg38) from UCSC RefSeq (table name: refGene) and flattened the entire genome, annotating each position with a genomic region: intron, CDS, 3′ UTR, 5′ UTR, ncRNA, or intergenic, according to the RefSeq annotation. Upstream/downstream regulatory regions were defined as 5 kb extensions from 5′ UTR (5′ UTR*) and 3′ UTR (3′ UTR*) to capture potential regulatory elements influencing the gene expression. When annotating overlapping regions, we applied the following priority order: CDS > 5′ UTR > intron > 3′ UTR and CDS+3′ UTR. Intronic regions were filtered using
Sample preprocessing
For each sample, reads/FASTQ files were aligned to the reference genome using STAR (v2.7.10a) with default parameters (Dobin et al. 2013). To reduce FP coverage signals, only uniquely mapped reads (MAPQ ≥ 255) were retained. Gene expression quantification used RPKM normalization:
Retained intron identification and filtering
The IPA detection begins with calculating per-base read coverage from uniquely mapping reads over filtered introns derived from expressed genes. This step also includes calculating coverage for the CDS flanking the introns under consideration. Following the coverage calculations, we focus on removing retained introns, as these are unlikely to contain premature cleavage sites (Monteuuis et al. 2019). We established four specific criteria for classifying an intron as retained: (1) a minimum of three reads spanning the intron–exon junction, (2) at least 85% of the intron covered by reads, (3) median coverage over the flanking exons exceeding 0.5 RPKM, and (4) a ratio of median coverage over the intron to median coverage over the upstream exon of at least 5% (Middleton et al. 2017). Any intron meeting all four conditions was classified as a retained intron and excluded from further analysis. For the remaining introns, we ensured that they have read coverage to contain a potential TE by checking for a read coverage of at least five over a contiguous stretch of 100 bp. Introns failing to meet this criterion were also excluded from analysis. The next critical step involves detecting significant changepoints in read coverage within the introns, utilizing the PELT algorithm.
Changepoint detection in introns using PELT
The PELT algorithm is an efficient and exact method for detecting multiple changepoints in time series data. It minimizes a penalized cost function that balances segmentation fit with model complexity, defined as
For bulk RNA-seq analysis, PELT is particularly advantageous owing to its ability to adaptively detect abrupt changes in coverage patterns, which may indicate biologically meaningful events such as IPA sites. By adjusting parameters like the penalty value
By combining PELT with CROPS, we detected abrupt changes in expression coverage patterns within introns that may correspond to IPA events. The adaptability of this approach allowed us to optimize detection sensitivity while maintaining computational efficiency critical for genome-scale analyses. This method demonstrated robust performance in identifying potential IPA sites while efficiently handling large data sets.
Changepoint selection
Next, we assessed whether the detected changepoints met IPA conditions. This was achieved by calculating the number of spliced reads within ±50 bp of each changepoint and evaluating RPKM coverage within ±200 bp. For cases in which a single changepoint was identified within an intron, we checked for composite IPA conditions, requiring that the median coverage upstream of the changepoint exceeded the median coverage downstream, with no splice reads present within ±50 bp of the changepoint. When multiple changepoints were detected within an intron, adjacent changepoints were analyzed iteratively in pairs to distinguish between composite IPA and skipped IPA scenarios. For composite IPA detection using changepoint pairs, two conditions had to be satisfied: (1) the median coverage upstream of changepoint 1 must exceed the median coverage downstream from changepoint 1, and (2) the median coverage upstream of changepoint 2 must exceed the median coverage downstream from changepoint 2. Additionally, no splice reads could be present within ±50 bp of either changepoint. For skipped IPA scenarios, different criteria were applied: (1) the median coverage upstream of changepoint 1 must be lower than the median coverage downstream from changepoint 1, whereas (2) the median coverage upstream of changepoint 2 must exceed the median coverage downstream from changepoint 2. Furthermore, changepoint 1 required >5% spliced reads within ±50 bp, whereas no splice reads could be present within ±50 bp of changepoint 2. (Supplemental Fig. S1).
Once potential IPA sites are identified, we annotate the new TE associated with each IPA event. For composite IPA events, the end of the upstream CDS is designated as the start site of the TE, whereas the IPA site serves as the end site. For skipped IPA events, the start of the new TE is defined by changepoint 1, and its end is marked by changepoint 2. This approach ensures accurate annotation of TEs for both types of IPA scenarios.
Additional filtering for significant IPA sites
To enhance significance, we applied a few additional filters: first, ensuring that coverage (RPKM) 200 bp upstream of each IPA site was greater than 0.5 and, second, performing differential expression analysis between three contiguous 100 bp windows upstream of and downstream from each changepoint using DESeq2 (version 1.46.0) (Love et al. 2014). Only those IPA sites with P-adj ≤ 0.2 and P-value ≤ 0.1 were deemed significant for downstream analysis. Additionally, we filtered out new TEs for ≥0.5 RPKM expression. Sites passing these stringent conditions were classified as valid IPA sites along with their respective annotated TEs designated as TEs for the corresponding IPA isoforms.
Construction of an IPA atlas and quantification of IPA site usage across samples
IPAseek can be utilized to create an atlas of IPA events across multiple samples. Because of the resolution limitations of bulk RNA-seq, the same IPA site may be detected a few nucleotides apart in different samples. To address this redundancy when combining IPA events from multiple samples, we merge IPA events that share the same classification (e.g., composite or skipped) and have TE ends annotated within 100 bp of each other. For these merged IPA events, the TE end is assigned as the median of the TE ends from the individual IPA events being combined.
Once the atlas of IPA events is constructed, we assign a binary confidence value to each event. IPA events detected in two or more samples are classified as “confident,” whereas those occurring in only a single sample are labeled as “not confident.”
After generating the atlas, we quantify the usage of each IPA event in individual samples. IPAseek calculates the relative usage of an IPA isoform by comparing the expression of its TE to the combined expression of the gene's last coding exon and its TE. This metric, referred to as IPA site usage, provides a normalized measure of how frequently an IPA isoform is utilized relative to other isoforms. The formula for IPA site usage is as follows:
Benchmarking IPAseek against established IPA detection methods
To evaluate the performance of IPAseek in detecting IPA sites, we conducted a comparative analysis using four test samples with matched RNA-seq and 3′-seq data (for details, see Supplemental Table S1). IPA sites expressed at five or more TPM from the 3′-seq data served as the ground truth, whereas corresponding RNA-seq samples were processed using IPAseek to identify IPA sites.
To benchmark IPAseek against existing IPA detection methods, we analyzed the same test samples using InPACT and IPAFinder. Because of the resolution constraints of RNA-seq data, IPA sites detected within 350 bp of the ground truth were classified as TPs. Ground-truth IPA sites that were not detected in RNA-seq were considered FNs, whereas sites detected in RNA-seq but absent in the ground truth were categorized as FPs. These FPs were further referred to as uncharacterized IPA sites in downstream analyses. This framework enabled a systematic comparison of IPAseek's accuracy and sensitivity relative to established methods, while accounting for bulk RNA-seq limitations.
To quantify performance, we calculated precision, recall, and F1-score for each method. The formulas used are as follows:
Annotation assessment of uncharacterized IPA sites
All methods identified uncharacterized IPA sites in the test samples that were either absent or not expressed in the corresponding 3′-seq data sets. To investigate these uncharacterized sites further, we searched for potential 3′-end annotations in external databases, including PolyAsite, RefSeq, and Ensembl (O'Leary et al. 2016; Herrmann et al. 2020; Martin et al. 2023). As a first step, we examined the respective 3′-seq data sets to identify any potential annotations among the unexpressed candidates. For uncharacterized sites without annotation in the 3′-seq data, we searched within ±350 bp of the annotated 3′-UTR end sites in PolyAsite, RefSeq, and Ensembl, following this order of priority. Uncharacterized sites that lacked annotation in any of these sources were categorized as unannotated.
IPA detection and quantification during myeloid progenitor to megakaryocyte differentiation
Bulk RNA-seq data from 16 samples, spanning eight time points (0 min, 30 min, 90 min, 180 min, 360 min, 1440 min, 2880 min, and 4320 min) with two replicates per time point, were obtained from the NCBI Gene Expression Ominbus (GEO; https://www.ncbi.nlm.nih.gov/geo/) under accession number GSE213909. These samples capture the differentiation of K562 cells into megakaryocytes. The raw RNA-seq reads were aligned to the human reference genome (GRCh38) using STAR, and BAM files were filtered to retain only uniquely mapped reads. IPAseek was then applied to identify IPA sites, construct an atlas of IPA events, and calculate IPA site usage for each event across all 16 samples.
Experimental validation of IPA candidates
3′-RACE
The 3′-RACE was performed using the SMARTer RACE 5′/3′ kit (Takara 634858). Briefly, total cell RNA was extracted from K562 cells and converted to cDNA using SMARTer scribe reverse transcriptase. The specific genes were amplified from cDNA by gene-specific primers in the exonic region of IPA along UPM followed by a PCR with a nested gene-specific primer. The amplified product was then cloned into a pRACE vector using infusion cloning and sent to sequencing to obtain the 3′-end sequence of the RNA. A list of primer used is in Supplemental Table S3.
Furthermore, we generated a FASTA file containing the primer sequences and aligned them to the reference genome using Bowtie 2 (Langmead and Salzberg 2012). The resulting BAM file was processed with BEDTools (Quinlan and Hall 2010) to create a BED file corresponding to the primer positions. These coordinates were used to show the position of RACE primers on the Gviz tracks and have been provided in Supplemental Table S3 along with the primer sequences.
Megakaryocyte differentiation from K562 cells
K562 cells were maintained in Iscove's Modified Dulbecco's Medium (IMDM; Gibco 12440053) supplemented with 10% fetal bovine serum (FBS), and penicillin–streptomycin (Gibco 15140122). The differentiation of K562 to megakaryocyte was performed according to a method previously described (Bond et al. 2023). Briefly, 1 × 10⁵ /mL of K562 cells was seeded in complete media and treated with 25 nM of phorbol 12-myrisate 13-acetate (PMA) for six spanning time points (6, 12, 24, 48, 72, and 96 h). Media was changed after every 24 h with supplementation of fresh PMA. Cells were harvested at 6, 12, 24, 48, 72, and 96 h. Cells supplemented with 0.0025% DMSO for 96 h were used as control.
The differentiation of K562 to megakaryocyte was confirmed by ITGB3, a marker whose expression increases in megakaryocyte state. We used another gene, KLF1, an erythroid marker, as a negative control whose expression decreases in megakaryocyte state. The expression of the genes was confirmed using qRT-PCR at 24, 48, and 72 h.
RNA isolation and real-time PCR
Total RNA was isolated using TRIzol reagent (MRC TR118) by a phenol–chloroform extraction method. Cell pellets were resuspended in TRIzol and phase-separated with chloroform, and the RNA was precipitated with isopropanol followed by washing with 75% ethanol. The pellet was then air-dried and resuspended in RNase-free water. The RNA was converted to cDNA using a qScript cDNA SuperMix kit (Quantabio 95048-100) as per the manufacturer's instructions. PowerUp SYBR green master mix (Applied Biosystems, A25778) was used to qRT PCR. A 25–50 ng RNA template was used for qRT PCR. Primers used for qRT PCR are listed in Supplemental Table S3. The relative expression was calculated using a 2 − ΔΔCt method, and IPA site usage was calculated by using (Singh et al. 2018).
Construction and analysis of an immune cell IPA atlas
To construct an atlas of IPA events in immune cells, we downloaded bulk RNA-seq data from 42 samples under GEO accession number GSE184264 and 36 samples from GSE114922. These data sets encompass 10 immune cell types, including naive B cells, naive CD4+ T cells, naive CD8+ T cells, granulocytes, monocytes, natural killer cells, granulocytic precursor cells, monocytic precursor cells, erythroid precursor cells, and CD34+ hematopoietic stem progenitor cells (for details, see Supplemental Table S4). Using IPAseek, we processed the 42 samples to identify IPA sites and construct the immune cell IPA atlas. Highly confident IPA events were defined as those with corresponding TEs expressed at RPKM ≥ 0.5 in and IPA site usage ≥10% in at least 10% samples of any sample group. Cell-type-specific IPA events were identified by selecting highly confident IPA events detected in at least two samples associated with a given cell type. We performed PCA followed by k-means clustering on the samples from GSE184264 and GSE114922 separately to identify the separation between the sample groups based on the IPA site usage.
For differential analysis of IPA site usage between two groups (e.g., cell types or lineages), we performed a Wilcoxon rank-sum test for each IPA event and calculated the overall mean IPA site usage as well as group-specific means (group1_mean and group2_mean). P-values were adjusted using the Benjamini–Hochberg FDR correction. IPA events with P-adj < 0.05 were classified as enriched. If group1_mean was higher, the event was labeled as “group1 enriched”; otherwise, it was labeled as “group2 enriched.” For comparisons involving more than two groups (e.g., multiple cell types), we applied the Kruskal–Wallis test for each IPA event, followed by FDR correction. Events with P-adj < 0.05 were identified as enriched IPA events.
Relation between IPA and DNA methylation in immune cells
Identification of matched RNA-seq and BS-seq samples
To explore the relationship between IPA site selection and DNA methylation, we curated 198 bulk RNA-seq and 189 BS-seq samples (RRBS/WGBS) from ENCODE (https://www.encodeproject.org/) (primary cells), the database of Genotypes and Phenotypes (dbGaP; https://dbgap.ncbi.nlm.nih.gov/home/) (phs001027), and GEO (GSE165305, GSE214980, GSE184314, GSE156563, GSE130582, GSE66117, GSE173790, GSE128269, GSE193201). These represented 12 immune cell types: B cells, NK cells, T cells, CD14+ cells, PTCL, CD4+ cells, B-ALL, T helper cells, HSPCs, PBMC-reprogrammed iMSCs, AML, and NBM (see Supplemental Table S6).
IPA site atlas construction
IPAseek identified IPA events through intron preprocessing, STAR alignment with RPKM normalization, PELT changepoint detection, and validation using splice read exclusion and RPKM thresholds. Events within 100 bp were merged, and confidence was assigned based on detection frequency.
Methylation data processing pipeline
BS-seq reads were trimmed (Trim Galore! v0.6.10; https://www.bioinformatics.babraham.ac.uk/projects/trim_galore/), aligned to bisulfite-converted GRCh38 (Bismark v0.24.1), and deduplicated, and methylation calls were extracted (Krueger and Andrews 2011).
Methylation atlas generation
Using edgeR v4.4.2 (Robinson et al. 2010; Chen et al. 2018), sites were filtered (10 or more reads, ≥50% methylation in two or more samples) and annotated to GRCh38 gene bodies. Methylation levels were calculated as the proportion of methylated reads. Next, we classified the PAS sites into used and unused and performed the integrative analysis of methylation patterns around IPA sites using rolling window and equal-tile analysis (for details, see Supplemental Methods).
Data sets
A detailed description of the data sets used in study is provided in Supplemental Tables S1, S4, S5, and S6. 3′-seq and bulk RNA-seq data sets for testing and benchmarking IPAseek were downloaded from GEO accession numbers GSE111793 and GSE111310 (test samples 2–18, test samples 1 and 2 are provided as raw data on IPAseek GitHub repository). Bulk RNA-seq data sets for studying the temporal dynamics of IPA during megakaryocyte differentiation were downloaded from GEO accession number GSE213909. Bulk RNA-seq data sets from GSE184264 and GSE114922 were used for making IPA atlas for immune cells. For understanding the interplay between IPA site usage and DNA methylation, the RNA-seq and matched BS-seq (RRBS or WGBS) samples were used from ENCODE, GEO (GSE165305, GSE214980, GSE184314, GSE156563, GSE130582, GSE66117, GSE173790, GSE128269, GSE193201), and dbGaP (phs001027).
Code availability
IPAseek is an open-source method available at GitHub (https://github.com/isinghlab/IPAseek.git) and as Supplemental Code.
Competing interest statement
The authors declare no competing interests.
Acknowledgments
This work was supported by the National Institute of Neurological Disorders and Stroke (1R21NS121945), the National Cancer Institute (1R01CA282251), and the Cancer Prevention and Research Institute of Texas (RP230204), and a Texas A&M Health Science Center seedling grant awarded to I.S. We thank all Singh laboratory members in the group for their assistance and constructive suggestions. We also acknowledge the technical support by the high-performance research computing resources at Texas A&M University. Artificial intelligence–based tools were used exclusively for language editing and text refinement.
Author contributions: I.S. and R.R. conceived and designed the study. I.S. supervised the study and data analysis. R.R. implemented the idea, wrote the original code, and analyzed the data. A.M. helped in data analysis. P.B. and S.M. performed the 3′-RACE experiments and performed the K562 differentiation experiments, respectively, and analyzed the outcoming data. A.A. and D.C. performed the RNA isolation and cDNA conversion for the K562 differentiation study. T.H. performed the qRT-PCR for the K562 differentiation study. R.R. and I.S. wrote the manuscript with input from all authors. All authors approved the final version submitted.
Footnotes
[1] Supplementary material [Supplemental material is available for this article.]
[2] Article published online before print. Article, supplemental material, and publication date are at https://www.genome.org/cgi/doi/10.1101/gr.281044.125.
[3] Freely available online through the Genome Research Open Access option.
References
- ↵Arefeen A, Liu J, Xiao X, Jiang T. 2018. TAPAS: tool for alternative polyadenylation site analysis. Bioinformatics 34: 2521–2529. 10.1093/bioinformatics/bty110
- ↵Berkovits BD, Mayr C. 2015. Alternative 3′ UTRs act as scaffolds to regulate membrane protein localization. Nature 522: 363–367. 10.1038/nature14321
- ↵Bond ML, Davis ES, Quiroga IY, Dey A, Kiran M, Love MI, Won H, Phanstiel DH. 2023. Chromatin loop dynamics during cellular differentiation are associated with changes to both anchor and internal regulatory features. Genome Res 33: 1258–1268. 10.1101/gr.277397.122
- ↵Chen Y, Pal B, Visvader JE, Smyth GK. 2018. Differential methylation analysis of reduced representation bisulfite sequencing experiments using edgeR. F1000Res 6: 2055. 10.12688/f1000research.13196.2
- ↵Cheng LC, Zheng D, Baljinnyam E, Sun F, Ogami K, Yeung PL, Hoque M, Lu C-W, Manley JL, Tian B, 2020. Widespread transcript shortening through alternative polyadenylation in secretory cell differentiation. Nat Commun 11: 3182. 10.1038/s41467-020-16959-2
- ↵Cheng X, Jiang G, Zhou X, Wang J, Zhao Z, Zhang J, Ni T. 2024. The landscape and clinical relevance of intronic polyadenylation in human cancers. J Genet Genomics 51: 1030–1039. 10.1016/j.jgg.2024.04.014
- ↵Cowley M, Wood AJ, Böhm S, Schulz R, Oakey RJ. 2012. Epigenetic control of alternative mRNA processing at the imprinted Herc3/Nap1l5 locus. Nucleic Acids Res 40: 8917–8926. 10.1093/nar/gks654
- ↵Derti A, Garrett-Engele P, Macisaac KD, Stevens RC, Sriram S, Chen R, Rohl CA, Johnson JM, Babak T. 2012. A quantitative atlas of polyadenylation in five mammals. Genome Res 22: 1173–1183. 10.1101/gr.132563.111
- ↵Dobin A, Davis CA, Schlesinger F, Drenkow J, Zaleski C, Jha S, Batut P, Chaisson M, Gingeras TR. 2013. STAR: ultrafast universal RNA-seq aligner. Bioinformatics 29: 15–21. 10.1093/bioinformatics/bts635
- ↵Early P, Rogers J, Davis M, Calame K, Bond M, Wall R, Hood L. 1980. Two mRNAs can be produced from a single immunoglobulin mu gene by alternative RNA processing pathways. Cell 20: 313–319. 10.1016/0092-8674(80)90617-0
- ↵Elkon R, Ugalde AP, Agami R. 2013. Alternative cleavage and polyadenylation: extent, regulation and function. Nat Rev Genet 14: 496–506. 10.1038/nrg3482
- ↵Fink EE, Zhang Y, Santo B, Siddavatam A, Ou R, Nanavaty V, Lee BH, Ting AH. 2025. Heat shock induces alternative polyadenylation through dynamic DNA methylation and chromatin looping. Cell Stress Chaperones 30: 100084. 10.1016/j.cstres.2025.100084
- ↵Gabel AM, Belleville AE, Thomas JD, McKellar SA, Nicholas TR, Banjo T, Crosse EI, Bradley RK. 2024. Multiplexed screening reveals how cancer-specific alternative polyadenylation shapes tumor growth in vivo. Nat Commun 15: 959. 10.1038/s41467-024-44931-x
- ↵Griffiths-Jones S. 2004. The microRNA registry. Nucleic Acids Res 32: D109–D111. 10.1093/nar/gkh023
- ↵Griffiths-Jones S, Grocock RJ, van Dongen S, Bateman A, Enright AJ. 2006. miRBase: microRNA sequences, targets and gene nomenclature. Nucleic Acids Res 34: D140–D144. 10.1093/nar/gkj112
- ↵Griffiths-Jones S, Saini HK, van Dongen S, Enright AJ. 2008. miRBase: tools for microRNA genomics. Nucleic Acids Res 36: D154–D158. 10.1093/nar/gkm952
- ↵Gruber AJ, Schmidt R, Ghosh S, Martin G, Gruber AR, van Nimwegen E, Zavolan M. 2018. Discovery of physiological and cancer-related regulators of 3′ UTR processing with KAPAC. Genome Biol 19: 44. 10.1186/s13059-018-1415-3
- ↵Ha KCH, Blencowe BJ, Morris Q. 2018. QAPA: a new method for the systematic analysis of alternative polyadenylation from RNA-seq data. Genome Biol 19: 45. 10.1186/s13059-018-1414-4
- ↵Haynes K, Eckley IA, Fearnhead P. 2017. Computationally efficient changepoint detection for a range of penalties. J Comput Graph Stat 26: 134–143. 10.1080/10618600.2015.1116445
- ↵Herrmann CJ, Schmidt R, Kanitz A, Artimo P, Gruber AJ, Zavolan M. 2020. PolyASite 2.0: a consolidated atlas of polyadenylation sites from 3′ end sequencing. Nucleic Acids Res 48: D174–D179. 10.1093/nar/gkz918
- ↵Hunt MC, Siponen MI, Alexson SE. 2012. The emerging role of acyl-CoA thioesterases and acyltransferases in regulating peroxisomal lipid metabolism. Biochim Biophys Acta 1822: 1397–1410. 10.1016/j.bbadis.2012.03.009
- ↵Jia J, Fan H, Wan X, Fang Y, Li Z, Tang Y, Zhang Y, Huang J, Fang D. 2024. FUS reads histone H3K36me3 to regulate alternative polyadenylation. Nucleic Acids Res 52: 5549–5571. 10.1093/nar/gkae184
- ↵Killick R, Fearnhead P, Eckley IA. 2012. Optimal detection of changepoints with a linear computational cost. J Am Stat Assoc 107: 1590–1598. 10.1080/01621459.2012.737745
- ↵Krueger F, Andrews SR. 2011. Bismark: a flexible aligner and methylation caller for Bisulfite-Seq applications. Bioinformatics 27: 1571–1572. 10.1093/bioinformatics/btr167
- ↵Langmead B, Salzberg SL. 2012. Fast gapped-read alignment with Bowtie 2. Nat Methods 9: 357–359. 10.1038/nmeth.1923
- ↵Lee SH, Singh I, Tisdale S, Abdel-Wahab O, Leslie CS, Mayr C. 2018. Widespread intronic polyadenylation inactivates tumour suppressor genes in leukaemia. Nature 561: 127–131. 10.1038/s41586-018-0465-8
- ↵Li Y, Schaefke B, Zou X, Zhang M, Heyd F, Sun W, Zhang B, Li G, Liang W, He Y, 2020. Pan-tissue analysis of allelic alternative polyadenylation suggests widespread functional regulation. Mol Syst Biol 16: e9367. 10.15252/msb.20199367
- ↵Lianoglou S, Garg V, Yang JL, Leslie CS, Mayr C. 2013. Ubiquitously transcribed genes use alternative polyadenylation to achieve tissue-specific expression. Genes Dev 27: 2380–2396. 10.1101/gad.229328.113
- ↵Liu X, Chen H, Li Z, Yang X, Jin W, Wang Y, Zheng J, Li L, Xuan C, Yuan J, 2024. InPACT: a computational method for accurate characterization of intronic polyadenylation from RNA sequencing data. Nat Commun 15: 2583. 10.1038/s41467-024-46875-8
- ↵Love MI, Huber W, Anders S. 2014. Moderated estimation of fold change and dispersion for RNA-seq data with DESeq2. Genome Biol 15: 550. 10.1186/s13059-014-0550-8
- ↵Martin FJ, Amode MR, Aneja A, Austine-Orimoloye O, Azov AG, Barnes I, Becker A, Bennett R, Berry A, Bhai J, 2023. Ensembl 2023. Nucleic Acids Res 51: D933–D941. 10.1093/nar/gkac958
- ↵Mayr C. 2019. What are 3′ UTRs doing? Cold Spring Harb Perspect Biol 11: a034728. 10.1101/cshperspect.a034728
- ↵Mayr C, Bartel DP. 2009. Widespread shortening of 3′UTRs by alternative cleavage and polyadenylation activates oncogenes in cancer cells. Cell 138: 673–684. 10.1016/j.cell.2009.06.016
- ↵Middleton R, Gao D, Thomas A, Singh B, Au A, Wong JJ, Bomane A, Cosson B, Eyras E, Rasko JE, 2017. IRFinder: assessing the impact of intron retention on mammalian gene expression. Genome Biol 18: 51. 10.1186/s13059-017-1184-4
- ↵Monteuuis G, Wong JJL, Bailey CG, Schmitz U, Rasko JEJ. 2019. The changing paradigm of intron retention: regulation, ramifications and recipes. Nucleic Acids Res 47: 11497–11513. 10.1093/nar/gkz1068
- ↵Mortazavi A, Williams BA, McCue K, Schaeffer L, Wold B. 2008. Mapping and quantifying mammalian transcriptomes by RNA-Seq. Nat Methods 5: 621–628. 10.1038/nmeth.1226
- ↵Nanavaty V, Abrash EW, Hong C, Park S, Fink EE, Li Z, Sweet TJ, Bhasin JM, Singuri S, Lee BH, 2020. DNA methylation regulates alternative polyadenylation via CTCF and the cohesin complex. Mol Cell 78: 752–764.e6. 10.1016/j.molcel.2020.03.024
- ↵Neve J, Patel R, Wang Z, Louey A, Furger AM. 2017. Cleavage and polyadenylation: ending the message expands gene regulation. RNA Biol 14: 865–890. 10.1080/15476286.2017.1306171
- ↵Ni TK, Kuperwasser C. 2016. Premature polyadenylation of MAGI3 produces a dominantly-acting oncogene in human breast cancer. eLife 5: e14730. 10.7554/eLife.14730
- ↵O'Leary NA, Wright MW, Brister JR, Ciufo S, Haddad D, McVeigh R, Rajput B, Robbertse B, Smith-White B, Ako-Adjei D, 2016. Reference sequence (RefSeq) database at NCBI: current status, taxonomic expansion, and functional annotation. Nucleic Acids Res 44: D733–D745. 10.1093/nar/gkv1189
- ↵Plessner M, Thiele L, Hofhuis J, Thoms S. 2024. Tissue-specific roles of peroxisomes revealed by expression meta-analysis. Biol Direct 19: 14. 10.1186/s13062-024-00458-1
- ↵Proudfoot NJ. 2011. Ending the message: poly(A) signals then and now. Genes Dev 25: 1770–1782. 10.1101/gad.17268411
- ↵Quinlan AR, Hall IM. 2010. BEDTools: a flexible suite of utilities for comparing genomic features. Bioinformatics 26: 841–842. 10.1093/bioinformatics/btq033
- ↵Robinson MD, McCarthy DJ, Smyth GK. 2010. edgeR: a Bioconductor package for differential expression analysis of digital gene expression data. Bioinformatics 26: 139–140. 10.1093/bioinformatics/btp616
- ↵Samur MK, Minvielle S, Gulla A, Fulciniti M, Cleynen A, Aktas Samur A, Szalat R, Shammas M, Magrangeas F, Tai YT, 2018. Long intergenic non-coding RNAs have an independent impact on survival in multiple myeloma. Leukemia 32: 2626–2635. 10.1038/s41375-018-0116-y
- ↵Sandberg R, Neilson JR, Sarma A, Sharp PA, Burge CB. 2008. Proliferating cells express mRNAs with shortened 3′ untranslated regions and fewer microRNA target sites. Science 320: 1643–1647. 10.1126/science.1155390
- ↵Scotto-Lavino E, Du G, Frohman MA. 2006. 3′ end cDNA amplification using classic RACE. Nat Protoc 1: 2742–2745. 10.1038/nprot.2006.481
- ↵Shenker S, Miura P, Sanfilippo P, Lai EC. 2015. IsoSCM: improved and alternative 3′ UTR annotation using multiple change-point inference. RNA 21: 14–27. 10.1261/rna.046037.114
- ↵Singh I, Lee SH, Sperling AS, Samur MK, Tai YT, Fulciniti M, Munshi NC, Mayr C, Leslie CS. 2018. Widespread intronic polyadenylation diversifies immune cell transcriptomes. Nat Commun 9: 1716. 10.1038/s41467-018-04112-z
- ↵Smith LM. 2019. Epigenetic regulation of mRNA polyadenylation site selection. Plant Physiol 180: 7–9. 10.1104/pp.19.00374
- ↵Sun J, Kim J-Y, Jun S, Park M, de Jong E, Chang J-W, Cheng S, Fan D, Chen Y, Griffin TJ, 2024. Dichotomous intronic polyadenylation profiles reveal multifaceted gene functions in the pan-cancer transcriptome. Exp Mol Med 56: 2145–2161. 10.1038/s12276-024-01289-w
- ↵Takagaki Y, Manley JL. 1998. Levels of polyadenylation factor cstF-64 control IgM heavy chain mRNA accumulation and other events associated with B cell differentiation. Mol Cell 2: 761–771. 10.1016/S1097-2765(00)80291-9
- ↵Thomas PE, Wu X, Liu M, Gaffney B, Ji G, Li QQ, Hunt AG. 2012. Genome-wide control of polyadenylation site choice by CPSF30 in Arabidopsis. Plant Cell 24: 4376–4388. 10.1105/tpc.112.096107
- ↵Tian B, Hu J, Zhang H, Lutz CS. 2005. A large-scale analysis of mRNA polyadenylation of human and mouse genes. Nucleic Acids Res 33: 201–212. 10.1093/nar/gki158
- ↵Tian B, Pan Z, Lee JY. 2007. Widespread mRNA polyadenylation events in introns indicate dynamic interplay between polyadenylation and splicing. Genome Res 17: 156–165. 10.1101/gr.5532707
- ↵Wang ET, Sandberg R, Luo S, Khrebtukova I, Zhang L, Mayr C, Kingsmore SF, Schroth GP, Burge CB. 2008. Alternative isoform regulation in human tissue transcriptomes. Nature 456: 470–476. 10.1038/nature07509
- ↵Weber MJ. 2005. New human and mouse microRNA genes found by homology search. FEBS J 272: 59–73. 10.1111/j.1432-1033.2004.04389.x
- ↵Wood AJ, Schulz R, Woodfine K, Koltowska K, Beechey CV, Peters J, Bourc'his D, Oakey RJ. 2008. Regulation of alternative polyadenylation by genomic imprinting. Genes Dev 22: 1141–1146. 10.1101/gad.473408
- ↵Xia Z, Donehower LA, Cooper TA, Neilson JR, Wheeler DA, Wagner EJ, Li W. 2014. Dynamic analyses of alternative polyadenylation from RNA-seq reveal a 3′-UTR landscape across seven tumour types. Nat Commun 5: 5274. 10.1038/ncomms6274
- ↵Zhao Z, Xu Q, Wei R, Wang W, Ding D, Yang Y, Yao J, Zhang L, Hu YQ, Wei G, 2021. Cancer-associated dynamics and potential regulators of intronic polyadenylation revealed by IPAFinder using standard RNA-seq data. Genome Res 31: 2095–2106. 10.1101/gr.271627.120