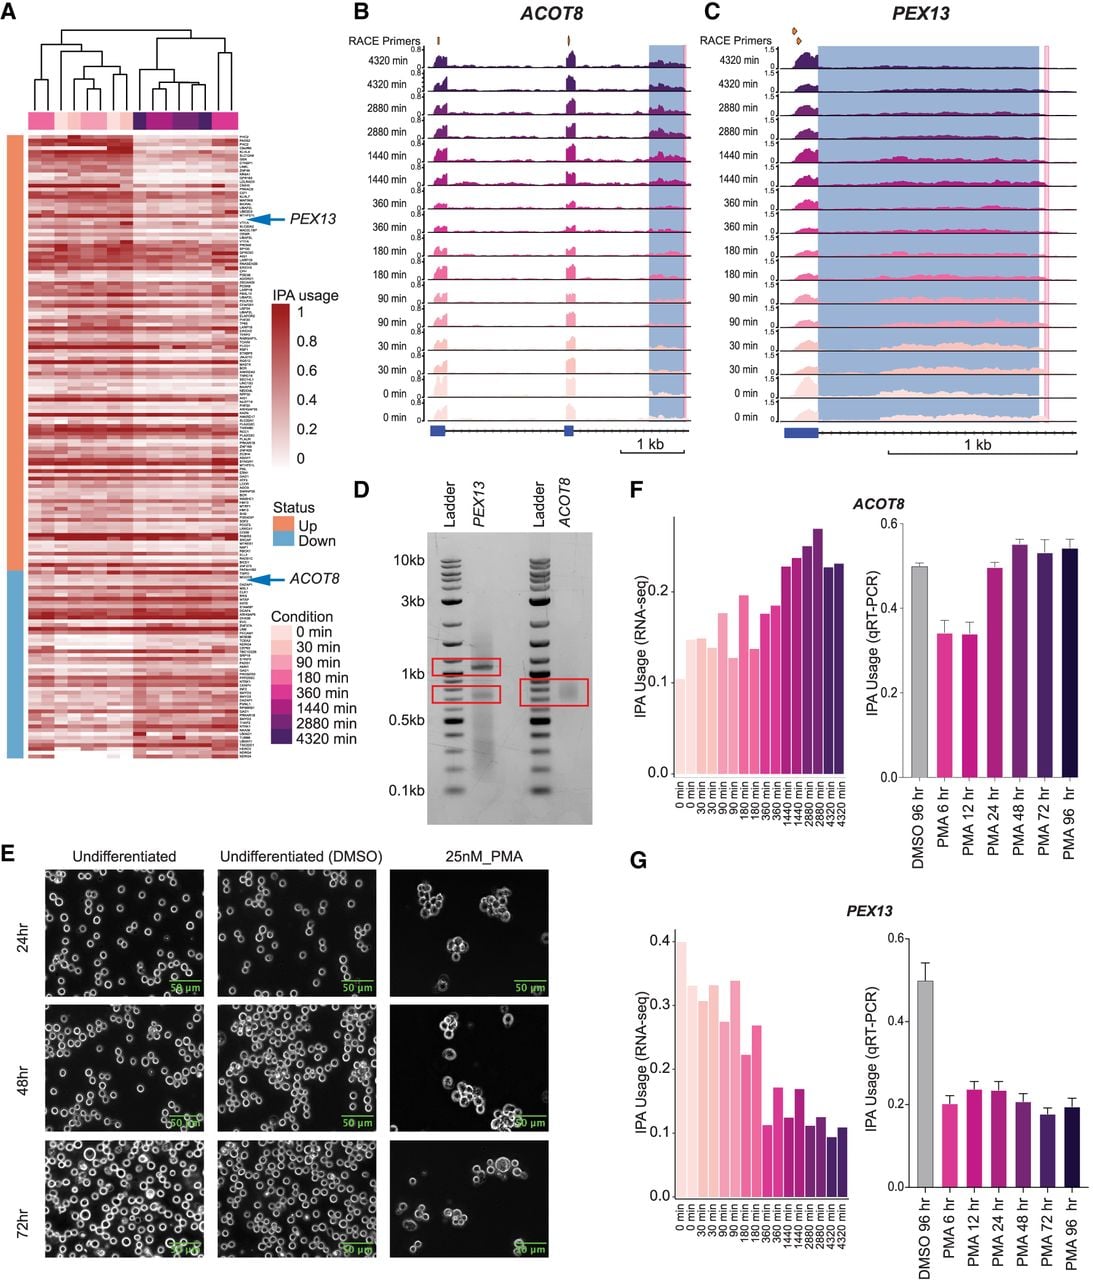
Temporal analysis of IPA during myeloid progenitor to megakaryocyte differentiation. (A) IPA sites with differential usage (≥10% usage difference) with respect to full-length mRNA in myeloid progenitor cells (K562) to megakaryocytic differentiation (n = 166). The sites were determined by the calculating the difference in IPA site usage of all the IPA events, using the two early and two end differentiation time points. Each row is a unique IPA isoform, and columns are samples captured at different time points of the differentiation process. The color scheme indicates regulation status, with higher usage shown in orange and lower usage in blue. IPA site usage is quantified on a zero-to-one scale relative to full-length isoform usage, with the color intensity reflecting the degree of IPA site usage. (B) RNA-seq read coverage (in TPM) over the ACOT8 locus across different time points of myeloid progenitor (K562) to megakaryocytic differentiation. The read coverage was determined using uniquely mapping reads. The top track indicates the position of the two nested primers used for 3′-RACE validation. The blue-highlighted region shows the TE determined by IPAseek, and the pink-highlighted region shows the cleavage site detected by 3′-RACE (±20 nt). The gene locus presented here is located on the antisense strand of DNA. (C) As in B but showing the PEX13 locus. The gene locus presented here is located on the sense strand of DNA. (D) Validation of the 3′-end detected by IPAseek in B and C using 3′-RACE. Total cell RNA extracted from K562 cells was used to perform 3′-RACE. (E) Morphological assessment of myeloid progenitor cells. Phase-contrast microscopy (20× magnification; BioTek Lionheart FX automated microscope) captured progressive morphological changes during PMA-induced megakaryocytic differentiation of myeloid progenitor cells. Columns represent treatment groups: untreated control (left), 0.0025% DMSO vehicle (middle), and 25 nM PMA-treated cells (right). Rows correspond to time points: 24 h (top), 48 h (middle), and 72 h (bottom). PMA-treated cells exhibited hallmark differentiation features including increased cell size compared with the controls. Scale bars, 10 µm. (F) IPA isoform usage in ACOT8 during myeloid progenitor differentiation to megakaryocytes. (Left) IPA site usage measured across eight time points (0 min to 4320 min) following PMA treatment, quantified using IPAseek analysis of bulk RNA-seq data from GSE213909. (Right) IPA isoform usage, identified by 3′-RACE, measured at six time points (6 h to 96 h) post-PMA treatment or vehicle control (DMSO 96 h), validated by qRT-PCR. Together, these plots demonstrate an increase in ACOT8 IPA isoform usage throughout differentiation. (G) Same as in F but for PEX13. It demonstrates a decrease in PEX13 IPA isoform usage throughout differentiation.