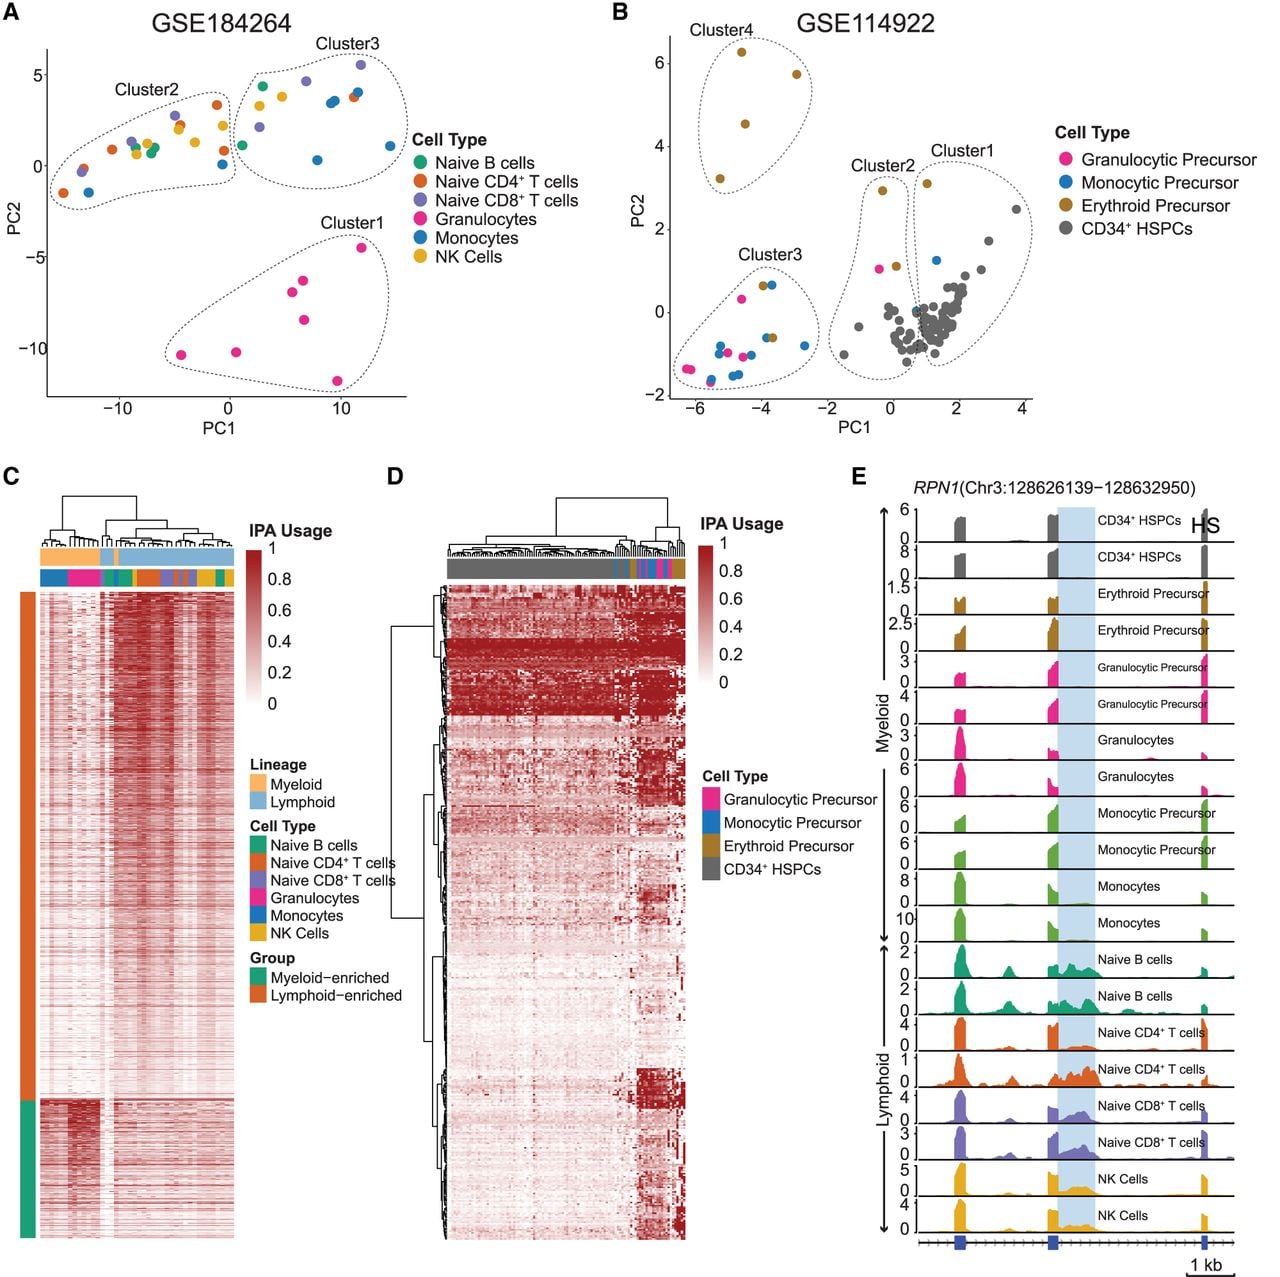
Immune cell IPA atlas and functional enrichment analysis. (A) Principal component analysis (PCA) of differentiated immune cell types from the NCBI Gene Expression Ominbus (GEO; https://www.ncbi.nlm.nih.gov/geo/) data set GSE184264 based on IPA site usage. Three clusters identified through k-means clustering are indicated by dotted enclosures. The plot reveals clear segregation between the myeloid (clusters 1 and 2) and lymphoid (clusters 2 and 3) lineages, reflecting distinct lineage-specific IPA patterns. The analysis includes 4994 IPA events across 39 samples. (B) PCA of undifferentiated immune cell types from GEO data set GSE114922 based on IPA site usage. Four clusters identified through k-means clustering are indicated by dotted enclosures. The analysis reveals separation between the individual cell types, emphasizing their unique IPA signatures (no. of IPA = 592, no. of samples = 108). (C) Heatmap of IPA site usage across differentiated immune cell types, showcasing myeloid- and lymphoid-specific enrichment patterns. Each row represents a unique IPA isoform (n = 1863), and columns correspond to individual immune cell samples (n = 42). Rows are color-coded to indicate enrichment status: myeloid-enriched IPAs in seafoam green and lymphoid-enriched IPAs in dark orange. IPA site usage is quantified on a zero-to-one scale relative to full-length isoform usage, with the color intensity reflecting the degree of IPA site usage. Statistical significance was determined using the Wilcoxon rank-sum test with Benjamini–Hochberg FDR correction (P-adj < 0.05). (D) Heatmap of IPA site usage across undifferentiated immune cell types, focusing on the cell types shown in B. Each row represents a unique IPA isoform (n = 431), and columns denote individual immune cell samples (n = 108). Statistical significance for enrichment in specific cell types was assessed using the Kruskal–Wallis test with Benjamini–Hochberg FDR correction (P-adj < 0.05). IPA site usage is displayed on a zero-to-one scale, with color intensity indicating the degree of IPA site usage. (E) Differential IPA site usage between the myeloid and lymphoid lineages, with RPN1 shown as an example of a lineage-specific IPA event. Bulk RNA-seq read coverage (in TPM) over the RPN1 locus is visualized across different immune cell types. Read coverage was calculated using uniquely mapping reads.