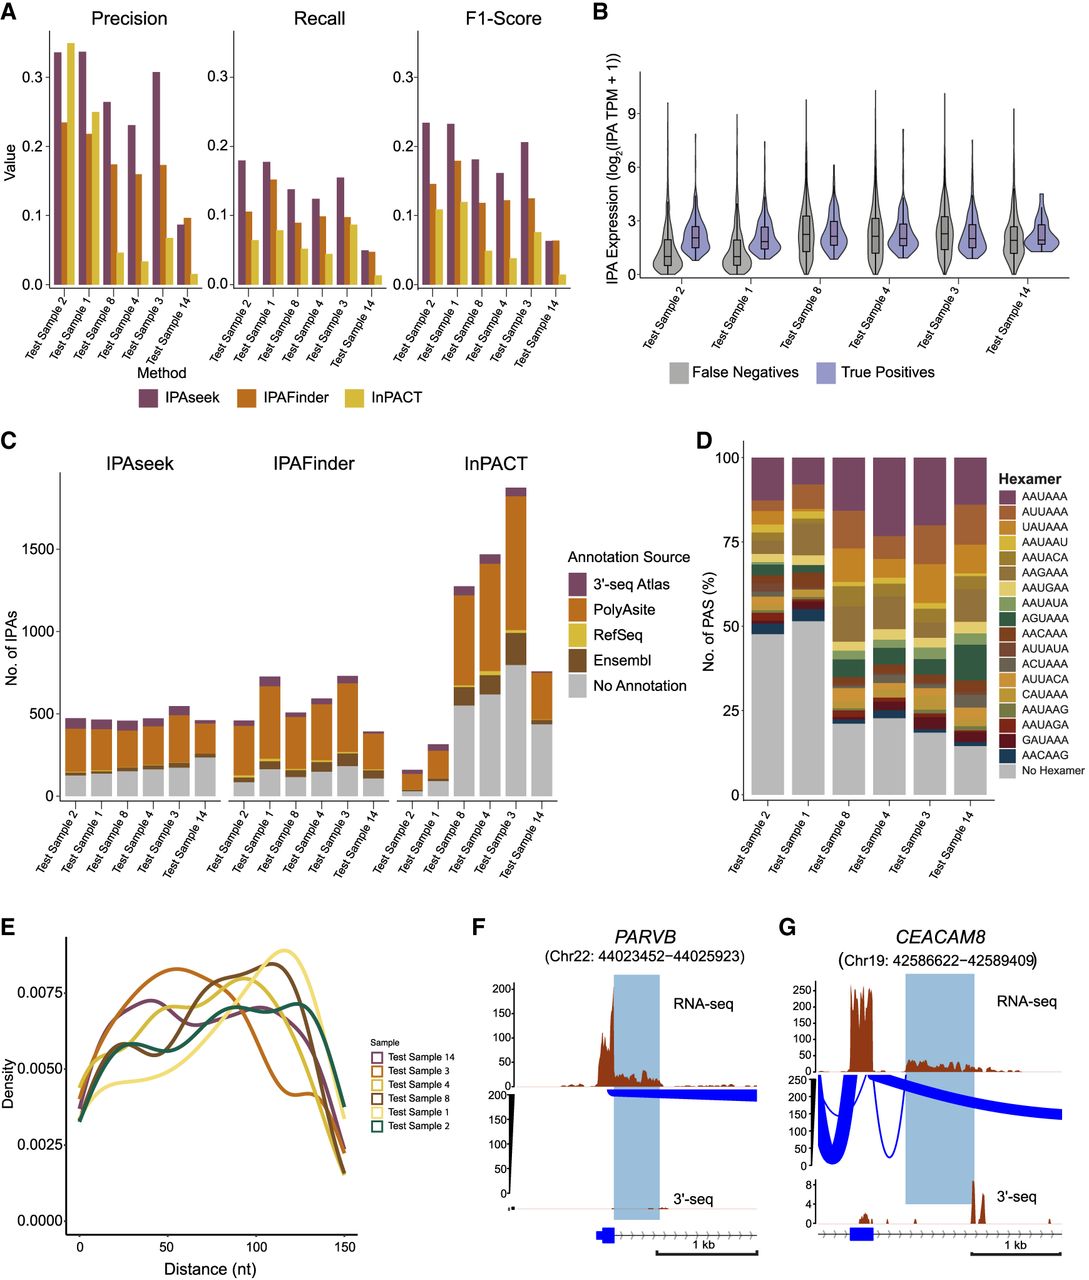
Comparative analysis of IPAseek-detected IPA events with existing methods. (A) A comprehensive evaluation of the performance metrics for IPAseek, InPACT, and IPAFinder in detecting IPA events across the multiple six test samples (ordered by sample quality). The analysis employs three key metrics: precision, recall, and F1-score. The IPA 3′-ends detected by 3′-seq (expressed at five or higher TPM) were utilized as ground truth. Precision measures the proportion of correctly identified IPA events among all detected events, and recall quantifies the fraction of true IPA events successfully identified by each method. The F1-score, the harmonic mean of precision and recall, provides a balanced measure of overall performance. (B) Comparison of bulk RNA-seq expression levels of TEs, represented as log2 (RPKM+1), between IPA events detected by both IPAseek and 3′-seq (true positives) and those identified exclusively by 3′-seq (false negatives). Statistical significance of the difference in TE expression between true positives and false negatives was assessed using the Kolmogorov–Smirnov test (P-value < 0.001 of test samples 1, 2, 4, and 8 and P-value < 0.01 of test sample 14). (C) This figure presents a quantitative comparison of previously uncharacterized IPA events (false positives) identified by IPAseek, InPACT, and IPAFinder across the six test samples (ordered by sample quality). Previously uncharacterized IPAs are defined as those detected using RNA-seq coverage profiles that either are not present in the 3′-seq atlas or have low expression (five or lesser TPM) in the 3′-seq atlas. The color-coded segments within each bar represent the distribution of annotation sources for these uncharacterized IPA sites, including the 3′-seq atlas (expressed five or lesser TPM), PolyASite database, RefSeq, and Ensembl annotations, prioritized in that order. The gray region indicates IPA events detected by each method that lack any prior annotation. (D) Proportion of uncharacterized IPA events without annotations detected in six test samples (ordered by sample quality; gray events in C for IPAseek) with a canonical/noncanonical PAS within ±150 nt of the detected IPA site. (E) Density plot of the distance of the nearest PAS from the IPA cleavage site detected by IPAseek. (F) Same as Figure 1A, showing an uncharacterized composite IPA isoform without annotation detected by IPAseek but not by InPACT and IPAFinder. The gene locus presented here is located on the sense strand of DNA. (G) Same as Figure 1A, showing an uncharacterized skipped IPA isoform without annotation detected by IPAseek but not by InPACT and IPAFinder. The gene locus presented here is located on the antisense strand of DNA.