
Abstract
Cytosine methylation, a crucial epigenetic modification, plays a vital role in genomic regulation. Leveraging the advancements in long-read sequencing, we investigate the methylation patterns of polymorphic transposable element (TE) insertions of human lymphoblastoid cell lines (LCLs). We validate the high concordance between long-read methylation calls and the conventional whole-genome bisulfite sequencing (WGBS) method. We then aim to establish general rules of TE methylation with our data by addressing three key questions: (1) what is the methylation profile of each insertion; (2) do newly inserted TEs adopt the methylation pattern of their genomic context; and (3) do new TE insertions affect the methylation of their flanking regions. Although most non-TE insertions exhibit DNA methylation patterns consistent with their genomic context, TE insertions are generally highly methylated, exhibiting distinct, class-specific patterns with some variation within TE bodies. A small percentage of Alu insertions are hypomethylated, particularly those inserted within hypomethylated CpG islands. We also reveal that majority of TEs exhibited minimal impact on nearby regions, although numerous exceptions exist in which the methylation status of TEs spread into nearby regions. In conclusion, although TE insertions primarily exhibit methylation patterns restricted within their boundaries, some TEs are able to affect the methylation level of their genomic neighborhoods. At last, our findings are limited to human LCLs, and more comprehensive analysis would be needed to test the rules we found here on a broader spectrum of cell types and developmental stages.
Cytosine methylation at CpG sites is prevalent in vertebrate genomes. The majority of CpG sites in the human genome are methylated in most somatic tissues (Bird 1986; The ENCODE Project Consortium 2012; Roadmap Epigenomics Consortium et al. 2015). It is generally believed that the CpG methylation is a repressive mark commonly associated with heterochromatin and transposable elements (TEs) silencing but is absent from the promoter of active genes (Moore et al. 2013). In addition, methylation patterns change dynamically during development and disease progression (Jones 2012; Smith et al. 2025). During evolution, methylation-mediated deamination converts methylated cytosine to thymine, causing the general depletion of CpG sites in most vertebrate genomes (Bird 2002). However, there are CpG islands (CGIs) in the genome that are relatively enriched with GC content and CG motif (generally defined by sequences >200 bp with ≥50% GC content and the observed/expected CpG ratio ≥0.6) (Fazzari and Greally 2004). It is believed that they represent conserved unmethylated regions in germ cells during development (Smallwood et al. 2011; Jones 2012), and many were found in the promoters of conserved genes (Sved and Bird 1990; Han et al. 2008).
Given the importance of CpG methylation in genome regulation and evolution, considerable efforts have been devoted to characterizing cytosine methylation. Microarray-based methylation chip, MeDIP-seq, MRE-seq, and RRBS-seq are all popular options to interrogate methylation states of different CpGs across the genome (Weber et al. 2005; Meissner et al. 2008; Hodges et al. 2009; Maunakea et al. 2010; Stevens et al. 2013; Zhang et al. 2013; Li et al. 2015). Because of its universal coverage across the genome, whole-genome bisulfite sequencing (WGBS) has been considered the gold standard in cytosine methylation calling since its debut in the shotgun-based, high-throughput sequencing (represented by Illumina) era (Cokus et al. 2008; Lister et al. 2009; Laurent et al. 2010).
Despite its many advantages, WGBS has several limitations. For example, the bisulfite treatment that chemically distinguishes methylated from unmethylated cytosine damages the DNA molecules and complicates the library preparation before sequencing. In addition, WGBS typically relies on identifying mismatches between bisulfite-treated reads and the reference genome to call methylation, making methylation calling of cytosines of nonreference regions nontrivial. There are new methods developed recently to improve WGBS but ultimately, they are limited by the short-read-based sequencing (Vaisvila et al. 2021; Nunn et al. 2022).
The long-read sequencing technologies, pioneered by Pacific Biosciences (PacBio) and Oxford Nanopore Technologies (ONT), have greatly matured in recent years (van Dijk et al. 2018; Sigurpalsdottir et al. 2024). This improvement results in much longer reads and the ability to distinguish modified bases, included methylated cytosine, during basecalling (Flusberg et al. 2010; Schatz 2017; Stergachis et al. 2020; Xu and Seki 2020). Thus, methylation calling and sequencing can be done simultaneously, making cytosine methylation calling much simpler and more accessible without resorting to specific chemical treatment to target cytosine methylation. Despite the promising outlook, the signal changes caused by methylation are usually small and variable, and it is not until the recent development of deep learning models that CpG methylation calling on SMRT and Nanopore data has seen substantial improvement in accuracy (Simpson et al. 2017; Liu et al. 2021b; Tse et al. 2021; Ni et al. 2023).
More than just providing better mapping and coverage to highly repetitive regions, long-read sequencing enabled us to identify nonreference insertions along with their methylation status at the individual insertion level including generally methylated TEs. However, there are many outstanding questions regarding the epigenetic response to newly inserted TEs. Which of them are methylated, and which of them are not? Is their methylation being influenced by the genomic regions into which they insert? Can they affect the methylation status of nearby genomic regions, and if they can, how far away would their influence continue? The advance in long-read sequencing makes it much easier to directly address these questions at scale. Recently, they were used to characterize the methylation profile of repetitive elements with high resolution (Ewing et al. 2020; Gerdes et al. 2023; Bodea et al. 2024; Groza et al. 2025).
It has been reported in mice that a newly inserted hypermethylated TE can spread methylation from the insertion site to the flanking regions until blocked by other regulators (Turker 1999, 2002), resembling the spreading of heterochromatin (Sentmanat and Elgin 2012). The spreading of TE methylation can further influence the host genome during evolution by altering mutation pattern (Zhou et al. 2020). Not only hypermethylation can spread out of TEs, tissue-specific hypomethylated CGIs introduced by new L1 insertions can also create so-called “sloping shores” in otherwise hypermethylated regions (Grandi et al. 2015). There were also studies reporting the methylation of new TE insertions has a limited effect on nearby gene expression patterns in plants (Choi and Purugganan 2018; Wyler et al. 2020). Recently, Lanciano et al. (2024) investigated the local impact of L1 insertion using bsATLAS-seq and ONT reads in multiple cell lines and found regions 300 bp upstream of L1 insertions can be influenced by the methylation status of L1.
Taking advantage of the high coverage of the Human Pangenome Reference Consortium (HPRC) long-read sequencing data and latest methylation calling methods, we wanted to characterize DNA methylation profiles of polymorphic TE insertions and investigate how they may affect local methylation.
Results
Both PacBio HiFi and Nanopore ONT reads provide accurate DNA methylation estimation
The HPRC published the first human pangenome reference graph representing 47 genetically diverse individuals (Liao et al. 2023). Out of 47, the DNA methylation status of 32 were determined using PacBio HiFi reads (Methods). In addition to the rich genetic information and various annotations, the HPRC resources also enabled direct methylation analysis using long-read sequencing data. Taking advantage of these resources, we performed additional CpG methylation calling using ONT reads (R9.4.1) from five individuals who were part of the first draft of the Human Pangenome Reference (HG00741, HG00621, HG01952, HG01978, and HG03516) and the WGBS of these same five individuals (Methods). After calling CpG methylation, we aligned all reads to the human reference genome GRCh38 (Fig. 1A).
Comparing CpG methylation calling accuracy between PacBio, ONT, and WGBS. (A) Study design of methylation calling benchmarking. We performed CpG methylation calling for five HPRC samples (HG00621, HG00741, HG01952, HG01978, and HG03516), using PacBio, ONT, and WGBS. We mapped all reads to the human reference genome GRCh38 to compare their differences. (B) Whole-genome methylation percentage correlation between WGBS, HiFi, and ONT methylation of HG00741. The whole-genome methylation percentage distribution is represented as a density plot. The correlation heatmap and metrics (mean average error, 20% concordance, and Pearson's correlation) are plotted on the bottom left and top right, respectively. (C) Methylation percentage distribution of the GM12878 15 ChromHMM states across all five samples. The 15 ChromHMM states are listed on the x-axis, and methylation calling results from different methods are colored differently. (D) WashU Epigenome Browser screenshot of the two WGBS replicates, HiFi, and ONT methylation of HG00741 on the 10 kb window around the TP53 gene promoter. All methylC tracks y-axis percentage was from 0% to 100%. (E) PCA plot of the top two principal components of the whole-genome methylation from the five HPRC samples. For each sample, we performed two replicates of WGBS in addition to HiFi and ONT methylation calling. We used different shapes to represent different methods (circle, triangle, and cross for ONT, HiFi, and WGBS, respectively) and different colors to represent different samples (red, yellow, green, blue, and purple for HG00621, HG00741, HG01952, HG01978, and HG03516, respectively). (F) Number of falsely discovered differentially methylated regions (DMRs) using different threshold cutoffs. Four different thresholds (20% average methylation difference with at least five CpG sites, 20% average methylation difference with at least 10 CpG sites, 30% average methylation difference with at least five CpG sites, and 30% average methylation difference with at least 10 CpG sites) are represented on the x-axis. The number of DMRs are represented on the y-axis. The number of DMRs between different methods under different conditions are plotted using different colors.
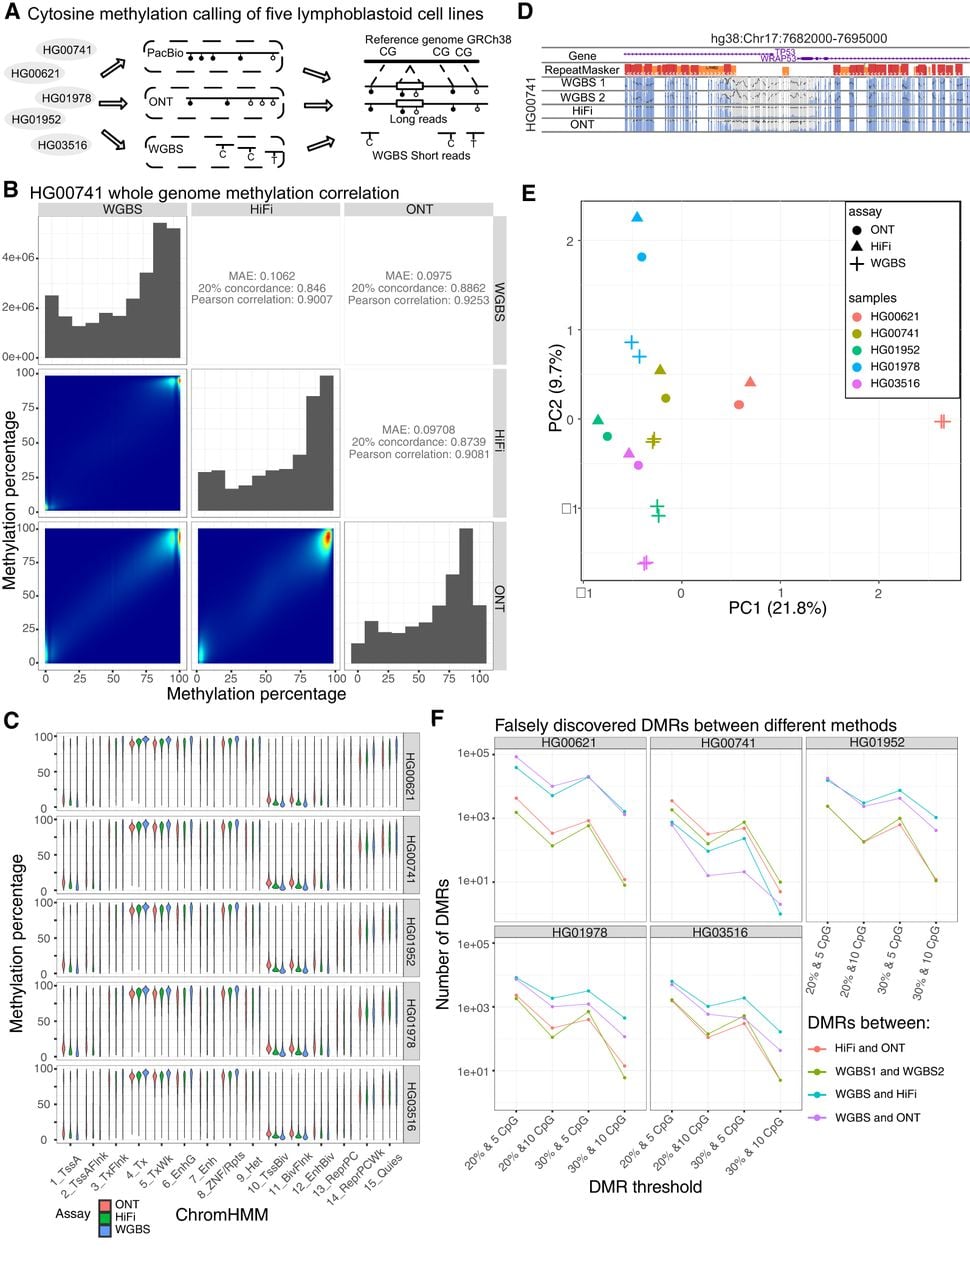
We first compared DNA methylation calls between HiFi, ONT, and WGBS for all CpG sites in the reference genome GRCh38. For HiFi reads, we adopted the deep learning–based mathematical model (PB-model) developed and suggested by PacBio to estimate methylation percentage of individual CpG sites (https://github.com/PacificBiosciences/pb-CpG-tools). We calculated mean average error (MAE), 20% concordance, and Pearson's correlation between WGBS, HiFi, and ONT for each sample in pairwise comparisons (for HG00741 comparison, see Fig. 1B; for the other four, see Supplemental Fig. S1A–D). We found both HiFi and ONT methylation calls highly correlated with their matching WGBS results (MAE: 0.1062 and 0.0975; 20% concordance: 0.846 and 0.886; Pearson's correlation: 0.901 and 0.925 for HiFi and ONT, respectively, for HG00741) in all five samples (Fig. 1B; Supplemental Fig. S1A–D). We examined the distribution of methylation level across different genomic contexts (defined by the GM12878 ChromHMM states) and found strong concordance among WGBS, HiFi, and ONT across all five samples (Fig. 1C; Ernst and Kellis 2012). We then used the WashU Epigenome Browser to illustrate the comparisons between WGBS, HiFi, and ONT (Fig. 1D).
To gain a global view of the difference and similarity across methods, we performed principal component analysis (PCA) and plotted the first two principal components in a 2D plot for visualization (Fig. 1E). In all five samples, the two matching WGBS replicates consistently clustered together; HiFi and ONT methylation results in the same samples also clustered together. The PCA distance between WGBS and the long-read methylation results seemed to be larger than the distances between HiFi and ONT.
To better understand the scale of differences between the different methods, we defined both differentially methylated loci (DMLs) and differentially methylated regions (DMRs) between HiFi, ONT, and WGBS, as well as between two WGBS replicates of the same sample (Wu et al. 2015). Because the DMRs here were defined using the same samples, they represented the false-positive discoveries and allowed us to estimate an empirical false-discovery rate. Using different thresholds, we found that the numbers of falsely discovered DMRs between HiFi and ONT were comparable with the numbers derived from the two WGBS replicates (Fig. 1F). Thus, the methylation calling difference between HiFi and ONT was quite small, generally comparable with the differences we observed between the two WGBS replicates.
To further understand the methylation differences between long-read and short-read methods, we examined DMLs and DMRs called between the two methods. We found that the DMLs between long and short reads exhibiting a >50% methylation difference were predominantly contributed by CpG sites with abnormally high short-read coverage (>50×) (Supplemental Fig. S1E), suggesting short-read mapping in these regions was more challenging than in others. In contrast, long-read sequencing coverage or GC content did not correlate with falsely discovered DNA methylation differences (Supplemental Fig. S1F,G). We also found that low complexity and simple repeats contributed to a higher fraction of DMRs with a methylation difference >40% (Supplemental Fig. S1H). Because these regions also suffer more from imprecise mapping of short reads, we reasoned that the small discrepancy between long-read- and short-read-based methods in assessing DNA methylation was systematic and likely a result of reference mapping bias (Pollard et al. 2018). A systematic benchmarking analysis with a focus on alignment bias will be required in the future to fully understand this phenomenon.
The methylation patterns of TE insertions
Because the long-read sequencing methylation calling was conducted on raw reads without aligning to the reference genome, it enabled methylation calling of nonreference regions previously inaccessible with Illumina sequencing–based methods (at least not trivially). Thus, we investigated the methylation status of polymorphic TE insertions and their correlation with the methylation levels of their flanking regions. Here we took advantage of the recent release of the draft Human Pangenome Reference made available by the HPRC, which included HiFi reads with methylation calling from 32 HPRC Year1 samples as well as their genetic variations (Methods) (Liao et al. 2023). We further annotated full-length insertions combining the TE insertion annotation pipeline MELT-LRA, PALMER2, and xTEA (Methods) (Gardner et al. 2017; Chu et al. 2021; Zhou et al. 2024). We classified TE insertions into five categories: Alu, L1, SVA, LTR5, and HERVK. In total, we identified 6752 Alu, 410 L1, 334 SVA, 16 solo LTR5, and nine HERVK insertions from the 32 HPRC samples (Supplemental Table S1). For convenience, we termed these TE insertions nonreference TEs.
Using custom pipelines (Methods), we extracted nonreference TEs and the HiFi reads derived from these regions (Fig. 2A). We first assessed if we had sufficient long-read coverage on nonreference TEs. We calculated the relative CpG site coverage of each TE insertion compared with the genome-wide average coverage based on the HiFi data and observed the two expected peaks for each TE class, representing coverages of heterozygous and homozygous insertions (Supplemental Fig. S2A). The average genome-wide coverage was 45.9×; thus, we believe that the coverage on TE insertions was sufficient for the purpose of our analysis. We also extracted HiFi methylation of reference TEs for comparison (Fig. 2A).
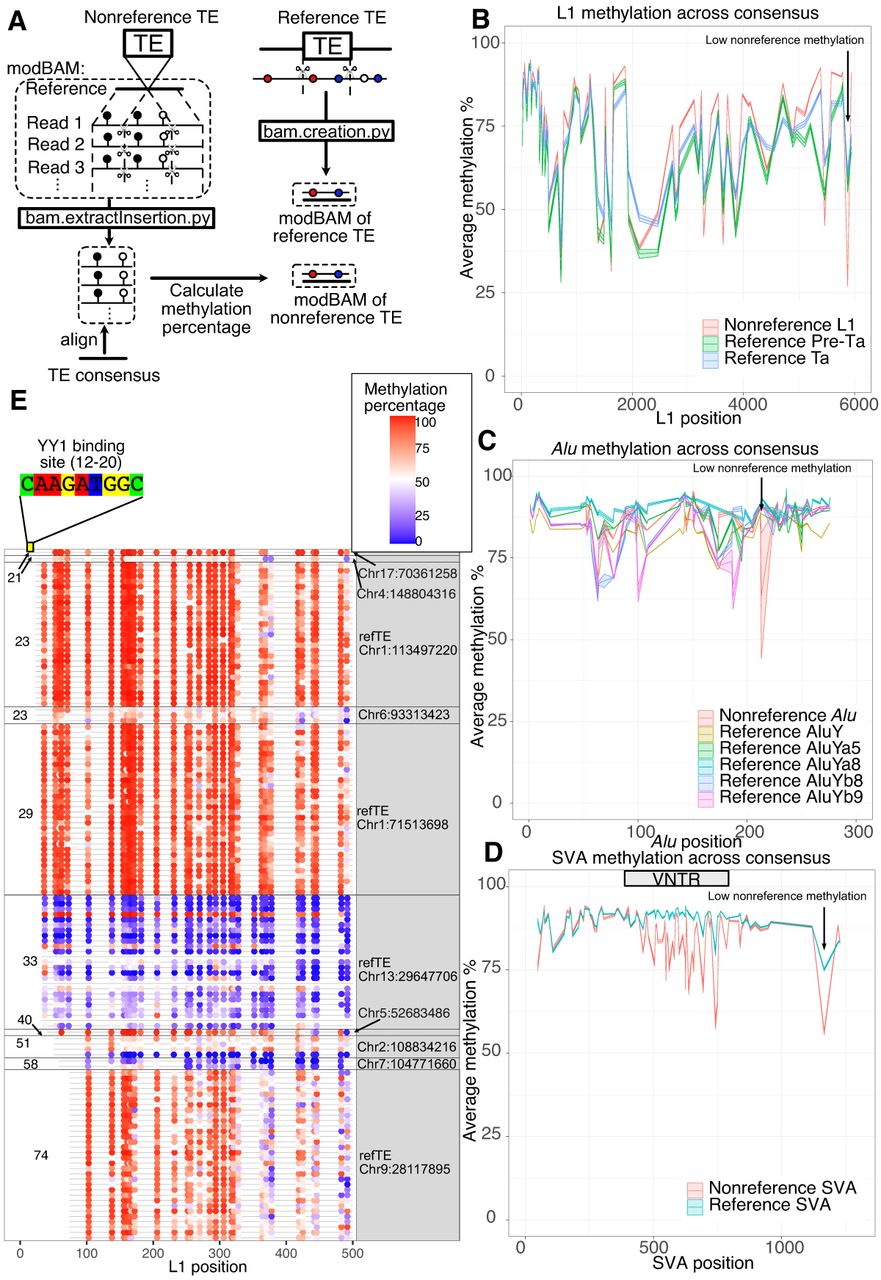
The methylation profile of different transposable elements (TEs) in the human genome. (A) Schematic representation of our pipeline to extract reference and nonreference insertions along with their methylation annotation. We developed a script (bam.extractInsertion.py) to extract truncated DNA sequences from reads while retaining positional methylation tags (subseq modBAM file). We then aligned this modBAM to the corresponding TE consensus and calculated the methylation profile of the TE insertion. We also extracted sequences from the reference genome and the methylation percentage from the bedMethyl file to create another modBAM file of reference TEs and their methylation (bam.creation.py). The methylation would be anchored to the TE consensus after alignment. (B) Methylation profile of L1 insertions. The x-axis represents positions on the L1Hs consensus, and the y-axis represents the methylation percentage with 95% standard error of the mean illustrated as shaded areas. Reference L1pre-Ta, reference L1Ta, and nonreference L1 insertions are labeled with different colors. Only full-length elements (truncation <50 bp on both ends) are included for profiling. (C) Methylation profile of Alu insertions with 95% standard error of mean. The x-axis represents positions on the AluY consensus, and the y-axis represents the methylation percentage. AluY, AluYa5, AluYa8, AluYb8, and AluYb9 on the reference and nonreference Alu insertions are labeled with different colors. (D) Methylation profile of SVA insertions with 95% standard error of mean. The x-axis represents positions on the SVA_F consensus, and the y-axis represents the methylation percentage. Reference SVA and nonreference SVA insertions are labeled with different colors. The VNTR of SVA consensus are labeled on the graph with a gray box. (E) The first 500 bp methylation of L1 insertions whose first 20–50 bp was truncated. The start position is labeled on the left, and the insertion coordinates on GRCh38 are labeled on the right. The “refTE” indicates it was an L1 insertion on the GRCh38 reference. Each row represents one of the 32 samples. The methylation percentage of each CpG site is illustrated by the blue–red (low to high) color scale.
For the five HPRC individuals with WGBS, HiFi, and ONT methylation results, we phased both HiFi and ONT reads to maternal and paternal assemblies and mapped them onto maternal or paternal haplotypes, respectively (Methods) (Patterson et al. 2015; Holt et al. 2024). Using the reference-assembly alignment, we created comparative epigenome browser datahubs to interactively examine the methylation of nonreference insertions (Methods).
In addition to characterizing nonreference TE insertions, to provide a contrast, we also analyzed the methylation of related TE subfamilies within GRCh38 reference genome (termed reference TE insertions). Polymorphic TE insertions include all nonreference and some reference TE insertions, and we plotted both of them in the Figure 2. We extracted 52,802 AluY, 2746 AluYa5, 36 AluYa8, 2111 AluYb8, and 301 AluYb9 from GRCh38 using RepeatMasker annotation. Similarly, we extracted 124 SVA_E, 331 SVA_F, and 481 LTR5 as reference TEs. We also downloaded 146 active L1s on GRCh38 from L1 Base 2 (Penzkofer et al. 2017). Active L1s were further classified into L1Ta and L1Pre-Ta using the defining variant at position 5932 (A as L1Ta and G as L1pre-Ta) based on L1base 2 (Boissinot et al. 2000). Intact AluY, L1HS, and SVA each have a region that contains enough CpG sites to be considered a CGI; thus, we have abundant data to characterize the methylation percentage fluctuation of each TE. We first compared DNA methylation profiles of full-length nonreference TE insertions with reference TE insertions. Nonreference TE insertions represent the youngest TE insertions in the human population, whereas reference TEs from the same subfamilies represent slightly older but still human-specific insertions given that nonreference TE insertions are generally of low allele frequency and that reference TEs are mostly of high allele frequency or are fixed in the human population (Logsdon et al. 2025). By anchoring methylation to a consensus-based alignment, we significantly reduced the noise in methylation signals compared with previous studies (Ewing et al. 2020; Gerdes et al. 2023). This allowed us to observe sharp methylation fluctuations between adjacent CpG sites within TEs (Fig. 2B–D). Our findings suggested that certain CpG sites, such as position 5875 in L1HS, were consistently lowly methylated. Overall, the DNA methylation profiles of reference and nonreference TE insertions showed high methylation levels and were similar in all four classes (for Alu, L1, and SVA profiles, see Fig. 2B–D; for the LTR5 profile, see Supplemental Fig. S2B). However, a single CpG site in each of Alu, L1, and SVA (at position 213, 5875, and 1166, respectively) exhibited statistically significant differences between nonreference insertions and reference copies. Also profoundly, the internal CG-rich, variable number of tandem repeats (VNTR) region of SVA was methylated lower in the nonreference insertions compared with their counterparts in the reference copies (Fig. 2D). The overall methylation plots for all but Alu insertions (which were too numerous to display individually) were available in Supplemental Figure S2, C through E.
To our knowledge, the relatively low methylation of VNTR within the SVA elements has never been reported before. Ewing et al. (2020) found that the VNTRs are methylated higher than their flanking regions in SVA, and we confirmed their observation within reference SVAs (Supplemental Fig. S2D). However, the methylation of VNTR of nonreference SVAs in our LCL samples was noticeably lower compared with both their flanking regions and their counterparts in the reference genome (Fig. 2D). Aligning full-length SVAs, often >2 kb long, to the 1.3 kb consensus may create some alignment issue, especially in the VNTR region. However, we do not believe this could explain our observation: The long-read methylation calling was done during basecalling process, independent of alignment, and the presence of many lowly methylated CpGs was visible across many nonreference SVAs (Supplemental Fig. S2F). We also found no correlation between length and methylation level of VNTR regions (Supplemental Fig. S2G).
The transcription factor YY1 is an important regulator of L1 activity in mammals (Saha et al. 2024). It was reported that L1 insertions missing the YY1 binding site, located at positions from 12 to 20 in the L1HS, could escape 5′ methylation in a tissue-specific manner (Sanchez-Luque et al. 2019). It was also proposed that YY1 binding affects the methylation of L1 in a cell type–specific manner (Lanciano et al. 2024). To investigate whether the YY1 binding site could affect polymorphic L1 methylation in LCL cells, we examined the 5′-end methylation of 10 L1 insertions whose first 20–100 bp were truncated (Fig. 2E).
The YY1 motif is located at position 12–20 in L1 consensus, and none of the 10 L1s here contained the YY1 binding site. Despite that, we found five loci, missing 20 bp to 28 bp from the 5′ end, were hypermethylated at the L1 promoter. In contrast, three out of the five loci with >32 bp truncated at the 5′ end were hypomethylated. Two loci, missing 39 and 73 bp, respectively, remained hypermethylated. Our data thus suggest that missing YY1 binding site is not sufficient for the demethylation of L1 promoter, at least not in LCL. In addition we found individual DNA methylation differences of the same L1 insertions. The reference L1 insertion with the first 31 bp at the 5′ end truncated at Chr 13: 29,641,706–29,647,706, denoted as Chr13delta31 by Sanchez-Luque et al. (2019), displayed variation among our 32 samples: Its promoter was hypomethylated in most of the samples but hypermethylated in HG02717 (Supplemental Fig. S2H). Because of the redundant nature of TE insertions, we could not apply other functional genomic analysis, including Hi-C, to explain the methylation differences in these regions.
Low methylation correlation between TE insertions and their flanking regions
We next investigated the relationship between DNA methylation of the insertions and their flanking regions. We compared the average methylation levels of nonreference insertions, categorized based on their TE annotation, with the methylation levels of their 300 bp flanking regions on both the 5′ end and 3′ end (Fig. 3A). We defined all insertions not annotated as TEs as non-TE insertions. TE insertions, particularly Alu and SVA insertions, exhibited high methylation levels regardless of the methylation levels of their flanking regions (Fig. 3B). On average, we observed weak correlations between TEs and their flanking regions (linear regression slope < 0.2, R2∼ 0.1). We did not calculate the correlation of HERVK insertions because of the insufficient number of nonreference HERVK insertions. This pattern was in sharp contrast to non-TE insertions, whose methylation levels were highly correlated with their nearby flanking regions (slope = 0.88, R2 = 0.61) (Fig. 3B). The pattern for non-TE insertions did not change much when we separated them based on whether they contained tandem repeats, on whether they were in CGIs, or on their CpG density (Supplemental Fig. S3A). Reference TE insertions displayed a similar pattern to that of nonreference TEs (Supplemental Fig. S3B). Among reference TE insertions, LTR5 exhibited the highest linear correlation slope of approximately 0.5 (Supplemental Fig. S3B).
The methylation correlation between human-specific TE insertions and their flanking regions. (A) Schematic representation of average methylation calculation of all insertions and associated 300 bp flanking regions. (B) Methylation correlation between insertions and 300 bp flanking regions. The average methylation of insertions is represented on the y-axis; the methylation of flanking regions, on the x-axis. Alu, LTR, L1, SVA, and non-TE insertions are represented by red, green, blue, purple, and gray dots, respectively, whereas non-TE insertions are labeled gray, serving as a background. Linear regression lines with standard errors are also plotted and labeled with the same color scheme. (C) Methylation correlation between insertions within CpG islands and 300 bp flanking regions. The average methylation of insertions are represented on the y-axis; the methylation of flanking regions, on the x-axis. Alu and non-TE insertions are represented in the same way as they are in B. (D) The WashU Epigenome browser views of an Alu insertion between hypomethylated and hypermethylated regions. The insertion was absent from HG03516 paternal haplotype but present in all the other nine haplotypes. A genome-align track is used to illustrate the insertion site. The Alu insertion methylation is boxed, showing a gradual change of methylation from left to right. Both HiFi and ONT methylC tracks display a methylation percentage from 0% to 100%. (E) Schematic representation of insertion-flanking methylation regression as a function of insertion-flanking distance. For each distance from 100 bp to 10 kb, we performed linear regression between insertion and flanking average methylation and estimated the linear regression slope and standard errors. (F) Linear regression slope between insertion and flanking methylation as a function of the insertion-flanking distance from 10 kb upstream to 10 kb downstream. Standard errors were represented by error bars. Alu, LTR, L1, SVA, and non-TE insertions are plotted in separated plots with different colors.
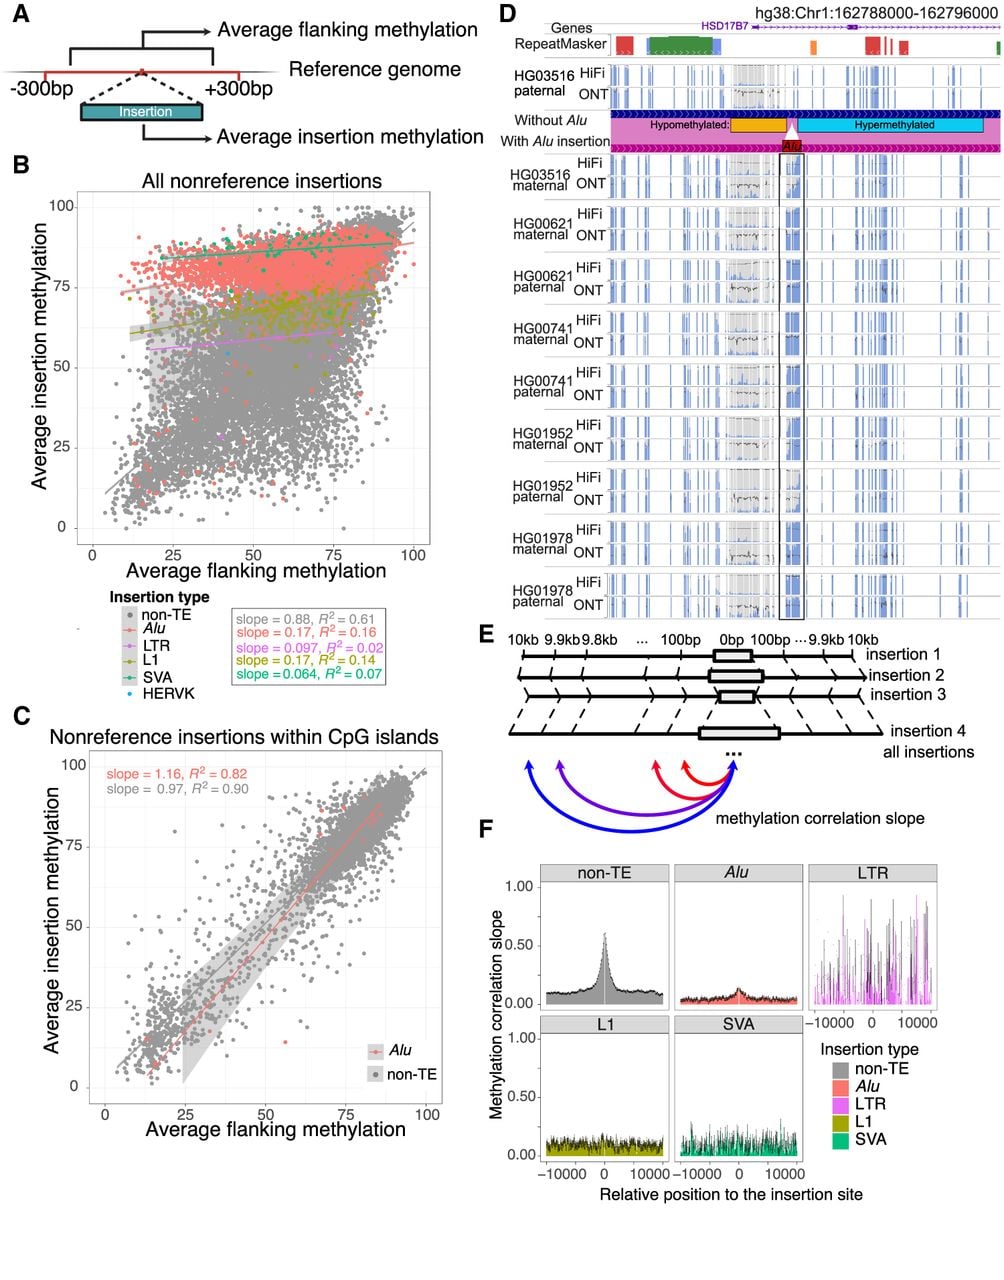
CGI is an important genomic feature, and its methylation status plays a significant role in gene regulation. When we restricted the above analysis to non-TE insertions within annotated human CGIs (as defined in the Introduction), we observed a stronger correlation between the insertions and their flanking methylation (slope = 0.97, R2 = 0.90) (Fig. 3C). This correlation extended even to Alu insertions within these CGIs. In contrast to the general hypermethylation of Alu insertions genome-wide, the methylation of Alu insertions within them correlated highly with their flanking methylation (slope = 1.16, R2 = 0.82) (Fig. 3C).
Despite the majority of Alus being hypermethylated, a small percentage were hypomethylated. For instance, at Chr 11: 59,565,869, a polymorphic Alu insertion within a hypomethylated CGI was hypomethylated. We plotted the methylation of this Alu along with its 300 bp flanking regions across all 32 samples (Supplemental Fig. S3C). The insertion site was hypomethylated in all samples, and the Alu insertion itself appeared to have adopted the hypomethylation status in all five samples in which it was present. This region can be further examined in sample HG03516, whose Alu insertion was heterozygous (Supplemental Fig. S3D). The regional hypomethylation, as well as the presence of the Alu insertion, was supported by HiFi, ONT, and WGBS analysis (Supplemental Fig. S3D,E).
Several Alu elements exhibited a methylation slope that connected hypomethylated and hypermethylated regions. We illustrated four such cases in Supplemental Figure S3F. At Chr 1: 162,791,517, Chr 2: 218,333,959, and Chr 9: 71,308,789, the 300 bp upstream of the insertion was hypermethylated, whereas the downstream region was hypomethylated. In contrast, at Chr 4: 163,587,802, the upstream region was hypomethylated, whereas the downstream region was hypermethylated. In each of these four cases, the Alu insertion displayed a gradual transition between hypo- and hypermethylation, with some variation observed among samples. We displayed the antisense Alu insertion at Chr 1: 162,791,517 in our comparative browser by phasing reads to paternal and maternal alleles (Fig. 3D). The ONT and HiFi data showed high agreement with each other on the methylation level of this nonreference insertion. Downstream from the Alu was hypomethylated (left side), whereas upstream of it (right side) was hypermethylated in all samples. In addition to that, there were variations among individuals and between haplotypes at this locus. Although most instances of this insertion were highly methylated throughout the Alu element, the methylation level in the HG03516 maternal allele exhibited a transition from low to high in the middle of the element. In contrast, this insertion was hypomethylated in the HG01952 paternal allele. No other sequence feature seemed to be associated with the methylation pattern difference across individual alleles around Chr 1: 162,791,517.
Our analysis thus far has revealed a strong correlation in DNA methylation levels between non-TE insertions and their 300 bp flanking regions and revealed a much weaker correlation when the insertions were TEs. We next investigated the insertion-flanking methylation correlation beyond 300 bp as a function of the distance between the insertion and the nearby regions. For each nonreference insertion, we calculated DNA methylation levels in its 10 kb flanking regions in both directions at a resolution of 100 bp nonoverlapping windows (Fig. 3E). We grouped the average methylation of all 100 bp windows from different insertions by their distance from the insertion sites and performed linear regression between the insertion and flanking regions. Because the slopes of the linear regression can reflect the methylation correlation between these regions, we displayed the slope of the linear regression as a function of the distance between the flanking windows and the insertion (Fig. 3F). We used non-TE insertions as a control in the analysis because they can be used to represent all factors affecting nearby methylation correlation including linkage disequilibrium decay. This analysis revealed that the methylation correlation slope between non-TE insertions and their flanking windows quickly faded away as the distance between the flanking window and insertion site increased, with an estimated elbow point being ∼2.5 kb away from the insertion. The slope decayed to and stayed at around 0.1 when the distance reached ≥5 kb. TEs once again displayed a distinct pattern. There was no observable correlation between L1, SVA, and HERV insertions and their flanking regions. We did however observe a weak correlation between Alu insertions and their flanking regions, but it also quickly faded away (Fig. 3F). The pattern of Alu was mostly driven by Alu insertions outside of annotated human CGIs (Supplemental Fig. S3G). This observation could be confounded if TE insertions were longer than non-TE insertions. To rule out this possibility, we investigated how the size of non-TE insertion could affect the insertion-flanking methylation correlation. If the methylation correlation is merely a function of the insertion size, we would expect ∼300 bp and ∼1000 bp non-TE insertions to behave similarly to Alu and LTR insertions, for example. We categorized non-TE insertions by their sizes into five bins and then calculated the regression slope in each bin (Supplemental Fig. S3H). Despite a slight decrease of the peak methylation correlation as a function of increased non-TE insertion size, the correlation was much higher than that of TE insertions of comparable length (e.g., the slope distribution of 300–1000 bp non-TE insertions was much higher than that of Alu and LTR insertions). This result suggests that the methylation of non-TE insertions, but not TE insertions, is highly correlated with that of their flanking regions.
Most TE insertions do not change the methylation level of their flanking regions
Some nonreference insertions could be deletion events in the human population (Lee et al. 2020b). However, TE insertions are essentially homoplasy-free (Batzer and Deininger 2002) and represent recent polymorphic insertions in the human population. Therefore, they are excellent candidates to investigate how new insertions might have influenced the methylation of their inserted regions.
Previous studies have suggested that repressive chromatin marks including DNA methylation deposited on newly inserted TEs can spread beyond TE/genome boundary (Turker 2002; Sentmanat and Elgin 2012; Zhang et al. 2012). On the other hand, hypomethylated L1 could drag down the methylation at its 5′ end (Grandi et al. 2015). It was also found that both hypermethylated and hypomethylated L1 insertions can impact nearby methylation in different cell lines (Lanciano et al. 2024).
The HPRC resources provided a unique opportunity to investigate the impact of TE insertions on nearby regions. For each polymorphic nonreference insertion relative to GRCh38, we separated HiFi reads from the 32 HPRC Year1 samples into two groups: alleles with the insertion and alleles without the insertion (Fig. 4A). We then calculated the average methylation level of the inserted regions (insertion), the 300 bp flanking regions of the insertion from both ends (insertion flanking), and the same flanking regions of the allele without insertion (empty flanking) (Fig. 4A).
Most of the newly inserted TEs did not alter the methylation pattern of their surrounding genomic context. (A) Schematic representation of a polymorphic insertion with aligned long reads. The allele without the insertion site (top) and the allele with the insertion site (bottom) were represented as reference allele and insertion allele. The average methylation level of the insertion, insertion flanking regions, and empty flanking regions were calculated from reads from all 32 samples. We then calculated flanking methylation difference by subtracting the methylation level of empty flanking region from that of insertion flanking region. (B) Methylation level of empty flanking (x-axis), insertion flanking (y-axis), and non-TE inserted regions (blue–red color scale as shown in C). Insertions were separated into four facets by whether they are tandem repeats and whether they are CpG islands. Linear regression R2-values were shown on each panel. (C) Similar to B, but the methylation level of different TE insertions was presented and separated by the TE insertion types. R2 were displayed in the top left corner on each panel. (D) Dot plot illustrated the relationship between methylation level of insertion (y-axis) and methylation difference between empty and insertion alleles of the flanking regions (x-axis). The average methylation difference of all non-TE insertions was labeled at 0.25%. Red dotted lines indicated the methylation difference threshold of ±25%, and 99% of non-TE insertions fall within this range. The insertion methylation density was displayed on the right side of the figure. (E) TE insertion flanking methylation differences plotted in the sample way as in D. Different TE insertions were distinguished by different colors. The percentage of all insertions within 25% differences, and the average flanking methylation differences of different TEs were labeled. The insertion methylation density was shown on the right of the figure. The average methylation of each TE class was labeled with the same color scheme. (F) Alu and L1 insertion flanking methylation differences are not higher when the TEs were hypermethylated. We separated all Alu and L1 insertions to above average and below average based on the average TE methylation. The flanking methylation differences are plotted as a violin plot. The flanking methylation differences distribution is similar in all groups, and each of them has a wide range. (G) Methylation level of 300 bp upstream of the empty allele (x-axis), 300 bp upstream of the insertion allele (y-axis), and the first 500 bp inserted methylation (blue–red color scale) of L1 and SVA insertions displayed similar to B and C.
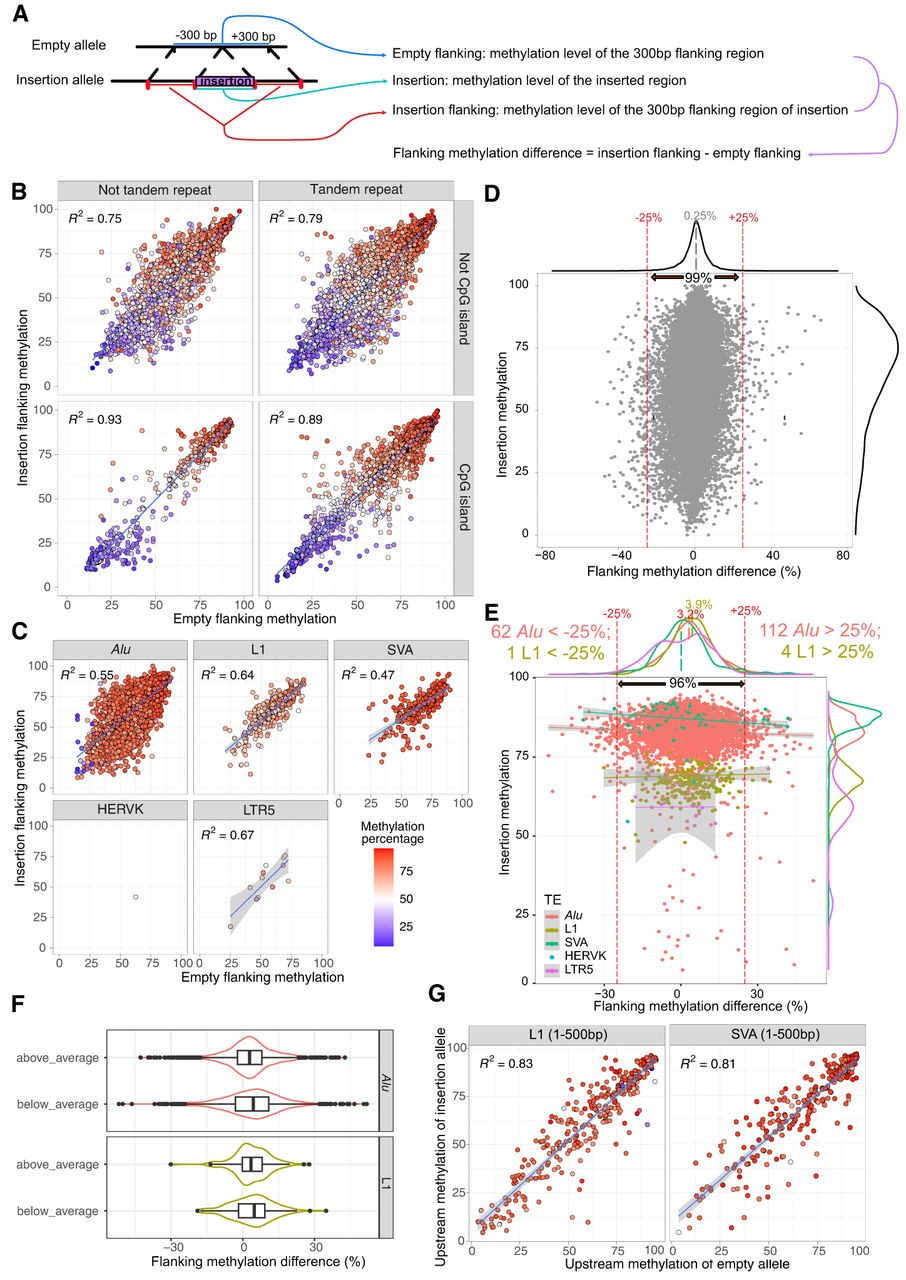
To illustrate the relationship between these three regions, we plotted the methylation levels of insertion flanking and empty flanking on the x–y-axis using a dot plot. We colored the dots based on the methylation level of insertions. We separated non-TE insertions by whether they were annotated as tandem repeat or CGIs and classified TE insertions by TE classes. In general, the methylation levels of insertion, insertion flanking, and empty flanking correlated with each other for non-TE insertions (Fig. 4B). However, for TE insertions, the flanking methylation levels of insertion and empty sites showed a strong correlation independent of the methylation of the insertion (Fig. 4C).
To better understand the subtle changes in flanking methylation levels between insertion and empty sites, we defined the flanking methylation difference for each insertion by subtracting the flanking methylation of the empty site from the flanking methylation of the insertion site (Fig. 4A). We reasoned that an allele without a TE insertion represents the ancestral allele (Batzer and Deininger 2002). If the insertion increases flanking methylation, the difference would be positive; if it decreases methylation, the difference would be negative. Conversely, if the insertion has no impact on flanking region methylation, the difference would be zero.
We first plotted the correlation between flanking methylation variations and the methylation of non-TE insertions (Fig. 4D). In this panel, the x-axis represents the differential flanking methylation, calculated as the methylation level of the allele containing the insertion minus the methylation of the empty site (the allele without the insertion). The y-axis represents the methylation level of the insertion itself. The overall methylation differences between orthologous flanking regions with or without insertions were predominantly centered around zero (population average was 0.25%): 99% of the data points (28,344/28,621) fell within the −25% to +25% range. Notably, these variations were independent of the methylation level of the insertion itself. However, there indeed existed multiple instances in which hypermethylated insertions were associated with increased flanking methylation, and hypomethylated insertions were linked to decreased methylation (Fig. 4D). Collectively, these findings strongly indicate that, although there are noted exceptions, non-TE insertions generally do not significantly impact flanking region methylation.
We then investigated the same relationship in the context of TE insertions (Fig. 4E). Compared with non-TE insertions, the range of methylation differences was slightly wider (96%, 5075/5263, within −25% and 25%), indicating significantly increased variations in flanking region methylation associated with TE insertions (F-test to compare two variances: P-value < 2.2 × 10⁻¹⁶). On average, flanking methylation differences centered around zero for LTR and SVA insertions. However, the average flanking methylation differences for Alu and L1 insertions were significantly larger than zero (3.2% and 3.9%, respectively) (Fig. 4E). Furthermore, there were more Alu and L1 insertions with methylation increase >25% than decrease >25% (112 vs. 62, and four vs. one, respectively) (Fig. 4E). When we separated Alu and L1 insertions by above and below average Alu/L1 methylation, we did not find much difference between them (Fig. 4F). The range of methylation differences we observed was also quite large. For example, the mean methylation level of inserted Alus was 82.7%, and Alu insertions with a methylation level greater than this mean value were associated with a flanking region methylation difference ranging from −42.74% to +42.66% (Fig. 4F), with 21 of them associated with an increased flanking region methylation by >30%. Similarly, the mean methylation level of inserted L1s was 69.2%, and L1 insertions with methylation level greater than this mean value were associated with a flanking region methylation difference ranging from −30.1% to +27.8%, but none of them was associated with an increased flanking region methylation by >30% (Fig. 4F). These examples only weakly support the hypothesis that DNA methylation deposited on newly inserted TEs could spread and increase local DNA methylation level. Contrary to this conventional view, our genome-wide assessment suggests that the spreading is limited, and this more drastic influence of TEs on nearby genomic methylation may be an exception rather than the rule.
It has been reported that L1 promoter methylation can influence the nearby upstream methylation (Lanciano et al. 2024). To test this hypothesis using our data, we created a dotplot similar to Figure 4C, but using the 5′-end 500 bp of L1/SVA insertions along with the 300 bp upstream region genomic sequences (Fig. 4G). Notably, despite the existence of a few exceptions, the upstream methylation of empty sites consistently matched those with insertions, indicating that the vast majority of L1/SVA insertions did not affect their flanking upstream methylation.
To further validate and generalize our findings, we aggregated all polymorphic insertions and plotted the average methylation trendline based on their relative position in relationship to the insertion sites from the reference genome (Supplemental Fig. S4A). We found a subtle increase of methylation flanking the polymorphic L1/Alu insertions, with the highest increase right at the insertion site (3.1% for L1 and 3.2% for Alu). This flanking methylation difference between insertion and empty site decreased as the distance to insertion position increased, and the methylation difference diminished at ∼1 kb away from the insertion site (Supplemental Fig. S4A). The exact same pattern was recapitulated by both the ONT methylation data (phased ONT reads) and the WGBS data (WGBS reads of homozygous insertions to the individual's own genome assemblies) from the five HPRC individuals (Methods) (Supplemental Fig. S4B,C). Taken together, these results suggest that polymorphic Alu and L1 insertions are associated with slightly elevated DNA methylation levels at their insertion sites with highly localized and small effect size.
The exceptions: TE insertions associated with flanking region methylation change
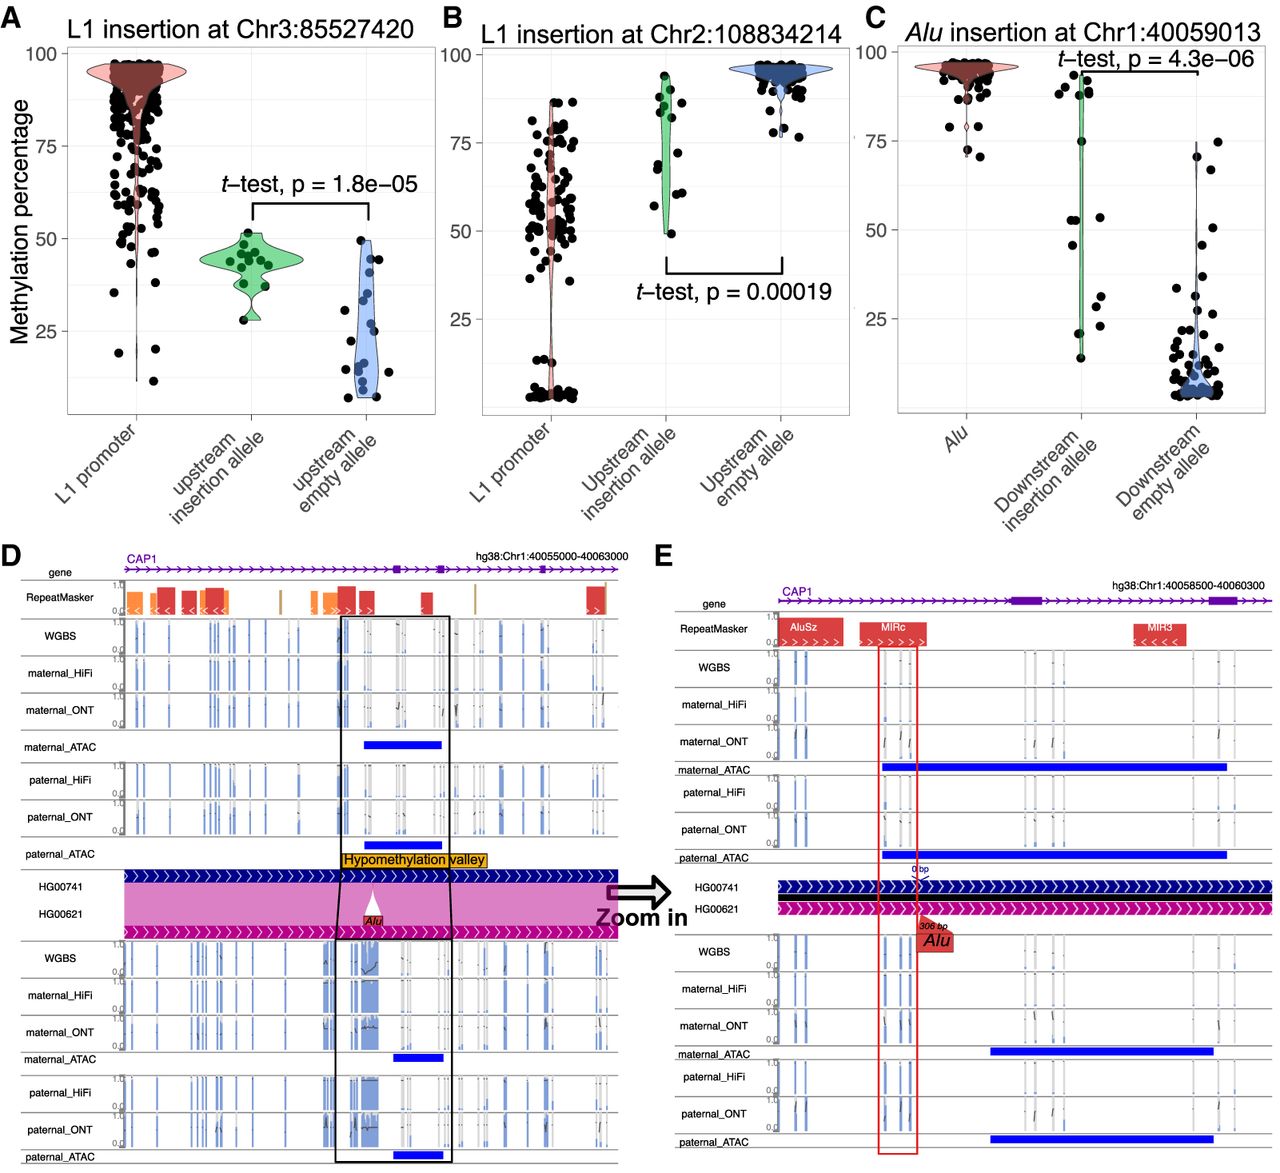
Despite most TE insertions not affecting the methylation of their insertion sites, we also found numerous TE insertions associated with flanking methylation changes (Supplemental Table S3). For instance, the hypermethylated promoter of L1 insertion at Chr 3: 85,527,420 (average promoter methylation level 88%) was associated with an increase in methylation of the CpG site upstream of the insertion. We plotted the methylation of each CpG site of the 5′-end 1000 bp of the L1 along with both flanking regions across all 32 samples in Supplemental Figure S5A and summarized them in Figure 5A. In samples without this insertion, the upstream CpG site was mostly hypomethylated (average methylation 24.3%), whereas in samples with the insertion, it was generally intermediately methylated (average methylation 42.9%) (Fig. 5A). Conversely, the L1 insertion with a hypomethylated promoter (average methylation level 46.3%) at Chr 2: 108,834,214 was associated with a reduction in methylation of its upstream region (from 94.2% to 74.7%) (Fig. 5B; Supplemental Fig. S5B).
Several examples of TE insertion have been observed to alter the methylation levels of their neighboring regions. (A) The violin plot illustrated the methylation levels of the L1 promoter at Chr 3: 85,527,420. It compared the upstream CpG methylation of the insertion allele and the empty allele. Each dot represented the methylation percentage of a specific CpG site in a particular sample. A t-test was conducted to compare the matching upstream methylation levels, and the P-value is indicated on the figure. (B) The violin plot of L1 promoter methylation at Chr 2: 108,834,214 is similar to A. The upstream CpG methylation of the insertion allele and the upstream methylation of the empty allele were shown. Each dot represented the methylation percentage of a specific CpG site in a particular sample. A t-test was performed and labeled accordingly. (C) The violin plot of Alu methylation at Chr 1: 40,059,013 is similar to A. The downstream CpG methylation of insertion allele and the downstream methylation of empty allele were shown. Each dot represented the methylation percentage of a specific CpG site in a particular sample. A t-test was performed and labeled accordingly. (D) The WashU Epigenome Browser view of a hypermethylated Alu insertion within a hypomethylated valley that was present in HG00621 but absent in HG00741 characterized by WGBS, HiFi, and ONT methylation. All the methylC tracks displayed methylation percentages ranging from 0% to 100%; open chromatin peaks derived from ATAC-seq were shown as blue boxes. (E) Zoom-in view of the methylation of the same Alu element from D. The boxed three CpG sites within 200 bp of the insertion site underwent a change in methylation status, transitioning from hypomethylation to hypermethylation in association with the Alu insertion.
The impact of TE insertions on nearby genomic sequence can also be appreciated by examining heterozygous insertion in the same individual, for example, the L1 insertion at Chr 3: 85,527,420 in both HG00621 and HG00741 (present only in the paternal haplotype). Both long-read methods identified the CpG site 46 bp upstream of the L1 insertion was hypermethylated (average 81%) but remained hypomethylated in the remaining eight haplotypes without the insertion (average 21%) (Supplemental Fig. S5H). In contrast, this specific polymorphic L1 was reported by Lanciano et al. (2024) to increase upstream CpG methylation in the MCF-7 cell line but was hypomethylated and had reduced proximal methylation in the 2102Ep cell line. Taken together, these results suggest that this specific polymorphic L1 insertion adopts cell type–specific DNA methylation, which may spread to its immediate region upstream.
We confirmed the impact of multiple L1 loci, including the insertion at Chr 3: 85,527,420 we described above. However, there were also instances in which the relationship between methylation differences and L1 insertions was less evident. For instance, the methylation of the empty allele at CpG site Chr 14: 24,523,788, upstream of the L1 insertion at Chr 14: 24,523,704, exhibited significant variability across the HPRC samples. Meanwhile, the same CpG site was intermediately methylated among samples with the insertion allele, and the difference was not statistically significant (P = 0.42) (Supplemental Fig. S5C,D). At CpG site Chr 5: 137,679,380, upstream of the L1 insertion at Chr 5: 137,679,083, whereas the methylation difference between the insertion and empty alleles was significant (P = 0.0056), the high methylation variation of the empty allele made it difficult to conclude that the insertion allele methylation was influenced by the L1 insertion (Supplemental Fig. S5E,F).
Our study identified thousands of Alu insertions, and most of them were hypermethylated. In some cases, their methylation appeared to be influenced by their genomic context (Fig. 3). Can Alu insertions influence the methylation of their nearby regions? We found that although the large majority of Alu insertions seemed to have no impact on nearby DNA methylation, exceptions did exist. For example, polymorphic Alu insertion at Chr 1: 40,059,013 was hypermethylated (average methylation 94%) and so were three downstream CpG sites within 200 bp (average methylation 58.1%). In samples without the Alu insertion, these three CpG sites were hypomethylated (average methylation 12.2%) (Fig. 5C; Supplemental Fig. S5G). A closeup view revealed that this Alu insertion was homozygous in HG00621 but absent in HG00741 (Fig. 5D,E). This Alu was inserted within a hypomethylation valley (Chr 1: 40,058,800–40,060,800, methylation level 4%). In HG00621, the Alu insertion was hypermethylated (methylation level 85%), and methylation level of the hypomethylation valley was elevated to 21% (Supplemental Fig. S5H; Li et al. 2022; Zhuo et al. 2023). The three CpG sites 200 bp 3′ to the Alu insertion site were lowly methylated in HG00741 (18%, 5%, 4%) but highly methylated in HG00621 (89%, 88%, 93%). On the other hand, multiple CpG sites >300 bp downstream from the insertion site seemed to have remained their hypomethylated state (three CpGs, 3% in HG00741, 5% in HG00621) (Supplemental Fig. S5H). We also mapped Assay for transposase-accessible chromatin using sequencing (ATAC-seq) data to the same genomes and found that the reduction of the hypomethylation valley in HG00621 following the Alu insertion coincided with the reduction of open chromatin ATAC-seq peak (Fig. 5D,E). The impact of this Alu insertion to open chromatin suggested its likely influence on the local cis-regulatory landscape.
Discussion
Characterizing cytosine methylation is important for both evolutionary analysis and tissue-specific gene regulation. However, conventional bisulfite or enzyme conversion-based methods do not readily characterize methylation of repetitive regions or nonreference regions. Using long-read sequencing, we can call methylation during the basecalling step, greatly simplifying the methylation calling process and allowing new investigations into genomic DNA methylation. Here we compared the methylation calling results between HiFi, ONT, and WGBS from five HPRC LCL samples, and we found both HiFi and ONT can measure CpG methylation in human genome with high correlation and concordance in comparison with WGBS.
Although the methylation profiles of various human TE subfamilies are well documented (Xie et al. 2013; Turelli et al. 2014; Roadmap Epigenomics Consortium et al. 2015; Pehrsson et al. 2019), the characterization of nonreference TE insertions remained challenging until recent advancements in long-read sequencing technology. Here we characterized the methylation profile of nonreference TE insertions. We found that the VNTR regions of nonreference SVA insertions were methylated at a lower level compared with their counterparts in the reference genome. Given the variable length of VNTR, a more specific analysis is necessary to determine their methylation levels accurately.
How are genomic insertions, in particular TE insertions, methylated, and how do they affect the methylation level of their flanking regions, have been long-standing questions in the field. Several paradigms have been promoted, especially in the context of spreading of epigenetic modifications. For example, the hypermethylation of a B2 element close to the Aprt promoter in mouse genome can spread to nearby CpG sites until stopped by SP1 binding (Turker 2002). By examining CpG density flanking Alu insertions, Zhou et al. (2020) found evidence of CpG methylation spreading from old TEs to flanking regions during evolution. There are also documented examples of L1 insertions affecting nearby methylation (Grandi et al. 2015; Lanciano et al. 2024). These previous studies provided enormous insights on how newly inserted TEs are epigenetically modified and how the modifications influence genomic neighborhood. However, a key question remains open as to what degree these examples represent the genome-wide rules or exceptions.
Taking advantage of both SV and methylation calling using the HiFi reads from 32 samples of HPRC Release 1 data set, we addressed this question by analyzing differential methylation between alleles with polymorphic insertions at a genome-wide scale. Our analysis suggests that the methylation of non-TE insertions is strongly associated with their genomic context. Among TE insertions, we identified limited methylation spreading from hypermethylated LINE1 and Alu elements to their flanking regions, whereas SVA and LTR5 insertions exerted a negligible effect on their surrounding genomic context. Consistent with the work of Lanciano et al. (2024), we find some methylation spreading from L1 to nearby regions. However, the effect is very small (on average ∼3% increase of methylation within 300 bp). The minimum spreading of methylation from polymorphic TE insertions to their flanking regions we found suggests that methylation spreading is a slow evolutionary process with limited effect after TE insertion but can potentially have large impact at an evolutionary timescale (Zhou et al. 2020).
However, our analysis was conducted on EBV-derived lymphoblastoid cell lines, which are commonly used for genome sequencing. It is crucial to note that the genomic methylation status observed in this cell line does not reflect the diverse epigenomic characteristics of various human cell types (Roadmap Epigenomics Consortium et al. 2015). Therefore, careful characterization of other cell types is necessary to validate our findings in this cell line and to gain a deeper understanding of the dynamic methylation patterns in humans. Notably, LCLs, like most differentiated somatic cells, exhibit global hypermethylation, whereas many germline, stem, and cancer cells are globally hypomethylated (Roadmap Epigenomics Consortium et al. 2015). Consequently, our analysis on LCLs restricted our capability to capture the spreading of hypomethylated TEs, which may be more prevalent in globally hypomethylated cells (Grandi et al. 2015; Lanciano et al. 2024).
Because our strategy was conceptually similar to that from Lanciano et al. (2024), we directly examined the potentially polymorphic L1 insertions characterized by their study, which were reported to exhibit short-range epivariation in almost half of the cases. We found 21 out of the 87 L1 insertions from their study had sufficient HiFi coverage of both empty and insertion alleles in the HPRC data set. The 300 bp upstream methylation of empty and insertion alleles were highly correlated with R2 = 0.97 if they were classified as “not influenced,” with R2 = 0.86 if they were classified as “inconclusive,” and with R2 = 0.61 if they were classified as “influenced” (Supplemental Fig. S6), as defined by Lanciano et al. (2024). Thus, those L1 insertions that were determined by Lanciano et al. to exhibit short-range epivariation were indeed associated with slightly increased differences between alleles with the insertion and the empty alleles, replicated in our own data set. However, the empty allele and insertion allele from the same locus were still strongly correlated with each other, indicating the effect size of L1 influence was small. In contrast, our HPRC data set contained a much larger sample size, and we determined that the flanking methylation difference between the insertion allele and the empty allele was <25% for most cases (287 out of 292 L1 insertions and 4519 out of 4693 Alu insertions) (Fig. 4). Thus, we concluded that the majority of polymorphic TE insertions do not change their flanking region DNA methylation, whereas there exist numerous exceptions with a limited short-range influence.
To visualize the methylation of nonreference insertions, we mapped reads to the high-quality individual assemblies and displayed them on the WashU Epigenome Browser using the genome comparison feature (Li et al. 2022; Zhuo et al. 2023). However, this approach is limited by the underlying pairwise alignment and, more crucially, the availability of high-quality individual assemblies. We hope the development of pangenome-based tools would facilitate data display of nonreference sequences in the future.
With the ongoing effort and continuing release of high-quality data from HPRC, we envision the publicly available long-read methylation data can be used to address other questions in the biomedical field, and we invite other scientists to explore the rich HiFi HPRC data set (Liao et al. 2023).
Methods
Genome assembly and scaffolding
The genome assemblies used in this study were produced for the draft human pangenome, combining PacBio HiFi long-read and Illumina short-read sequencing for de novo assembly with parental short-read data used to for phasing of these assemblies. All assemblies are available at GitHub (https://github.com/human-pangenomics/HPP_Year1_Assemblies). Phased contig assembly was performed using hifiasm (Cheng et al. 2021). Postassembly, the RagTag toolset was employed for reference-guided scaffolding, organizing contigs into structured, phased chromosomal assemblies (Alonge et al. 2022). Validation was performed using Bionano optical mapping in order to detect and amend potential assembly inaccuracies (Lam et al. 2012). For each of the 10 assemblies derived from the five diploid samples, we created a whole-genome pairwise alignment BAM file with GRCh38 using minimap2 (Li 2018). All raw and processed sequencing data from the HPRC are available via the the NCBI BioProject database (https://www.ncbi.nlm.nih.gov/bioproject/) under accession number PRJNA701308.
Whole-genome bisulfite sequencing
The cytosine methylation was estimated by mapping to reference genome GRCh38 or the individual assemblies using the standard WGBS pipeline Bismark as described by Krueger and Andrews (2011) and Lee et al. (2020a). The raw reads are available via the NCBI Gene Expression Omnibus (GEO; https://www.ncbi.nlm.nih.gov/geo/) with accession GSE261315.
ATAC-seq
ATAC-seq were conducted following standard protocol with paired-end sequencing on Illumina NextSeq 500 (Buenrostro et al. 2015). The sequencing results were analyzed using ATAC-seq integrated analysis pipeline (AIAP) (Liu et al. 2021a).
PacBio HiFi methylation
PacBio single-molecule HiFi circular consensus sequencing (CCS) reads with kinetics tags can be generated using pbccs (https://github.com/nlhepler/pbccs). We then predicted cytosine methylation probability per molecule in all CpG context by applying primrose to PacBio HiFi reads (https://github.com/PacificBiosciences/jasmine). The CpG methylation probability was saved as the ML and MM tags in the BAM file following standard BAM format convention (http://samtools.github.io/hts-specs/SAMtags.pdf). The HiFi methylation BAM files of the 32 samples are accessible at https://s3-us-west-2.amazonaws.com/human-pangenomics/index.html?prefix=submissions/560047a6-6d16-4b0c-aac9-7d0c83e2188e--HIFI-METHYLATION-READS/. Unaligned HiFi BAM files were aligned to human reference genome GRCh38 using PacBio pbmm2 (https://github.com/PacificBiosciences/pbmm2), and CpG methylation percentage on the reference genome were calculated using PacBio pb-CpG-tools (https://github.com/PacificBiosciences/pb-CpG-tools). We ran the methylation percentage calculation using default model “PB-model.”
Nanopore ONT methylation
We downloaded raw sequencing signal of ONT Nanopore (FAST5 files) of the same five samples and performed methylation calling using the basecaller guppy with the methylation model remora (https://github.com/nanoporetech/remora). CpG methylation probability of ONT reads was estimated using Nanopore basecaller Guppy v6 with remora methylation model (v9.4.1; https://community.nanoporetech.com). The CpG methylation probability were saved as the standard ML and MM tags in the BAM format (http://samtools.github.io/hts-specs/SAMtags.pdf). ONT unaligned BAM files were aligned to human reference genome GRCh38 using minimap2 (https://github.com/lh3/minimap2), and the methylation percentage was calculated using modbam2bed (https://github.com/epi2me-labs/modbam2bed).
Methylation comparison
With genome-wide methylation percentage of all three methods calculated, we made a pairwise correlation heatmap and PCA plot and calculated the MAE, 20% concordance, and Pearson's correlation using R (Wickham 2009; Emerson et al. 2013). We also applied DSS to define pairwise DMRs (Feng et al. 2014; Wu et al. 2015).
Long-read phasing
We used HiPhase for HiFi reads phasing (Holt et al. 2024). To determine in each phase block which haplotype is paternal and which is maternal, we downloaded HiFi reads used for constructing paternal and maternal assemblies from hifiasm output gfa files (HG00621, HG00741, HG01952, HG01978, HG03516). We labeled the haplotype paternal if the number of reads labeled with it from the same phase block used for paternal assembly is more than 10 times higher than that used for maternal assembly; otherwise, it is maternal. Once we separated HiFi reads to paternal and maternal with whatshap (Patterson et al. 2015), we aligned them to the individual paternal and maternal assemblies, accordingly using pbmm2 (https://github.com/PacificBiosciences/pbmm2). At last, we calculated the genome-wide methylation percentage on individual assemblies using pb-CpG-tools (https://github.com/PacificBiosciences/pb-CpG-tools).
To phase ONT reads according to the individual assemblies, we created a diploid VCF file for each sample using dipcall (Li et al. 2018; https://github.com/lh3/dipcall) and haptagged all reads using haplotype information from the VCF file. We then separated paternal and maternal reads using whatshap (Patterson et al. 2015) and aligned them to paternal and maternal assembly using minimap2 (Li 2018, 2021), respectively. At last, we converted the BAM file to methylbed files with modbam2bed (https://github.com/epi2me-labs/modbam2bed).
Individual genome visualization
For each pairwise genome alignment between GRCh38 and individual genome, we created a genome-align track file using the pairwise genome alignment BAM file (Zhuo et al. 2023). We built individual genome assembly of both maternal and paternal chromosomes of the five samples (10 assemblies in total) and aligned each of them to the GRCh38 to create genome-align tracks. We also phased HiFi reads using HiPhase using alignment to GRCh38 and assigned haplotypes to paternal/maternal for each phasing block based on a hifiasm assembly construction graph (Cheng et al. 2021; Holt et al. 2024). We then aligned maternal and paternal HiFi reads to the maternal/paternal assembly separately for each of the five samples. Applying the genome-align track we anchored gene, repeat, and CGI annotations from GRCh38 onto the individual genomes. We colored each CpG site by their methylation prediction (red: methylated; blue: unmethylated) per HiFi read using the modbed tracks and displayed piled up methylation level using the methylC track. Both modbed and methylC tracks were mapped to the individual genome. Combining genome-align, methylC, and modbed track files, we created three datahubs on the WashU Epigenome browser representing HiFi, ONT, and WGBS data (https://epigenomegateway.wustl.edu/browser2022/?genome=hg38&hub=https://wangcluster.wustl.edu/~xzhuo/hifi_methylation/hifi.all.json, https://epigenomegateway.wustl.edu/browser2022/?genome=hg38&hub=https://wangcluster.wustl.edu/~xzhuo/hifi_methylation/ont.all.json, https://wangcluster.wustl.edu/~xzhuo/hifi_methylation/wgbs_individual/wgbs.all.json) (Zhou et al. 2014; Li et al. 2022, 2023).
After aligning WGBS reads to the individual assembly as described above, we also plotted the WGBS methylation of nonreference Alu insertion at Chr 11: 59,565,869 using Methylartist (Ewing et al. 2020; Cheetham et al. 2022).
Structural variation and TE annotation
We obtained the structural variations of each sample from HPRC consortium (Liao et al. 2023; https://s3-us-west-2.amazonaws.com/human-pangenomics/index.html?prefix=submissions/B581EBA7-8BDE-4C7C-9DEA-78B99A051155--Yale_HPP_Year1_Variant_Calls/). We merged all the called SVs from the 32 samples using BCFtools merge (Danecek et al. 2021). To further annotate TE insertions among all structural variations, we ran MELT-LRA and PALMER2 on HiFi assemblies and xTEA on the same PacBio HiFi library mapped to GRCh38 (Gardner et al. 2017; Chu et al. 2021; Zhou et al. 2024). To generate a high-quality full-length TE insertion set, we filtered out Alu insertions <300 bp, SVA < 1000 bp, L1 < 5500 bp, and LTR5 < 900 bp. For Alu, L1, and SVA insertions, we included MEIs called by at least two of three methods. MELT-LRA did not call HERVK insertion, and we manually verified 25 out of 34 HERVK insertions identified by either xTEA or PALMER2. We summarized MEI caller output in Supplemental Table S1. We then intersected the coordinates of TE insertions with SV and annotated which SVs are TE insertions (Supplemental Table S2).
We developed a script to extract nonreference insertions. Using a BED file of annotated insertion sites, it can extract inserted and soft-clipped sequences from raw reads and generate a new unmapped modBAM file of inserted sequences with base modification tags (MM and ML) (bam.extractInsertion.py). We can then align the unmapped modBAM file to their respected TE consensus (L1HS, AluY, SVA_F, LTR5_Hs, and HERVK-int from Dfam database) to create CpG methylation pileup results (Wheeler et al. 2012; Hubley et al. 2016).
To calculate average methylation of certain regions, we extracted the methylation prediction value of each CpG site of each read from BAM files with methylation tags with a Python script (Python bam.Mmtag.regions.oo.py -b <bam> -r <insertion.bed> -o <ins.methylC.reldist.txt> -f <bed>) (see Code availability).
To evaluate the relationship between CpG methylation and indels, we aggregated methylation prediction of all 32 samples and calculated the average CpG methylation of each CGI (Quinlan and Hall 2010).
Reference TE methylation
We extracted 52,802 AluY, 2746 AluYa5, 36 AluYa8, 2111 AluYb8, and 301 AluYb9 from GRCh38 using RepeatMasker annotation. Similarly, we extracted 124 SVA_E, 331 SVA_F, 481 LTR5 as reference TEs. We also downloaded 146 active L1 on GRCh38 from L1 Base2 (Penzkofer et al. 2017). We then take their DNA sequences from the GRCh38 reference and their corresponding methylation from piled up bedMethyl files and generated new modBAM files to bind methylation percentage to the sequence as the modified base (bam.creation.py). At last, we mapped the new BAM file to TE consensus using minimap2 to align the CpG methylation percentage to the TE consensus (L1HS, AluY, SVA_F, LTR5_Hs, and HERVK-int) (Wheeler et al. 2012; Hubley et al. 2016).
Reference or nonreference insertions are relative to the reference genome chosen for alignment, and nonreference insertions can be aligned to the genome if we chose the individual assembly as the “reference.” Therefore, the sample process can be applied to extract “non-ref” insertions on the GRCh38 after aligning long reads to the individual assembly.
Insertion and flanking methylation calculation
We selected nonreference insertions from annotated SVs and used a custom Python script (see Code availability) to calculate the average methylation of the insertion and flanking regions (python read.methylation.mean.py -i <input> -o <output> -s <start> -l <length> -c).
CGI methylation and indel frequency calculation
The unmasked CGI annotation file was downloaded from UCSC (https://hgdownload.soe.ucsc.edu/goldenPath/hg38/database/cpgIslandExtUnmasked.txt.gz). For each CpG site on GRCh38, we calculated the median methylation percentage of the 32 HiFi methylation. We then calculated the average methylation percentage of each CGI using the median methylation.
After separating CGIs to hypermethylated and hypomethylated ones using 50% methylation as the cutoff, we calculated the indel frequency of different sizes within CGIs. To create the background indel frequency in the genome, we shuffled CGIs in the genome and repeated the calculation.
We also repeated the same calculation using the same methylation data and indel callset from The 1000 Genome Project and HGSVC project (The 1000 Genomes Project Consortium 2015; Ebert et al. 2021).
Code availability
Custom scripts are available at GitHub (https://github.com/xzhuo/modbamUtil) and as Supplemental Code.
Data access
The ATAC-seq data generated in this study have been submitted to the NCBI BioProject database (https://www.ncbi.nlm.nih.gov/bioproject/) under accession number PRJNA1130678.
Competing interest statement
The authors declare no competing interests.
Acknowledgments
This work was in part supported by National Institutes of Health (National Human Genome Research Institute) grant numbers R01HG007175, U01CA200060, U01HG009391, U41HG010972, U24HG012070, U24NS132103, UM1DA058219, UM1HG011585, and UM1MH130994.
Footnotes
[1] Supplementary material [Supplemental material is available for this article.]
[2] Article published online before print. Article, supplemental material, and publication date are at https://www.genome.org/cgi/doi/10.1101/gr.281571.125.
[3] Freely available online through the Genome Research Open Access option.
[4] Supplementary material [Supplemental material is available for this article.]
References
- ↵The 1000 Genomes Project Consortium. 2015. A global reference for human genetic variation. Nature 526: 68–74. 10.1038/nature15393
- ↵Alonge M, Lebeigle L, Kirsche M, Jenike K, Ou S, Aganezov S, Wang X, Lippman ZB, Schatz MC, Soyk S. 2022. Automated assembly scaffolding using RagTag elevates a new tomato system for high-throughput genome editing. Genome Biol 23: 258. 10.1186/s13059-022-02823-7
- ↵Batzer MA, Deininger PL. 2002. Alu repeats and human genomic diversity. Nat Rev Genet 3: 370–379. 10.1038/nrg798
- ↵Bird AP. 1986. CpG-rich islands and the function of DNA methylation. Nature 321: 209–213. 10.1038/321209a0
- ↵Bird A. 2002. DNA methylation patterns and epigenetic memory. Genes Dev 16: 6–21. 10.1101/gad.947102
- ↵Bodea GO, Botto JM, Ferreiro ME, Sanchez-Luque FJ, de los Rios Barreda J, Rasmussen J, Rahman MA, Fenlon LR, Jansz N, Gubert C, 2024. LINE-1 retrotransposons contribute to mouse PV interneuron development. Nat Neurosci 1274–1284. 10.1038/s41593-024-01650-2
- ↵Boissinot S, Chevret P, Furano AV. 2000. L1 (LINE-1) retrotransposon evolution and amplification in recent human history. Mol Biol Evol 17: 915–928. 10.1093/oxfordjournals.molbev.a026372
- ↵Buenrostro JD, Wu B, Chang HY, Greenleaf WJ. 2015. ATAC-seq: a method for assaying chromatin accessibility genome-wide. Curr Protoc Mol Biol 109: 21.29.1–21.29.9. 10.1002/0471142727.mb2129s109
- ↵Cheetham SW, Kindlova M, Ewing AD. 2022. Methylartist: tools for visualizing modified bases from nanopore sequence data. Bioinformatics 38: 3109–3112. 10.1093/bioinformatics/btac292
- ↵Cheng H, Concepcion GT, Feng X, Zhang H, Li H. 2021. Haplotype-resolved de novo assembly using phased assembly graphs with hifiasm. Nat Methods 18: 170–175. 10.1038/s41592-020-01056-5
- ↵Choi JY, Purugganan MD. 2018. Evolutionary epigenomics of retrotransposon-mediated methylation spreading in rice. Mol Biol Evol 35: 365–382. 10.1093/molbev/msx284
- ↵Chu C, Borges-Monroy R, Viswanadham VV, Lee S, Li H, Lee EA, Park PJ. 2021. Comprehensive identification of transposable element insertions using multiple sequencing technologies. Nat Commun 12: 3836. 10.1038/s41467-021-24041-8
- ↵Cokus SJ, Feng S, Zhang X, Chen Z, Merriman B, Haudenschild CD, Pradhan S, Nelson SF, Pellegrini M, Jacobsen SE. 2008. Shotgun bisulphite sequencing of the Arabidopsis genome reveals DNA methylation patterning. Nature 452: 215–219. 10.1038/nature06745
- ↵Danecek P, Bonfield JK, Liddle J, Marshall J, Ohan V, Pollard MO, Whitwham A, Keane T, McCarthy SA, Davies RM, 2021. Twelve years of SAMtools and BCFtools. GigaScience 10: giab008. 10.1093/gigascience/giab008
- ↵Ebert P, Audano PA, Zhu Q, Rodriguez-Martin B, Porubsky D, Bonder MJ, Sulovari A, Ebler J, Zhou W, Serra Mari R, 2021. Haplotype-resolved diverse human genomes and integrated analysis of structural variation. Science 372: eabf7117. 10.1126/science.abf7117
- ↵Emerson JW, Green WA, Schloerke B, Crowley J, Cook D, Hofmann H, Wickham H. 2013. The generalized pairs plot. J Comput Graph Stat 22: 79–91. 10.1080/10618600.2012.694762
- ↵The ENCODE Project Consortium. 2012. An integrated encyclopedia of DNA elements in the human genome. Nature 489: 57–74. 10.1038/nature11247
- ↵Ernst J, Kellis M. 2012. ChromHMM: automating chromatin-state discovery and characterization. Nat Methods 9: 215–216. 10.1038/nmeth.1906
- ↵Ewing AD, Smits N, Sanchez-Luque FJ, Faivre J, Brennan PM, Richardson SR, Cheetham SW, Faulkner GJ. 2020. Nanopore sequencing enables comprehensive transposable element epigenomic profiling. Mol Cell 80: 915–928.e5. 10.1016/j.molcel.2020.10.024
- ↵Fazzari MJ, Greally JM. 2004. Epigenomics: beyond CpG islands. Nat Rev Genet 5: 446–455. 10.1038/nrg1349
- ↵Feng H, Conneely KN, Wu H. 2014. A Bayesian hierarchical model to detect differentially methylated loci from single nucleotide resolution sequencing data. Nucleic Acids Res 42: e69. 10.1093/nar/gku154
- ↵Flusberg BA, Webster DR, Lee JH, Travers KJ, Olivares EC, Clark TA, Korlach J, Turner SW. 2010. Direct detection of DNA methylation during single-molecule, real-time sequencing. Nat Methods 7: 461–465. 10.1038/nmeth.1459
- ↵Gardner EJ, Lam VK, Harris DN, Chuang NT, Scott EC, Pittard WS, Mills RE, Consortium T 1000 GP, Devine SE. 2017. The mobile element locator tool (MELT): population-scale mobile element discovery and biology. Genome Res 27: 1916–1929. 10.1101/gr.218032.116
- ↵Gerdes P, Chan D, Lundberg M, Sanchez-Luque FJ, Bodea GO, Ewing AD, Faulkner GJ, Richardson SR. 2023. Locus-resolution analysis of L1 regulation and retrotransposition potential in mouse embryonic development. Genome Res 33: 1465–1481. 10.1101/gr.278003.123
- ↵Grandi FC, Rosser JM, Newkirk SJ, Yin J, Jiang X, Xing Z, Whitmore L, Bashir S, Ivics Z, Izsvák Z, 2015. Retrotransposition creates sloping shores: a graded influence of hypomethylated CpG islands on flanking CpG sites. Genome Res 25: 1135–1146. 10.1101/gr.185132.114
- ↵Groza C, Ge B, Cheung WA, Pastinen T, Bourque G. 2025. Expanded methylome and quantitative trait loci detection by long-read profiling of personal DNA. Genome Res 35: 644–652. 10.1101/gr.279240.124
- ↵Han L, Su B, Li W-H, Zhao Z. 2008. CpG island density and its correlations with genomic features in mammalian genomes. Genome Biol 9: R79. 10.1186/gb-2008-9-5-r79
- ↵Hodges E, Smith AD, Kendall J, Xuan Z, Ravi K, Rooks M, Zhang MQ, Ye K, Bhattacharjee A, Brizuela L, 2009. High definition profiling of mammalian DNA methylation by array capture and single molecule bisulfite sequencing. Genome Res 19: 1593–1605. 10.1101/gr.095190.109
- ↵Holt JM, Saunders CT, Rowell WJ, Kronenberg Z, Wenger AM, Eberle M. 2024. HiPhase: jointly phasing small, structural, and tandem repeat variants from HiFi sequencing. Bioinformatics 40: btae042. 10.1093/bioinformatics/btae042
- ↵Hubley R, Finn RD, Clements J, Eddy SR, Jones TA, Bao W, Smit AFA, Wheeler TJ. 2016. The Dfam database of repetitive DNA families. Nucleic Acids Res 44: D81–D89. 10.1093/nar/gkv1272
- ↵Jones PA. 2012. Functions of DNA methylation: islands, start sites, gene bodies and beyond. Nat Rev Genet 13: 484–492. 10.1038/nrg3230
- ↵Krueger F, Andrews SR. 2011. Bismark: a flexible aligner and methylation caller for bisulfite-seq applications. Bioinformatics 27: 1571–1572. 10.1093/bioinformatics/btr167
- ↵Lam ET, Hastie A, Lin C, Ehrlich D, Das SK, Austin MD, Deshpande P, Cao H, Nagarajan N, Xiao M, 2012. Genome mapping on nanochannel arrays for structural variation analysis and sequence assembly. Nat Biotechnol 30: 771–776. 10.1038/nbt.2303
- ↵Lanciano S, Philippe C, Sarkar A, Pratella D, Domrane C, Doucet AJ, van Essen D, Saccani S, Ferry L, Defossez P-A, 2024. Locus-level L1 DNA methylation profiling reveals the epigenetic and transcriptional interplay between L1s and their integration sites. Cell Genomics 4: 100498. 10.1016/j.xgen.2024.100498
- ↵Laurent L, Wong E, Li G, Huynh T, Tsirigos A, Ong CT, Low HM, Sung KWK, Rigoutsos I, Loring J, 2010. Dynamic changes in the human methylome during differentiation. Genome Res 20: 320–331. 10.1101/gr.101907.109
- ↵Lee HJ, Hou Y, Chen Y, Dailey ZZ, Riddihough A, Jang HS, Wang T, Johnson SL. 2020a. Regenerating zebrafish fin epigenome is characterized by stable lineage-specific DNA methylation and dynamic chromatin accessibility. Genome Biol 21: 52. 10.1186/s13059-020-1948-0
- ↵Lee Y, Lee J, Kim J, Kim Y-J. 2020b. Insertion variants missing in the human reference genome are widespread among human populations. BMC Biol 18: 167. 10.1186/s12915-020-00894-1
- ↵Li H. 2018. Minimap2: pairwise alignment for nucleotide sequences. Bioinformatics 34: 3094–3100. 10.1093/bioinformatics/bty191
- ↵Li H. 2021. New strategies to improve minimap2 alignment accuracy. Bioinformatics 37: 4572–4574. 10.1093/bioinformatics/btab705
- ↵Li D, Zhang B, Xing X, Wang T. 2015. Combining MeDIP-seq and MRE-seq to investigate genome-wide CpG methylation. Methods 72: 29–40. 10.1016/j.ymeth.2014.10.032
- ↵Li H, Bloom JM, Farjoun Y, Fleharty M, Gauthier L, Neale B, MacArthur D. 2018. A synthetic-diploid benchmark for accurate variant-calling evaluation. Nat Methods 15: 595–597. 10.1038/s41592-018-0054-7
- ↵Li D, Purushotham D, Harrison JK, Hsu S, Zhuo X, Fan C, Liu S, Xu V, Chen S, Xu J, 2022. WashU Epigenome Browser update 2022. Nucleic Acids Res 50: W774–W781. 10.1093/nar/gkac238
- ↵Li D, Zhuo X, Harrison JK, Liu S, Wang T. 2023. Modbed track: visualization of modified bases in single-molecule sequencing. Cell Genomics 3: 100455. 10.1016/j.xgen.2023.100455
- ↵Liao W-W, Asri M, Ebler J, Doerr D, Haukness M, Hickey G, Lu S, Lucas JK, Monlong J, Abel HJ, 2023. A draft human pangenome reference. Nature 617: 312–324. 10.1038/s41586-023-05896-x
- ↵Lister R, Pelizzola M, Dowen RH, Hawkins RD, Hon G, Tonti-Filippini J, Nery JR, Lee L, Ye Z, Ngo Q-M, 2009. Human DNA methylomes at base resolution show widespread epigenomic differences. Nature 462: 315–322. 10.1038/nature08514
- ↵Liu S, Li D, Lyu C, Gontarz PM, Miao B, Madden PAF, Wang T, Zhang B. 2021a. AIAP: a quality control and integrative analysis package to improve ATAC-seq data analysis. Genomics Proteomics Bioinformatics 19: 641–651. 10.1016/j.gpb.2020.06.025
- ↵Liu Y, Rosikiewicz W, Pan Z, Jillette N, Wang P, Taghbalout A, Foox J, Mason C, Carroll M, Cheng A, 2021b. DNA methylation-calling tools for Oxford Nanopore sequencing: a survey and human epigenome-wide evaluation. Genome Biol 22: 295. 10.1186/s13059-021-02510-z
- ↵Logsdon GA, Ebert P, Audano PA, Loftus M, Porubsky D, Ebler J, Yilmaz F, Hallast P, Prodanov T, Yoo D, 2025. Complex genetic variation in nearly complete human genomes. Nature 644: 430–441. 10.1038/s41586-025-09140-6
- ↵Maunakea AK, Nagarajan RP, Bilenky M, Ballinger TJ, D'Souza C, Fouse SD, Johnson BE, Hong C, Nielsen C, Zhao Y, 2010. Conserved role of intragenic DNA methylation in regulating alternative promoters. Nature 466: 253–257. 10.1038/nature09165
- ↵Meissner A, Mikkelsen TS, Gu H, Wernig M, Hanna J, Sivachenko A, Zhang X, Bernstein BE, Nusbaum C, Jaffe DB, 2008. Genome-scale DNA methylation maps of pluripotent and differentiated cells. Nature 454: 766–770. 10.1038/nature07107
- ↵Moore LD, Le T, Fan G. 2013. DNA methylation and its basic function. Neuropsychopharmacol 38: 23–38. 10.1038/npp.2012.112
- ↵Ni P, Nie F, Zhong Z, Xu J, Huang N, Zhang J, Zhao H, Zou Y, Huang Y, Li J, 2023. DNA 5-methylcytosine detection and methylation phasing using PacBio circular consensus sequencing. Nat Commun 14: 4054. 10.1038/s41467-023-39784-9
- ↵Nunn A, Otto C, Fasold M, Stadler PF, Langenberger D. 2022. Manipulating base quality scores enables variant calling from bisulfite sequencing alignments using conventional Bayesian approaches. BMC Genomics 23: 477. 10.1186/s12864-022-08691-6
- ↵Patterson M, Marschall T, Pisanti N, van Iersel L, Stougie L, Klau GW, Schönhuth A. 2015. WhatsHap: weighted haplotype assembly for future-generation sequencing reads. J Comput Biol 22: 498–509. 10.1089/cmb.2014.0157
- ↵Pehrsson EC, Choudhary MNK, Sundaram V, Wang T. 2019. The epigenomic landscape of transposable elements across normal human development and anatomy. Nat Commun 10: 5640. 10.1038/s41467-019-13555-x
- ↵Penzkofer T, Jäger M, Figlerowicz M, Badge R, Mundlos S, Robinson PN, Zemojtel T. 2017. L1Base 2: more retrotransposition-active LINE-1s, more mammalian genomes. Nucleic Acids Res 45: D68–D73. 10.1093/nar/gkw925
- ↵Pollard MO, Gurdasani D, Mentzer AJ, Porter T, Sandhu MS. 2018. Long reads: their purpose and place. Hum Mol Genet 27: R234–R241. 10.1093/hmg/ddy177
- ↵Quinlan AR, Hall IM. 2010. BEDTools: a flexible suite of utilities for comparing genomic features. Bioinformatics 26: 841–842. 10.1093/bioinformatics/btq033
- ↵Roadmap Epigenomics Consortium, Kundaje A, Meuleman W, Ernst J, Bilenky M, Yen A, Heravi-Moussavi A, Kheradpour P, Zhang Z, Wang J, 2015. Integrative analysis of 111 reference human epigenomes. Nature 518: 317–330. 10.1038/nature14248
- ↵Saha K, Nielsen GI, Nandani R, Zhang Y, Kong L, Ye P, An W. 2024. YY1 is a transcriptional activator of the mouse LINE-1 Tf subfamily. Nucleic Acids Res 52: 12878–12894. 10.1093/nar/gkae949
- ↵Sanchez-Luque FJ, Kempen M-JHC, Gerdes P, Vargas-Landin DB, Richardson SR, Troskie R-L, Jesuadian JS, Cheetham SW, Carreira PE, Salvador-Palomeque C, 2019. LINE-1 evasion of epigenetic repression in humans. Mol Cell 75: 590–604.e12. 10.1016/j.molcel.2019.05.024
- ↵Schatz MC. 2017. Nanopore sequencing meets epigenetics. Nat Methods 14: 347–348. 10.1038/nmeth.4240
- ↵Sentmanat MF, Elgin SCR. 2012. Ectopic assembly of heterochromatin in Drosophila melanogaster triggered by transposable elements. Proc Natl Acad Sci 109: 14104–14109. 10.1073/pnas.1207036109
- ↵Sigurpalsdottir BD, Stefansson OA, Holley G, Beyter D, Zink F, Hardarson MÞ, Sverrisson SÞ, Kristinsdottir N, Magnusdottir DN, Magnusson OÞ, 2024. A comparison of methods for detecting DNA methylation from long-read sequencing of human genomes. Genome Biol 25: 69. 10.1186/s13059-024-03207-9
- ↵Simpson JT, Workman RE, Zuzarte PC, David M, Dursi LJ, Timp W. 2017. Detecting DNA cytosine methylation using nanopore sequencing. Nat Methods 14: 407–410. 10.1038/nmeth.4184
- ↵Smallwood SA, Tomizawa S, Krueger F, Ruf N, Carli N, Segonds-Pichon A, Sato S, Hata K, Andrews SR, Kelsey G. 2011. Dynamic CpG island methylation landscape in oocytes and preimplantation embryos. Nat Genet 43: 811–814. 10.1038/ng.864
- ↵Smith ZD, Hetzel S, Meissner A. 2025. DNA methylation in mammalian development and disease. Nat Rev Genet 26: 7–30. 10.1038/s41576-024-00760-8
- ↵Stergachis AB, Debo BM, Haugen E, Churchman LS, Stamatoyannopoulos JA. 2020. Single-molecule regulatory architectures captured by chromatin fiber sequencing. Science 368: 1449–1454. 10.1126/science.aaz1646
- ↵Stevens M, Cheng JB, Li D, Xie M, Hong C, Maire CL, Ligon KL, Hirst M, Marra MA, Costello JF, 2013. Estimating absolute methylation levels at single-CpG resolution from methylation enrichment and restriction enzyme sequencing methods. Genome Res 23: 1541–1553. 10.1101/gr.152231.112
- ↵Sved J, Bird A. 1990. The expected equilibrium of the CpG dinucleotide in vertebrate genomes under a mutation model. Proc Natl Acad Sci 87: 4692–4696. 10.1073/pnas.87.12.4692
- ↵Tse OYO, Jiang P, Cheng SH, Peng W, Shang H, Wong J, Chan SL, Poon LCY, Leung TY, Chan KCA, 2021. Genome-wide detection of cytosine methylation by single molecule real-time sequencing. Proc Natl Acad Sci 118: e2019768118. 10.1073/pnas.2019768118
- ↵Turelli P, Castro-Díaz N, Marzetta F, Kapopoulou A, Raclot C, Duc J, Tieng V, Quenneville S, Trono D. 2014. Interplay of TRIM28 and DNA methylation in controlling human endogenous retroelements. Genome Res 24: 1260–1270. 10.1101/gr.172833.114
- ↵Turker MS. 1999. The establishment and maintenance of DNA methylation patterns in mouse somatic cells. Semin Cancer Biol 9: 329–337. 10.1006/scbi.1999.0133
- ↵Turker MS. 2002. Gene silencing in mammalian cells and the spread of DNA methylation. Oncogene 21: 5388–5393. 10.1038/sj.onc.1205599
- ↵Vaisvila R, Ponnaluri VKC, Sun Z, Langhorst BW, Saleh L, Guan S, Dai N, Campbell MA, Sexton BS, Marks K, 2021. Enzymatic methyl sequencing detects DNA methylation at single-base resolution from picograms of DNA. Genome Res 31: 1280–1289. 10.1101/gr.266551.120
- ↵van Dijk EL, Jaszczyszyn Y, Naquin D, Thermes C. 2018. The third revolution in sequencing technology. Trends Genet 34: 666–681. 10.1016/j.tig.2018.05.008
- ↵Weber M, Davies JJ, Wittig D, Oakeley EJ, Haase M, Lam WL, Schübeler D. 2005. Chromosome-wide and promoter-specific analyses identify sites of differential DNA methylation in normal and transformed human cells. Nat Genet 37: 853–862. 10.1038/ng1598
- ↵Wheeler TJ, Clements J, Eddy SR, Hubley R, Jones TA, Jurka J, Smit AFA, Finn RD. 2012. Dfam: a database of repetitive DNA based on profile hidden Markov models. Nucleic Acids Res 41: D70–D82. 10.1093/nar/gks1265
- ↵Wickham H. 2009. ggplot2. Springer, New York.
- ↵Wu H, Xu T, Feng H, Chen L, Li B, Yao B, Qin Z, Jin P, Conneely KN. 2015. Detection of differentially methylated regions from whole-genome bisulfite sequencing data without replicates. Nucleic Acids Res 43: gkv715. 10.1093/nar/gkv715
- ↵Wyler M, Stritt C, Walser J-C, Baroux C, Roulin AC. 2020. Impact of transposable elements on methylation and gene expression across natural accessions of Brachypodium distachyon. Genome Biol Evol 12: 1994–2001. 10.1093/gbe/evaa180
- ↵Xie M, Hong C, Zhang B, Lowdon RF, Xing X, Li D, Zhou X, Lee HJ, Maire CL, Ligon KL, 2013. DNA hypomethylation within specific transposable element families associates with tissue-specific enhancer landscape. Nat Genet 45: 836–841. 10.1038/ng.2649
- ↵Xu L, Seki M. 2020. Recent advances in the detection of base modifications using the nanopore sequencer. J Hum Genet 65: 25–33. 10.1038/s10038-019-0679-0
- ↵Zhang Y, Shu J, Si J, Shen L, Estecio MRH, Issa J-PJ. 2012. Repetitive elements and enforced transcriptional repression co-operate to enhance DNA methylation spreading into a promoter CpG-island. Nucleic Acids Res 40: 7257–7268. 10.1093/nar/gks429
- ↵Zhang B, Zhou Y, Lin N, Lowdon RF, Hong C, Nagarajan RP, Cheng JB, Li D, Stevens M, Lee HJ, 2013. Functional DNA methylation differences between tissues, cell types, and across individuals discovered using the M&M algorithm. Genome Res 23: 1522–1540. 10.1101/gr.156539.113
- ↵Zhou X, Li D, Lowdon RF, Costello JF, Wang T. 2014. methylC track: visual integration of single-base resolution DNA methylation data on the WashU EpiGenome browser. Bioinformatics 30: 2206–2207. 10.1093/bioinformatics/btu191
- ↵Zhou W, Liang G, Molloy PL, Jones PA. 2020. DNA methylation enables transposable element-driven genome expansion. Proc Natl Acad Sci 117: 19359–19366. 10.1073/pnas.1921719117
- ↵Zhou W, Mumm C, Gan Y, Switzenberg JA, Wang J, Oliveira PD, Kathuria K, Losh SJ, McDonald TL, Bessell B, 2024. A personalized multi-platform assessment of somatic mosaicism in the human frontal cortex. bioRxiv 10.1101/2024.12.18.629274
- ↵Zhuo X, Hsu S, Purushotham D, Kuntala PK, Harrison JK, Du AY, Chen S, Li D, Wang T. 2023. Comparing genomic and epigenomic features across species using the WashU comparative epigenome browser. Genome Res 33: 824–835. 10.1101/gr.277550.122