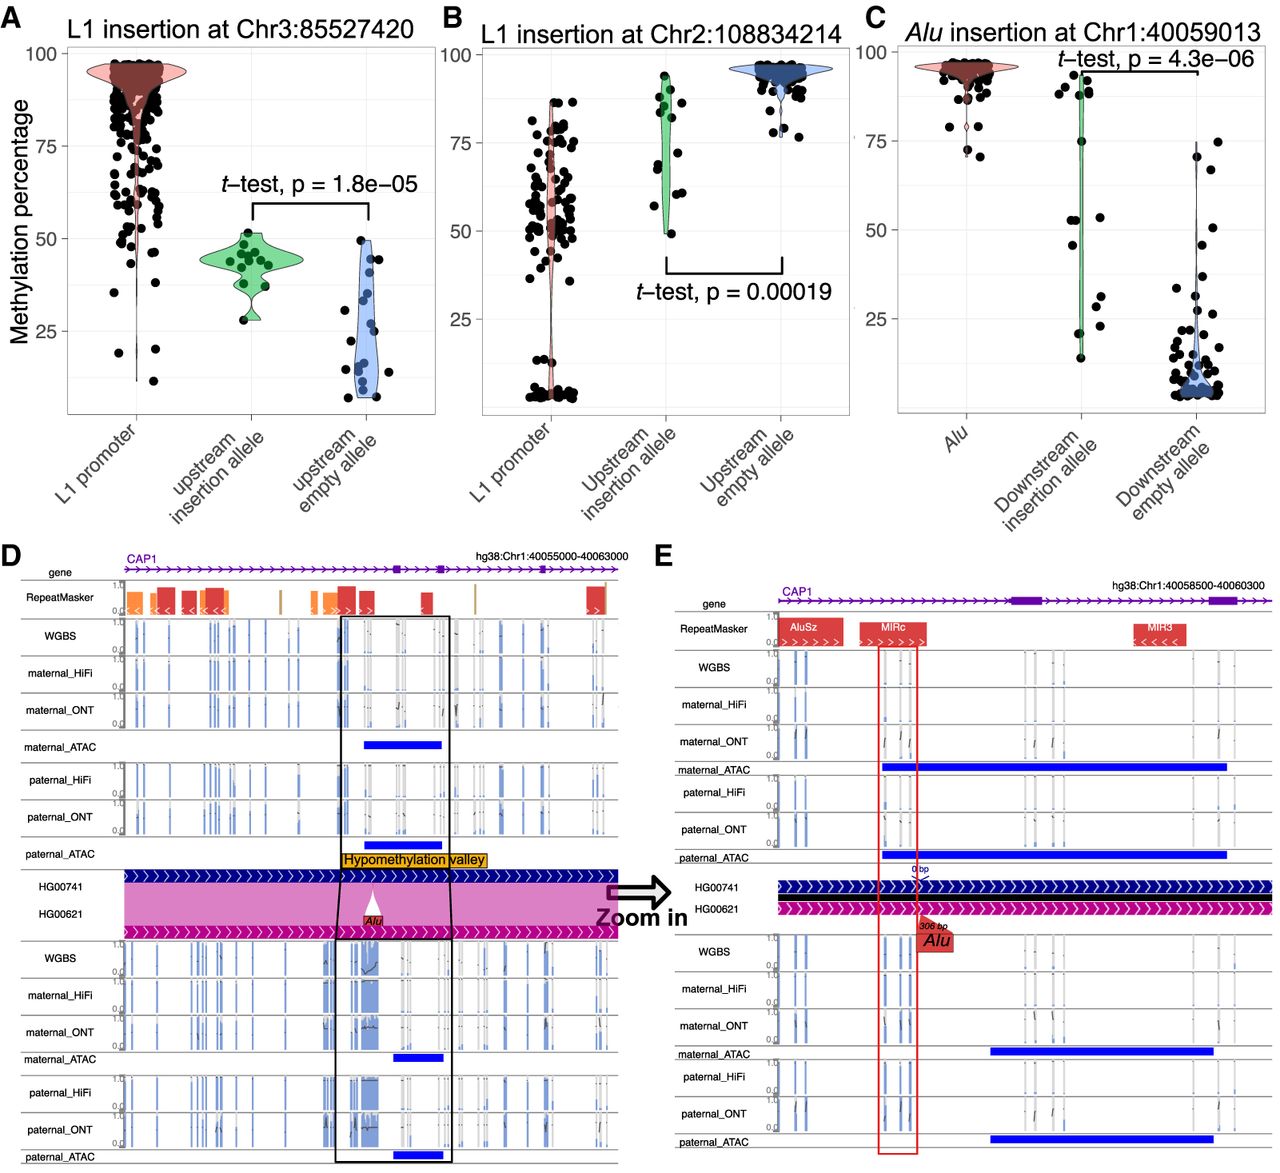
Several examples of TE insertion have been observed to alter the methylation levels of their neighboring regions. (A) The violin plot illustrated the methylation levels of the L1 promoter at Chr 3: 85,527,420. It compared the upstream CpG methylation of the insertion allele and the empty allele. Each dot represented the methylation percentage of a specific CpG site in a particular sample. A t-test was conducted to compare the matching upstream methylation levels, and the P-value is indicated on the figure. (B) The violin plot of L1 promoter methylation at Chr 2: 108,834,214 is similar to A. The upstream CpG methylation of the insertion allele and the upstream methylation of the empty allele were shown. Each dot represented the methylation percentage of a specific CpG site in a particular sample. A t-test was performed and labeled accordingly. (C) The violin plot of Alu methylation at Chr 1: 40,059,013 is similar to A. The downstream CpG methylation of insertion allele and the downstream methylation of empty allele were shown. Each dot represented the methylation percentage of a specific CpG site in a particular sample. A t-test was performed and labeled accordingly. (D) The WashU Epigenome Browser view of a hypermethylated Alu insertion within a hypomethylated valley that was present in HG00621 but absent in HG00741 characterized by WGBS, HiFi, and ONT methylation. All the methylC tracks displayed methylation percentages ranging from 0% to 100%; open chromatin peaks derived from ATAC-seq were shown as blue boxes. (E) Zoom-in view of the methylation of the same Alu element from D. The boxed three CpG sites within 200 bp of the insertion site underwent a change in methylation status, transitioning from hypomethylation to hypermethylation in association with the Alu insertion.