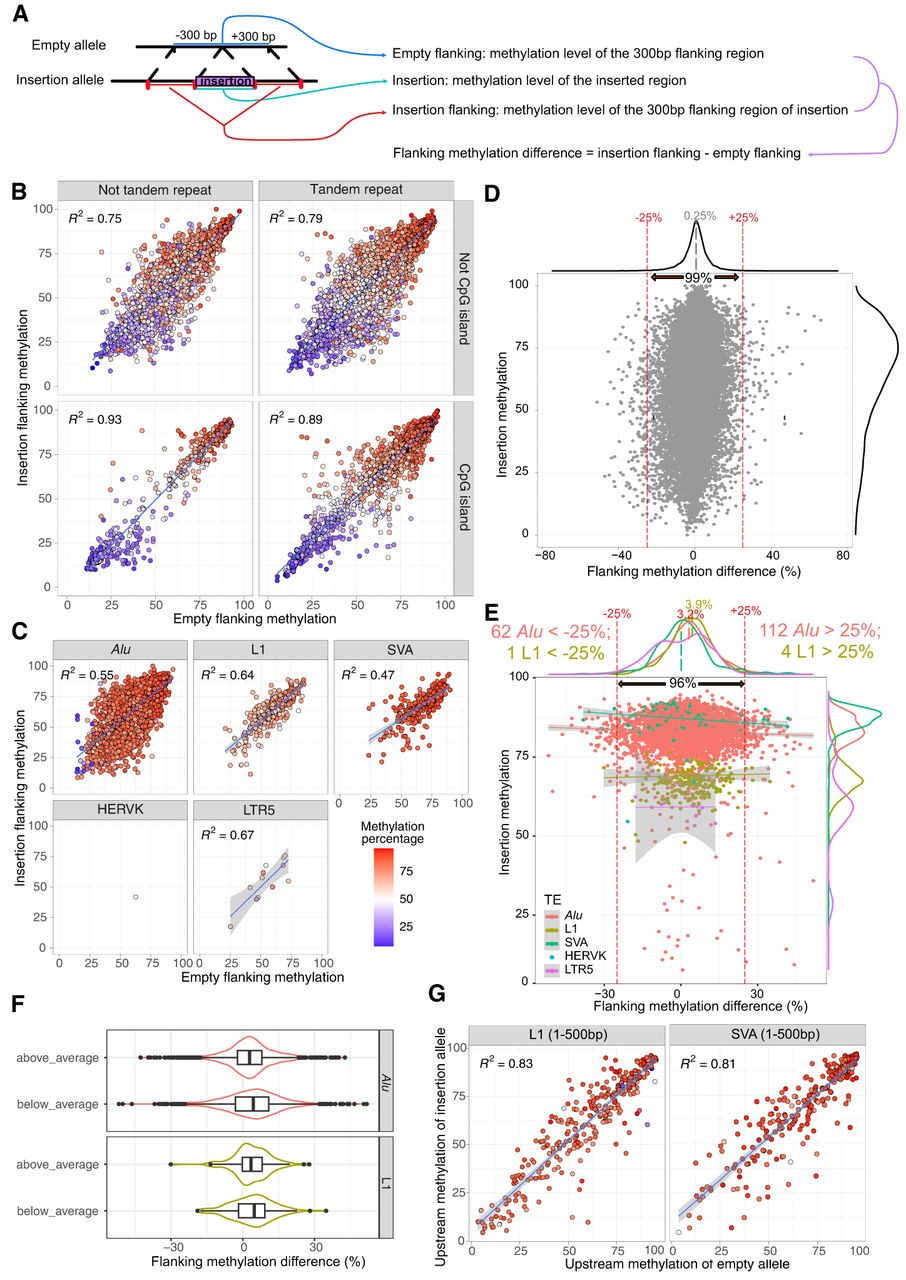
Most of the newly inserted TEs did not alter the methylation pattern of their surrounding genomic context. (A) Schematic representation of a polymorphic insertion with aligned long reads. The allele without the insertion site (top) and the allele with the insertion site (bottom) were represented as reference allele and insertion allele. The average methylation level of the insertion, insertion flanking regions, and empty flanking regions were calculated from reads from all 32 samples. We then calculated flanking methylation difference by subtracting the methylation level of empty flanking region from that of insertion flanking region. (B) Methylation level of empty flanking (x-axis), insertion flanking (y-axis), and non-TE inserted regions (blue–red color scale as shown in C). Insertions were separated into four facets by whether they are tandem repeats and whether they are CpG islands. Linear regression R2-values were shown on each panel. (C) Similar to B, but the methylation level of different TE insertions was presented and separated by the TE insertion types. R2 were displayed in the top left corner on each panel. (D) Dot plot illustrated the relationship between methylation level of insertion (y-axis) and methylation difference between empty and insertion alleles of the flanking regions (x-axis). The average methylation difference of all non-TE insertions was labeled at 0.25%. Red dotted lines indicated the methylation difference threshold of ±25%, and 99% of non-TE insertions fall within this range. The insertion methylation density was displayed on the right side of the figure. (E) TE insertion flanking methylation differences plotted in the sample way as in D. Different TE insertions were distinguished by different colors. The percentage of all insertions within 25% differences, and the average flanking methylation differences of different TEs were labeled. The insertion methylation density was shown on the right of the figure. The average methylation of each TE class was labeled with the same color scheme. (F) Alu and L1 insertion flanking methylation differences are not higher when the TEs were hypermethylated. We separated all Alu and L1 insertions to above average and below average based on the average TE methylation. The flanking methylation differences are plotted as a violin plot. The flanking methylation differences distribution is similar in all groups, and each of them has a wide range. (G) Methylation level of 300 bp upstream of the empty allele (x-axis), 300 bp upstream of the insertion allele (y-axis), and the first 500 bp inserted methylation (blue–red color scale) of L1 and SVA insertions displayed similar to B and C.