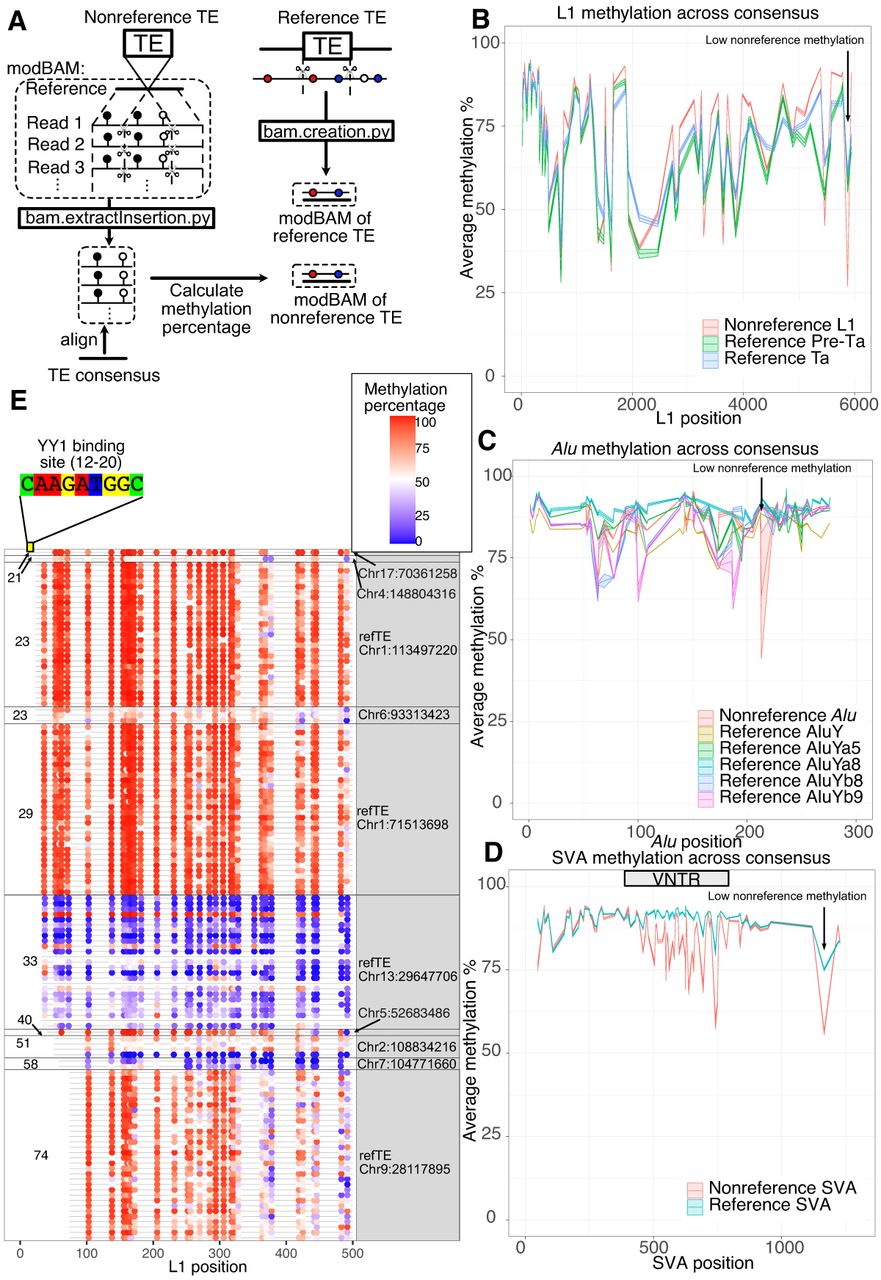
The methylation profile of different transposable elements (TEs) in the human genome. (A) Schematic representation of our pipeline to extract reference and nonreference insertions along with their methylation annotation. We developed a script (bam.extractInsertion.py) to extract truncated DNA sequences from reads while retaining positional methylation tags (subseq modBAM file). We then aligned this modBAM to the corresponding TE consensus and calculated the methylation profile of the TE insertion. We also extracted sequences from the reference genome and the methylation percentage from the bedMethyl file to create another modBAM file of reference TEs and their methylation (bam.creation.py). The methylation would be anchored to the TE consensus after alignment. (B) Methylation profile of L1 insertions. The x-axis represents positions on the L1Hs consensus, and the y-axis represents the methylation percentage with 95% standard error of the mean illustrated as shaded areas. Reference L1pre-Ta, reference L1Ta, and nonreference L1 insertions are labeled with different colors. Only full-length elements (truncation <50 bp on both ends) are included for profiling. (C) Methylation profile of Alu insertions with 95% standard error of mean. The x-axis represents positions on the AluY consensus, and the y-axis represents the methylation percentage. AluY, AluYa5, AluYa8, AluYb8, and AluYb9 on the reference and nonreference Alu insertions are labeled with different colors. (D) Methylation profile of SVA insertions with 95% standard error of mean. The x-axis represents positions on the SVA_F consensus, and the y-axis represents the methylation percentage. Reference SVA and nonreference SVA insertions are labeled with different colors. The VNTR of SVA consensus are labeled on the graph with a gray box. (E) The first 500 bp methylation of L1 insertions whose first 20–50 bp was truncated. The start position is labeled on the left, and the insertion coordinates on GRCh38 are labeled on the right. The “refTE” indicates it was an L1 insertion on the GRCh38 reference. Each row represents one of the 32 samples. The methylation percentage of each CpG site is illustrated by the blue–red (low to high) color scale.