

Abstract
A tightly regulated DNA damage response is critical to the overall integrity of the genome. Here, we combine transcriptomics and proteomics to study DNA damage response kinetics across well-established treatments in the ciliate Tetrahymena thermophila. This extensive data set containing six conditions (HU, MMS, IR, HP, cisplatin, and UV) and seven time points (from 0 to 8 h) integrates over 250 paired transcriptome and proteome measurements. We observe upregulation of known DNA repair proteins as well as a global dynamic response of not yet characterized transcripts and proteins. Using artificial neural networks, we classify different expression trends in response to the damaging agents. These networks reveal both a core and specific global dynamic response to the different genotoxic stressors, highlighting unexpected pathway crosstalk. In addition to the comprehensive analysis presented here, the data can be explored via an accessible user interface. Ultimately, our study provides novel insights into the DNA damage response kinetics in Tetrahymena.
Environmental genotoxic stressors induce DNA damage, posing a threat to genome stability and integrity. Therefore, maintaining a carefully regulated orchestra of DNA damage response factors and pathways is critical (Ciccia and Elledge 2010). DNA repair activity is essential in all living organisms, and the dysregulation of any repair pathway has been correlated with disease (Jackson and Bartek 2009; Kovalchuk 2016).
The DNA damage response (DDR) identifies and subsequently repairs damaged DNA (Ciccia and Elledge 2010; Molinaro et al. 2021). Primary DNA repair pathways include nucleotide excision repair (NER), base excision repair (BER), mismatch repair (MMR), homologous recombination (HR), nonhomologous end joining (NHEJ), and interstrand crosslink repair (ICL) (Deans and West 2011; Chapman et al. 2012; Schärer 2013; Li et al. 2016; Beard et al. 2019).
Exogenous mutagens can induce damage lesions that associate with specific repair pathways. Ultraviolet light (UV) exposure causes pyrimidine (6-4) pyrimidone photoproducts ([6-4]PPs) and cis-syn cyclobutane pyrimidine dimers (Spivak 2015), repaired by NER. Cisplatin (CPT) induces covalent bonds between base pairs on different DNA strands referred to as interstrand crosslinks (ICLs) (Huang et al. 1995). This damage is often repaired by NER; however, there is a cell cycle-dependent compilation of various repair pathways to address this damage, including HR, NER, translesion synthesis (TLS), and the Fanconi Anemia (FA) pathway (Deans and West 2011; Duan et al. 2020). Hydrogen peroxide (HP) and methyl methanesulfonate (MMS) cause oxidative and alkylative damage, respectively (Ransy et al. 2020). Whereas it was previously thought these damages were primarily repaired by BER, growing evidence underscores the interdependence of both BER and NER (Fayyad et al. 2020; Kumar et al. 2022). Ionizing radiation (IR) induces direct DSBs, repaired by either HR or NHEJ (Chapman et al. 2012). Additionally, IR generates reactive oxygen species, repaired by BER and NER. Hydroxyurea (HU) indirectly impacts DNA through inhibition of the enzyme ribonucleotide reductase (RR), reducing the available deoxynucleotide triphosphate pools, ultimately causing widespread replication stress (Agrawal et al. 2014).
Although each damaging agent specifically induces known DNA damage repair pathways, a broad and temporal DNA damage response occurs in cells. Thus, to evaluate this response in a global manner, comprehensive DDR studies utilizing omics methods are essential. Here, we studied DNA damage repair kinetics from a global transcriptomic and proteomic perspective in the ciliate Tetrahymena thermophila (Tetrahymena) (Orias et al. 2011; Ruehle et al. 2016). Tetrahymena possesses a unique nuclear architecture containing a transcriptionally active macronucleus (MAC), and a transcriptionally silent micronucleus (MIC). During sexual reproduction, the new MAC chromosomes undergo ∼200 regulated double-stranded DNA breaks and endoreplication, resulting in ∼90 copies of ∼180 chromosomes (Loidl 2021; Zhou et al. 2022). These fascinating characteristics have led to remarkable observations, which have been translated to critical discoveries of cellular functions in humans.
To obtain a systematic comparative overview of the kinetics of the DNA damage repair in Tetrahymena, we performed transcriptome and proteome measurements over 8 h, with six well-established genotoxic treatments, each invoking different DNA damage repair pathways. To support the exploration of this data, we have developed an easy to use application (https://butterlab.imb-mainz.de/TtDDR/).
Results
Known DNA damage repair factors are differentially regulated in response to genotoxic stressors
To study DNA damage response kinetics, we exposed Tetrahymena thermophila to six well-established DNA damaging agents: 254-nm ultraviolet light (UV), cis-diamineplatinum (II) dichloride (CPT), hydrogen peroxide (HP), methyl methanesulfonate (MMS), ionizing radiation (IR), and hydroxyurea (HU). Treatment conditions were determined either by establishment of EC50 or based on previous DNA damage studies of Tetrahymena (Supplemental Table S1; Campbell and Romero 1998; Loidl and Mochizuki 2009; Sandoval et al. 2015). To obtain transcriptome and proteome expression profiles, we harvested samples at 0, 1, 2, 3, 4, 6, and 8 h after treatment (0 h–8 h) in quadruplicate and performed mRNA sequencing (RNA-seq) and high-resolution quantitative mass spectrometry (MS) measurement (Fig. 1A). Transcriptomes and proteomes were measured in sets of three, with two treatments paired with a nontreated control. With this, we could calculate changes in transcript expression and protein intensity in each drug treatment condition over a matched control, thereby correcting for any potential batch effect (log2 fold change values, Supplemental Fig. S1). After stringent filtering across treatments and time points, 20,443 transcripts and 6551 protein groups were quantified, with 99.6% of proteins associated with transcriptome data (Fig. 1B).
Screen to explore kinetics of DNA damage response in Tetrahymena. (A) Schematic of the screen workflow. Cells were treated with a mutagenic agent, and samples were harvested incrementally over 8 h. At each time point, samples were collected for processing for both RNA sequencing and quantitative mass spectrometry. (B) Venn diagram depicting the overlap between the identified transcripts and proteins. (C) Bar graph of enriched (full color) and detected (transparent color) DNA damage repair factors, where enriched proteins have L2FC > 1 or transcripts have L2FC > 2. Detected proteins or transcripts are present and found in the respective data sets, but not enriched. (D) Heat map of hierarchical clustering of DNA repair genes of interest. Light blue box highlighting the group of core damage response transcripts. NER: nucleotide excision repair, ICL: inter crosslink repair, BER: base excision repair, DSBR: double-strand break repair, MMR: mismatch repair, DDR: DNA damage response, UV: ultraviolet light, CPT: cisplatin, HP: hydrogen peroxide, MMS: methyl methanesulfonate, IR: ionizing radiation, HU: hydroxyurea.
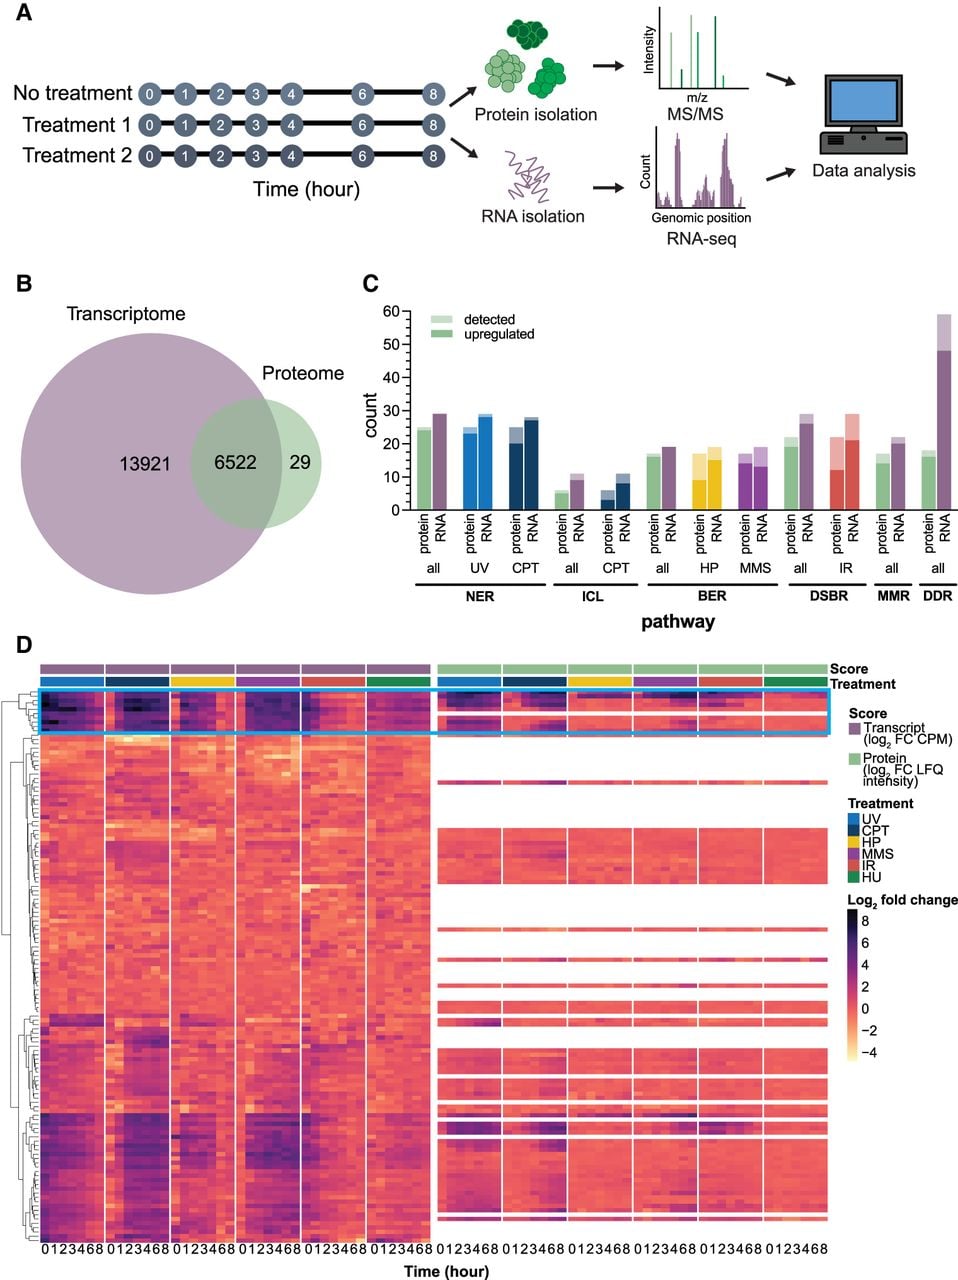
To confirm that each treatment induced the anticipated DNA damage, we examined the differential upregulation of primary DNA repair factors of NER (Tatum and Li 2011; Schärer 2013), BER (Kelley et al. 2003; Beard et al. 2019), MMR (Bowen et al. 2013; Kunkel and Erie 2015; Chakraborty and Alani 2016), DSBR (Li and Heyer 2008; Mathiasen and Lisby 2014; Pannunzio et al. 2018; Scully et al. 2019), ICL (Lehoczký et al. 2007), and general DDR (Ciccia and Elledge 2010; Pizzul et al. 2022). Our list of these factors, containing 173 DNA repair genes, is not intended to be comprehensive but highlights established key genes in the different DNA repair pathways as well as non-pathway-specific overall DNA damage response (Supplemental Table S2). Across all treatments, between 81.4% and 100% of detected pathway-associated transcripts (fold change (FC) > 2) and between 82.4% and 96% of detected pathway-associated proteins were upregulated (FC > 1). In the transcriptome and proteome data set, 81.4% and 88.9% of the detected global, non-pathway-specific, DNA damage response transcripts and proteins were upregulated, respectively. For each treatment, we examined the amount of upregulated transcripts and proteins with its commonly described DNA repair pathway. Across all treatments, between 68.4% and 96.6% of the transcripts and between 33.3% and 92% of the proteins associated with the respective pathway were upregulated (Fig. 1C).
Selected members of the primary DNA repair pathways were further examined for each treatment over time (Fig. 1D). Hierarchical clustering revealed a group of 10 transcripts (MSH6L3, RAD51, RAD4, SNML1, RAD5, RLP1, RAD5L4, RFA1, TTHERM_00316410 [Rad3 homolog], and TTHERM_00391570 [Rev3 homolog]) with a minimum 2.3 log2 fold change across all treatments (blue box, Fig. 1D). This indicated an unexpected core DNA damage response that involves parts of MMR, DSBR, and NER, as well as expected general responders, regardless of damage origin.
Genotoxic stressors induce core and specific dynamic gene expression responses
We examined expression dynamics of both the transcriptome and proteome over time by calculating the Gini coefficient, a measurement of inequality, for every quantified transcript and protein (Fig. 2).
Mutagenic treatments cause global dynamic response. (A) Volcano plots plotting dynamic transcripts for each treatment. The x-axis contains the maximal positive or negative fold change during the duration of the time course, and the y-axis contains a Gini score evaluating the dynamicity throughout the entire time course. (B) Example line plots of the expression profiles dynamic (MSH6L3 and RAD51) and stable transcripts (TTLL6B). (C) Upset plots of overlapping dynamic transcripts between treatments. (D) Volcano plots plotting dynamic proteins for each treatment. The x-axis contains the maximal positive or negative fold change during the duration of the time course, and the y-axis contains a Gini score evaluating the dynamicity throughout the entire time course. (E) Line plots of the expression profiles dynamic (MSH6L3 and RAD51) and stable proteins (BTU1). (F) Upset plots of overlapping dynamic proteins between treatments.
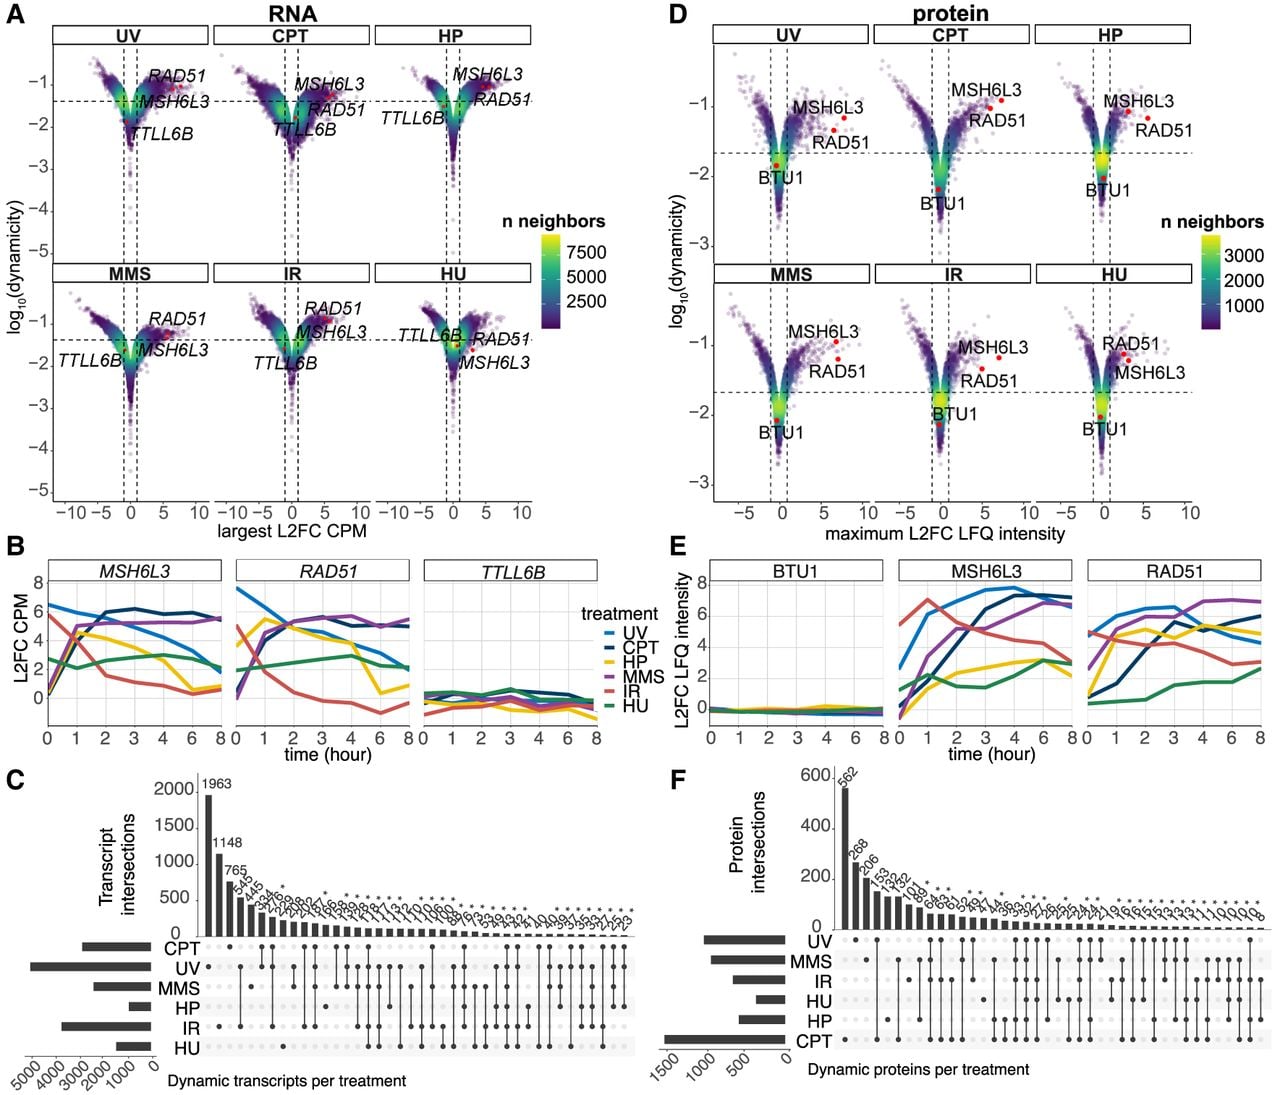
To categorize dynamic and stable transcripts, we applied a filter at the 60th quantile of the calculated Gini coefficients (Gini score > 0.042) (Fig. 2A). In addition to this dynamicity filter, to select transcripts generally differentially regulated in response to the DNA damaging agents, we filtered based on log2 fold change (L2FC), requiring the expression change over the time course to reach a magnitude of at least 1 L2FC, and a significance of adjusted P-value < 0.05 (FDR). Surpassing these thresholds, of the overall 20,443 detected transcripts, we classified 8815 as dynamic. Among them were the previously characterized DSBR gene RAD51 and the MSH6 homolog, MSH6L3 (Campbell and Romero 1998; Marsh et al. 2000, 2001), whereas, for example, TTLL6B, a tubulin-related ligase, was found to be a stable transcript (Fig. 2B).
There were 57 overlaps of shared dynamic transcripts among treatments, of which 42 were significantly more than expected (P-value ≤ 0.04, Fisher's exact test). The seven groups which contained overlaps of dynamic transcripts in five or more treatments were significant (P-value < 0.001) (Fig. 2C; Supplemental Tables S3, S4). Of the 78 transcripts in these overlaps, 39 had no S. cerevisiae homolog. This indicates both a strongly conserved and unique DNA damage response in Tetrahymena. Among these transcripts with no yeast homolog were three PARP and PARP-correlated genes, PCP3 (PARP12, TTHERM_00467770), PARP3 (TTHERM_00030430), and PCP5 (PZN1, TTHERM_00773650). Of the 15 PARP and PARP-correlated genes, 12 members were dynamic in one or more treatments. Whereas PCP3, PARP3, and PCP5 act as core responders, there are also damage-specific PARP responses. For example, PARP1, PARP7, and PCP1 have a dynamic expression profile only in response to UV. Previously, biologically specific PARP responses have also been observed in the interface between RNA interference pathways and DNA repair (Lee et al. 2021), indicating there is a conserved and unique DNA damage response both globally and within protein families.
We performed the same analysis with the 6551 proteins quantified across these six treatments. Here, the Gini coefficient threshold for dynamicity was also set at the 60th quantile (Gini score > 0.021 with a minimum L2FC > |1|, and P-value < 0.05 [Welch t-test]) (Fig. 2D). We found a total of 2582 proteins to be dynamically regulated. RAD51 and MSH6L3 were dynamic in each treatment (Fig. 2E). Of the 57 overlapping groups of dynamically upregulated proteins, there was significantly more overlap than expected in 38 groups (P ≤ 0.05, Fisher's exact test) (Fig. 2F; Supplemental Tables S5, S6). There were 33 dynamic proteins that were present in overlaps containing five or more treatments. Of these 33 core responders, 15 of these proteins have no homolog in S. cerevisiae. The dynamic proteins across all treatments had overrepresentation of the GO terms “DNA repair” and “cellular response to damage.” Thus, as with the dynamic transcripts, both a global and damage-specific protein response was observed.
Early transcriptional activity is critical to the DNA damage response
To cluster the 8815 dynamic and differentially regulated transcripts, we used self-organizing maps (SOMs), an unsupervised machine learning approach. The transcripts detected across all six treatments fell into 15 distinct clusters (T1–T15); 689 transcripts could not be assigned to any cluster (Fig. 3; Supplemental Fig. S2A). Each cluster exhibits unique temporal and intensity of response. Clusters T1–T6 have the highest fold change at either 0 h or 1 h, followed predominantly by downregulation throughout 2 h to 8 h (Fig. 3A). These clusters represent early responders in all treatments that are progressively downregulated as repair progresses. Conversely, clusters T8, T10, T12, T13, and T14 show the most pronounced differential regulation CPT-treated cells, underscoring a treatment-specific response. Next, each transcript was mapped to its respective homolog(s) in S. cerevisiae, and functional enrichment analysis was performed using Gene Ontology (GO) of the S. cerevisiae homologs in each cluster (Fig. 3B,C).
Transcript clusters reveal dynamic DNA damage response. (A) Average expression profiles for clusters of dynamic transcripts. Using an unsupervised machine learning technique, we clustered dynamic transcripts based on their shared expression profiles into 15 different clusters. These line graphs are the average expression profiles for each treatment. (B) Heat map of functional enrichment analysis using KEGG. Each row contains an over-represented KEGG term with a gradient representing the adjusted P-value. (C) Heat map of functional enrichment analysis using GO analysis. Each gene was mapped to its respective homolog(s) in S. cerevisiae. Each row contains an overrepresented GO term with a gradient representing the adjusted P-value.
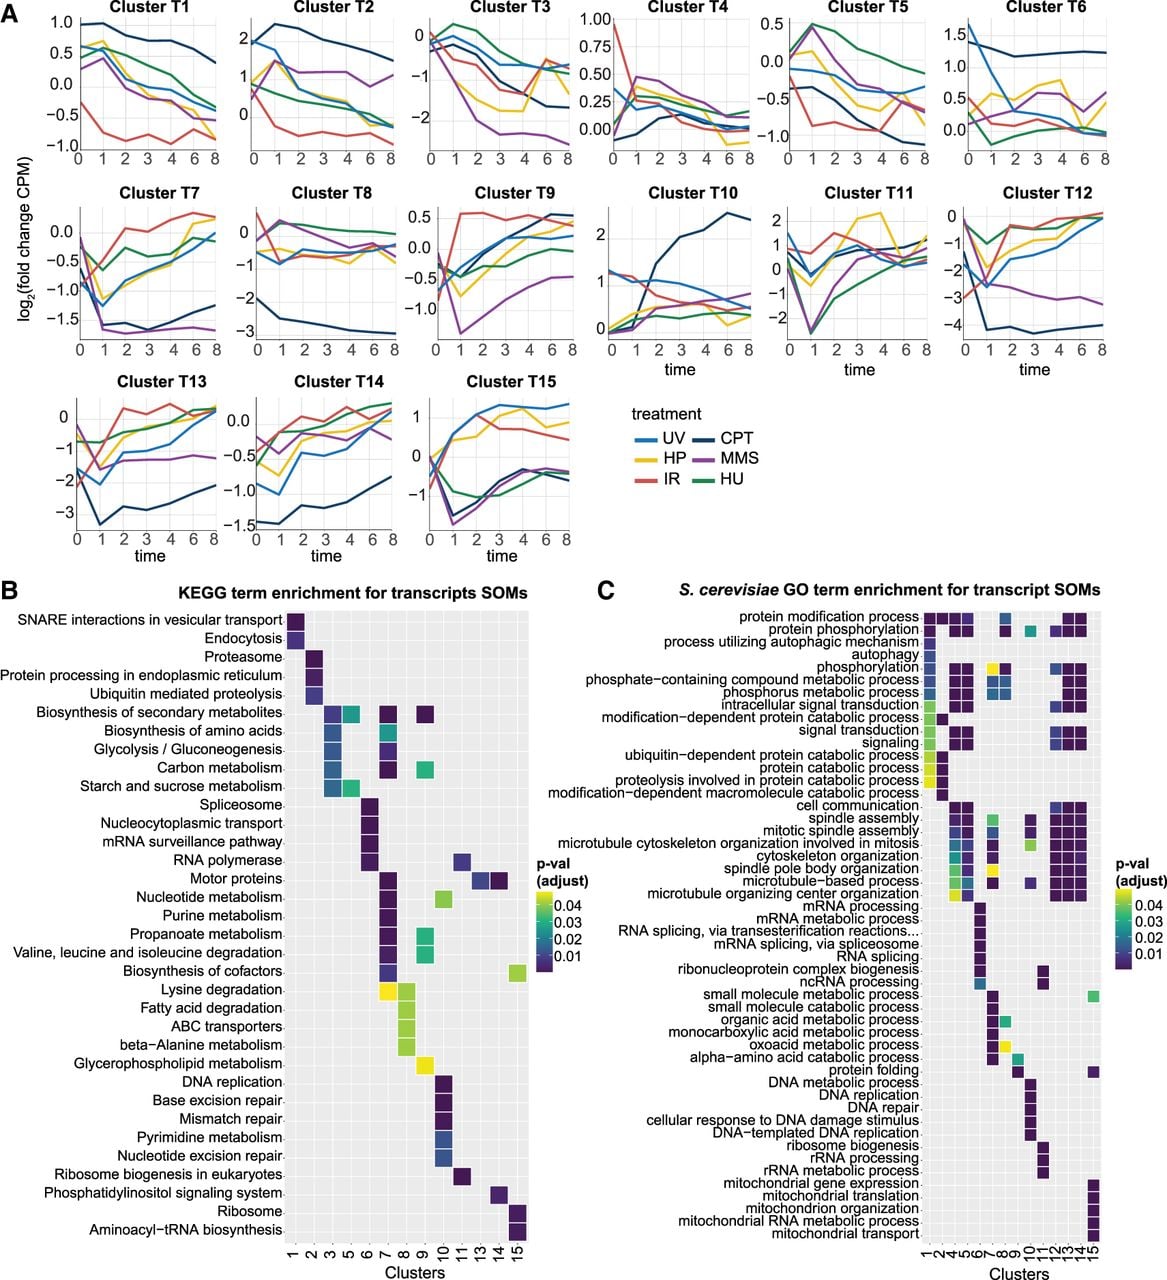
Cluster T10 uniquely showed overrepresentation of genes related to “DNA repair,” “cellular response to DNA damage stimulus,” “DNA replication,” and “DNA metabolic process.” Within the average expression profile for CPT-treated cells in this cluster, there is an immediate strong and continual upregulation until 8 h. This response could be due to the known long half-life of CPT (Evans et al. 1982). At 0 h, the average expression profile of IR- and UV-treated cells shows strong upregulation, followed by gradual downregulation throughout the remaining time points. This also reflects these specific treatments, as both UV and IR treatments had only one initial application and were not sustained during the time course, whereas the average fold change of HP-, MMS-, and HU-treated cells decreases over time. All clustered DDR genes are included in Supplemental Figure S3. Within the 15 clusters, nine clusters are enriched for “protein phosphorylation” (T1, T2, T4, T5, T8, T10, T12–T14). The phosphorylation of DNA repair proteins has been well established to regulate all major repair pathways (Lanz et al. 2019; Huang and Zhou 2020). Overall, our data suggest that protein phosphorylation is critical to immediate and sustained DNA damage response as a whole in Tetrahymena.
Further general responses to DNA damage were found also in the other clusters. All histones (T7), 20S ribosomal proteins (T2), and dense core granules (T3) clustered together and showed primarily similar regulation trends for each treatment (Supplemental Fig. S4A–C). The degree and time point of decline depended on the actual treatment, but each gene family or complex subunits behaved similarly within each treatment. In contrast, the three families of previously studied chromatin remodelers in Tetrahymena—the Poly-(ADP-ribose) polymerases (PARPs)/PARP-associated proteins, histone acetyl transferases (HATs), and histone deacetylases (HDACs)—are differentially regulated and span across multiple clusters (Supplemental Fig. S4D,E; Slade et al. 2011; Chalker et al. 2013; Ashraf et al. 2019; Saettone et al. 2019; Wahab et al. 2020). The PARP and PARP-correlated proteins mediate DNA repair by chromatin modifications via ADP-ribosylation, as well as direct binding, modification, and recruitment of DNA repair proteins (Sousa et al. 2012; Morales et al. 2014). PARP7, PARP8, and PCP3 (T2), PCP1 (T7), PARP6 (T9), and PARP2 and PARP5 (T10) all showed unique responses to DNA damage (Supplemental Fig. S4D). The histone acetylases and deacetylases are critical to changing chromatin architecture to facilitate DNA repair (Wahab et al. 2020). The histone acetylases (HATs) HAT1 (T10) and MYST2 (T2) and histone deacetylases THD4, THD17, and THD18a (T2, T3, T6, respectively) also showed greatly differential regulation (Supplemental Fig. S4E). This indicates that each of the PARPs, HATs, and HDACs in Tetrahymena has a particular role. Together, the transcriptome data show specific transcriptional regulation kinetics of the DNA damage response dependent on the genotoxic stressor.
Protein expression over time reveals specific trends involved in DDR
As for the transcriptome, we used self-organizing maps clustering 2582 dynamically expressed proteins into seven distinct clusters (P1–P7); 202 proteins could not be assigned (Fig. 4A; Supplemental Fig. S2B). Each protein included in these seven clusters was mapped to its respective homolog(s) in S. cerevisiae, and functional enrichment analysis was performed using GO (Fig. 4B,C). Cluster P6 uniquely showed overrepresentation of genes related to “DNA repair,” “cellular response to DNA damage stimulus,” “DNA replication,” and “DNA metabolic process.” In P6, there were 15 known DNA damage factors, which included ATR1, RAD53/Chk1, TKU80, RAD3, DNA2, and three members of the RFC complex. ATR1 and TKU80 are critical in both DNA damage response and conjugation in Tetrahymena (Loidl and Mochizuki 2009; Lin et al. 2012). Additionally, in this cluster, two MMR proteins were identified, MSH3L6 and TMLH1. Together with MSH2, MSH3 is part of the MMR MutSβ complex, which repairs larger insertions and deletions. Alternatively, if MSH6 and MSH2 form an MMR recognition heterodimer MutSɑ, one to two base pair mismatches and indels are repaired. MSH6 is found in P3, indicating a differential regulation of these portions of the MMR recognition complex. TMHL1 and PMS2 interact with the recognition complex to initiate cleavage events. Our clustered data suggest that TMLH1 expression profiles are more comparable to MSH3 rather than MSH6. All clustered DDR proteins are included in Supplemental Figure S5.
Protein clusters reveal a specific and dynamic DNA damage response. (A) Average expression profiles for clusters of dynamic proteins. Using an unsupervised machine learning technique, we clustered dynamic transcripts based on their shared expression profiles into seven different clusters. These line graphs are the average expression profiles for each treatment. (B) Heat map of functional enrichment analysis using KEGG. Each row contains an overrepresented KEGG term with a gradient representing the adjusted P-value. (C) Heat map of functional enrichment analysis using GO analysis. Each gene was mapped to its respective homolog(s) in S. cerevisiae. Each row contains an overrepresented GO term with a gradient representing the adjusted P-value.
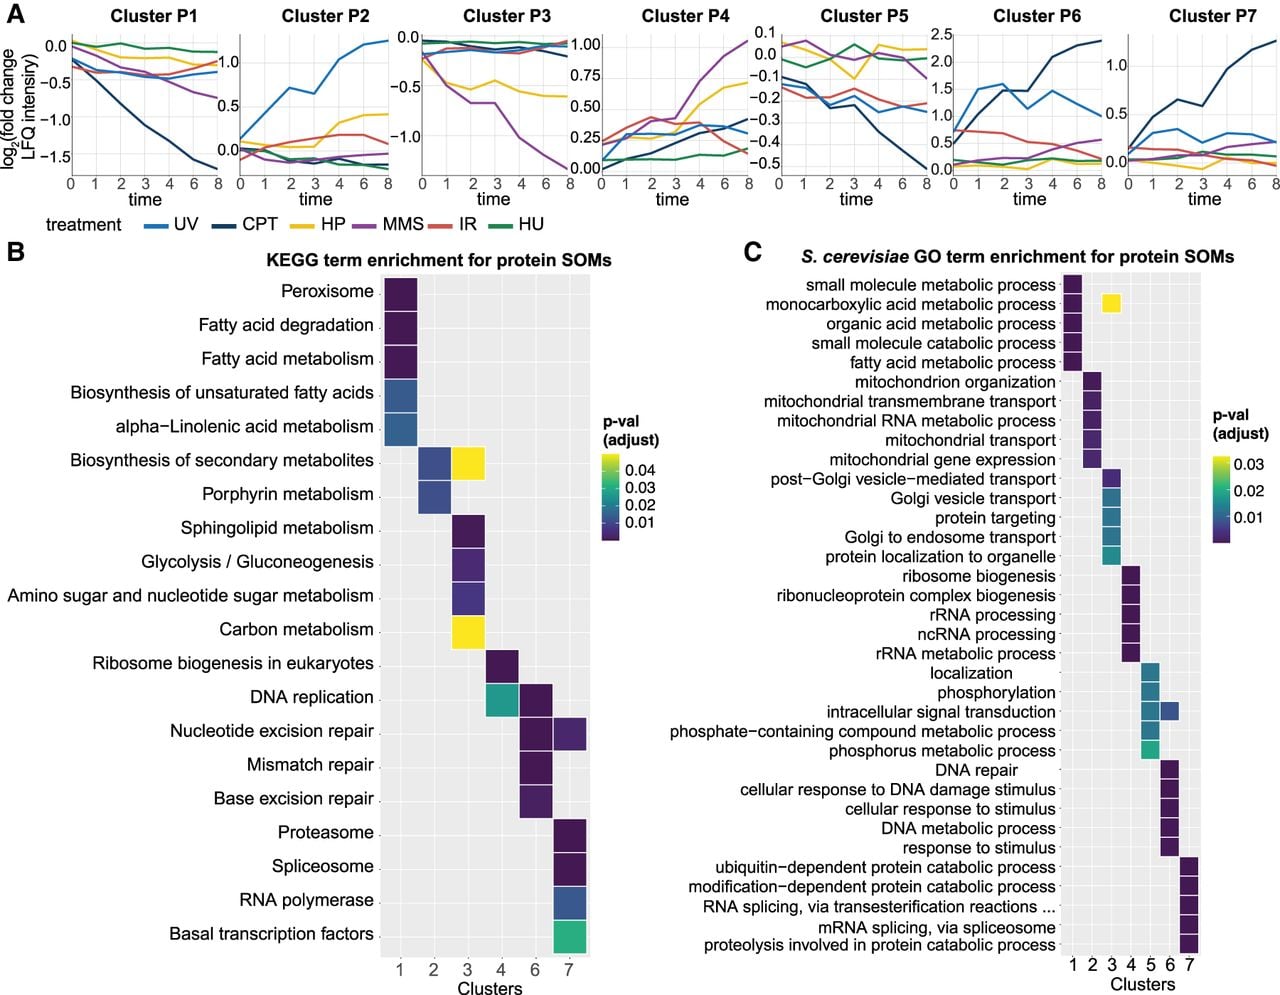
Similar to transcriptional regulation, the chromatin remodelers within the PARP family were differentially regulated across clusters. However, this family of genes is not just being regulated at the transcriptional level. For example, PARP7, PARP8, and PCP3 all fell within T2, whereas now they are found within P6, P7, and P4, respectively (Supplemental Fig. S6A).
Other gene families not directly involved in DNA repair exhibited similar time-dependent transcriptional regulation but grouped into distinct clusters, displaying divergent expression patterns at the protein level. For example, all dynamic dense core granules clustered together in T3 but were part of three different protein clusters (P1 and P3, P7, Supplemental Fig. S6B). All histones were transcriptionally regulated in a highly similar manner (T7), whereas the histone proteins had different protein expression profiles (P6 and P7, Supplemental Fig. S6C). Also, the DNA repair-related PARP family was differentially regulated. Whereas the dynamic transcripts also showed a differential regulation across all clusters, there was clustering of some of the PARP transcripts expression profiles in the same SOM. However, there were some instances of similar protein and transcriptional regulation, such as for the 20S proteasome (T2 and P7, Supplemental Fig. S6D) and transcription related factors (T6 and P7, Supplemental Fig. S6E). Generally, the differences between transcriptome and protein expression profiles unveil additional regulation at the protein level.
Discussion
In this study, our objective was to gain a deeper understanding of the underlying kinetics of DDR at the global level. We conducted one of the largest systems views of DDR to date in the model organism Tetrahymena thermophila. We conducted transcriptome and proteome analyses on cells exposed to six well-characterized DNA-damaging agents over an eight-hour time course, including four biological replicates (Fig. 1A). Across all six treatments, there was clear enrichment of known DNA damage factors and an overall robust dynamic response to damage (Fig. 1C).
When performing hierarchical clustering of DNA repair proteins, our analysis revealed a distinct cluster of 10 different DNA damage proteins, including MSH6L3 and RAD51. MSH6L3 and RAD51 were especially robust responders (Fig. 1D). RAD51 and mismatch repair proteins, such as MSH6 and MSH2, have been shown to be critical DNA repair proteins during sexual reproduction in Tetrahymena (Howard-Till et al. 2011; Loidl 2021; Wang et al. 2023). Whereas their critical role in conjugation has been explored, little work has been done on the mismatch repair proteins in Tetrahymena. Overall, the ciliate community has primarily examined the activities of repair proteins in the context of areas such as conjugation and chromatin organization, rather than during the DDR (Saettone et al. 2019; Loidl 2021).
It is critical to view our findings with the understanding that whole-cell lysates were analyzed; thus, potential differences in the activity between the transcriptionally silent MIC and transcriptionally active MAC cannot be resolved. Nevertheless, in studies focused on conjugation, canonical DNA repair proteins have distinctive activity in the MAC and MIC during meiosis (Loidl 2021). Taken together with the established chromatin state-dependent repair pathways, these observations strongly suggest the presence of unique, nucleus-specific repair mechanisms in the MAC and MIC. We strongly hope that this study might encourage the exploration of this further.
After examining the known DNA repair proteins, we evaluated the extent of the fold change and dynamicity score of all transcripts and proteins (Fig. 2). For the transcripts and proteins that fell above our stringent thresholds, we compared their dynamic responses between treatments. Additionally, we identified a core overlap of eight proteins and 16 transcripts.
To have a deeper understanding of these dynamic proteins and transcripts, we used self-organizing maps, an unsupervised machine learning approach, to cluster the expression profiles of all six treatments. This results in 15 transcript and seven protein expression profile clusters (Figs. 3, 4). Within both types of clusters, we observed known complexes grouping in the same cluster, such as 20S proteasome and transcription-related factors. This indicates that the clustering method successfully identifies similarly regulated complexes.
An unexpected global observation revealed from this study was the sheer speed of transcriptional response to DNA damage. Previous studies reported significant changes in transcriptional expression of repair genes after 1 h (Smith et al. 2004). However, now utilizing more sensitive assays, we detect an early and robust global transcriptional response even at 0 h (Figs. 1D, 3A). Although technical limitations in our workflow prevented more frequent sampling, these results underscore the importance of further exploration into the early transcriptional response to DNA damage in Tetrahymena.
Investigation of these clusters uncovered unexpected gene family regulation, such as in the case of the PARP and PARP-associated proteins. Whereas this protein family is absent in other well-established complex singular cellular eukaryotes, like S. cerevisiae and S. pombe, Tetrahymena has a family of 16 proteins containing a Poly(ADP-ribose) polymerase and DNA-Ligase Zn-finger domain (Citarelli et al. 2010; Xiong et al. 2013; Ashraf et al. 2019). This provides a unique opportunity to study PARP proteins within a unicellular organism. In human cells, among the 17 PARP-related proteins, PARP-1 is considered the primary DDR contributor, whereas PARP-2 and PARP-3 play more minor roles in repair facilitation (Sousa et al. 2012; Ray Chaudhuri and Nussenzweig 2017; Sanderson and Cohen 2020). Based on this, we hypothesized that there might be one particular PARP protein or a small subset of PARP proteins that are primarily responsible for DNA repair in Tetrahymena. However, we observed treatment-specific responses. This finding highlights that this robust data set is well poised for the exploration of novel gene function.
To be able to explore the data, we have developed an R shiny app (https://butterlab.imb-mainz.de/TtDDR/). We are confident that this will propel ongoing research questions forward and open up new discoveries and will serve as a valuable resource to both the ciliate and DNA repair communities.
Methods
Cell culture
The Tetrahymena thermophila wild-type strain SB210 (Tetrahymena Stock Center) was used throughout the study. Cultures were grown in a medium of 2% proteose peptone (BD Biosciences), 0.2% yeast extract (BD Biosciences), 12 µM FeCl3, and 1× penicillin/streptomycin/amphotericin B (Hyclone) at 30°C at 100–150 rotations per minute.
Collection of Tetrahymena for mass spectrometry and RNA sequencing
Tetrahymena were grown to a concentration between 1.5 × 10⁵ and 3 × 10⁵ cells/ml in 500-mL cultures. Samples were treated with six different conditions, grouping two treatments with one nontreated group (grouped as MMS, HP; CP, UV; and HU, IR). Details of treatments are described in Supplemental Table S1. Cells were harvested samples at 0, 1, 2, 3, 4, 6, and 8 h after the initial treatment. To collect samples for later quantitative mass spectrometry, 5 × 10⁴ cells were centrifuged at 9400g for 5 min. The supernatant was removed and cells were washed with 1 mL 10 mM Tris-HCl [pH 7.5], and centrifuged at 9400g for 5 min. The supernatant was discarded leaving a total ∼15 µL of cells and Tris, and 5 µL of 4× LDS (Thermo Fisher Scientific) and 2 µL of 1 m DTT (Sigma-Aldrich) were added. Samples were heated to 90°C for 10 min. Samples were stored at −20°C until mass spectrometry sample preparation. To collect samples for later RNA sequencing (RNA-seq), 5 mL of cells were collected and centrifuged at 1400g for 3 min. The supernatant was decanted and cells were washed with 5 mL 10 mM Tris-HCl [pH 7.5]. Cells were centrifuged at 1400g for 3 min and the supernatant was removed. The cell pellet was resuspended in 600 µL Buffer RLT (Qiagen, RNeasy mini kit), flash frozen in liquid nitrogen, and stored at −80°C until RNA sequencing sample preparation.
Mass spectrometry sample preparation
An LDS sample was loaded on a 4%–12% NuPage NOVEX Bis-Tris gel (Thermo Fisher Scientific) and run for 10 min at 180 V, in 1× MES buffer (Thermo Fisher Scientific). Samples were processed as previously described (Scherer et al. 2020). In short, the gel was stained and fixed with Coomassie Brilliant Blue G250 (Sigma-Aldrich), and initial destaining of the gels was done overnight with water. Gel pieces were cut, further destained with 50% EtOH/50 mM ammonium bicarbonate (ABC), dehydrated with acetonitrile (VWR), reduced with 10 mM DTT (Sigma-Aldrich), alkylated using iodoacetamide (Sigma-Aldrich), subsequently again dehydrated with acetonitrile (VWR), and digested with 1 µg of MS-grade trypsin (Sigma-Aldrich) at 37°C overnight. The peptides were eluted from the gel pieces and loaded onto activated C18 material (Empore) StageTips (Rappsilber et al. 2007) and stored at 4°C until elution and measurement.
Mass spectrometry measurement
Peptides were eluted from the StageTips using 80% acetonitrile/0.1% formic acid and concentrated prior to loading on an Easy-nLC-1200 system coupled to an Orbitrap Exploris 480 mass spectrometer (Thermo Fisher Scientific). The peptides were loaded on a 50-cm column (75 µm inner diameter, New Objective) in-house packed with ReproSil-Pur 120 C18-AQ (Dr. Maisch GmbH). We used a 103-min gradient from 3% to 40% acetonitrile with 0.1% formic acid at a flow of 250 nL/min. The mass spectrometer was operated in positive ion mode with a top 20 MS/MS data-dependent acquisition strategy of one MS full scan (scan range 300–1650 m/z; 60,000 resolution; normalized AGC target 300%; max IT 28 ms) and up to 20 MS/MS scans (15,000 resolution; AGC target 100%, max IT 40 ms; isolation window 1.4 m/z) with peptide match preferred using HCD fragmentation.
Mass spectrometry data analysis
Raw files were analyzed using MaxQuant (version 1.6.10.43). As a search space, the T. thermophila protein database was used (June 2014, TGD). Oxidation and acetylation were set as variable modifications, carbamidomethylation as a fixed modification. Fast LFQ was used to calculate and normalize intensities. The minimum ratio count used was 2. Match between runs was used to match within each time point per treatment and to the time points right before and after, with a match time window of 0.7 min, match ion mobility window of 0.05, an alignment time window of 20 min, and alignment ion mobility of 1. Matching of unidentified features was deactivated. For protein quantification, label minimum ratio count 2 and unique + razor peptides were used.
RNA sample preparation and sequencing
Previously obtained samples were thawed on ice. RNA isolation was performed with an RNeasy mini kit (Qiagen) in accordance with the manufacturer's instructions with the addition of the optional DNase I on column digestion. This digestion was carried out with 3 units of DNase I (Qiagen) per sample, and samples were digested for 15 min at room temperature on the column. NGS library prep was performed with Lexogen`s QuantSeq 3´mRNA-Seq Library Prep kit FWD following Lexogen`s standard protocol (015UG009V0252). Libraries were prepared with a starting amount of 300 ng and amplified in 14 PCR cycles. Libraries were profiled in a High Sensitivity DNA on a 2100 Bioanalyzer (Agilent Technologies) and quantified using the Qubit dsDNA HS Assay kit, in a Qubit 2.0 Fluorometer (Life Technologies). All libraries from the two treatments and coordinating nontreatment were pooled together in equimolar ratio and sequenced on 1 NextSeq 500 high output flow cell, SR for 1 × 84 cycles plus seven cycles for the index read.
RNA-seq analysis
All demultiplexed, raw sequencing files of each treatment set were analyzed together. Initial analysis was done through a modified version of the NGS pipeline by the bioinformatics core facility of the IMB (available at GitLab, https://gitlab.rlp.net/imbforge/NGSpipe2go). For reference, “subread2rnatypes,” “genebodyCov2,” “rMATS,” and the GO enrichment analysis were removed from the pipeline. In short, the library quality was assessed with FastQC before alignment against the T. thermophila genome assembly SB210 and a custom built GTF file, which included gene annotations from T. thermophila (TGD, T_thermophila_June2014.gff3). Alignment was performed with STAR aligner version 2.7.3a (Dobin et al. 2013). Reads mapping to annotated features in the custom GTF file were counted with featureCounts (Liao et al. 2014). Initial CPM counts were calculated with DESeq2 (Love et al. 2014) in R (R Core Team 2022).
Further bioinformatic analysis
All further analysis was done with scripts developed in R (R Core Team 2022), incorporating ggplot2 for visualization (Wickham 2016) among other packages.
For proteome data, contaminants, reverse database hits, protein groups only identified by site, and protein groups with less than two peptides (at least one of them classified as unique) were removed. Additionally, only protein groups present in at least two out of four technical replicates were kept. Missing values were imputed by shifting a compressed beta distribution obtained from the LFQ intensity values to the limit of quantitation (between 0.2 and 2.5 percentile of the measured intensity distribution per sample). LFQ intensities were log2 transformed, after which fold changes for individual comparisons of time points or strains could be calculated per protein; a Welch t-test was used to calculate P-values. The general protein enrichment threshold was set to a P-value lower than 0.05 and an absolute fold change higher than 1. All calculated values can be found in Supplemental Table S7.
For transcriptome data, transcripts which did not have any CPM value across the time points and treatments above the 25th quantile of all CPM values (CPM < 1.673028) were removed. All CPM values were log2 transformed. Differential regulation thresholds were set at L2FC > 1 or <−1, and adjusted P-value (FDR) < 0.05. All calculated values can be found in Supplemental Table S8.
Dynamicity of transcripts or proteins was calculated using the Gini ratio, as described before (Damgaard and Weiner 2000; Casas-Vila et al. 2017). Statistical testing of overlaps of dynamic genes was done with the R package SuperExactTest (Wang et al. 2015). Functional enrichment analysis was performed using Kyoto Encyclopedia of Genes and Genomes (KEGG) (Kanehisa et al. 2023), Gene Ontology (The Gene Ontology Consortium 2021), and the ClusterProfiler R package (Yu et al. 2012; Wu et al. 2021) for statistical analysis. Terms for groups of enriched proteins were assessed for overrepresentation with a Fisher's exact test, against all terms found in our complete data set as background. The enrichment threshold was set to an adjusted (FDR) P-value < 0.05. Self-organizing map clustering was done with the help of the Kohonen package in R.
Data access
The mass spectrometry proteomics data have been submitted to the ProteomeXchange Consortium via the PRIDE (Perez-Riverol et al. 2022) partner repository under accession number PXD061546. The sequencing data have been submitted with links to the NCBI BioProject database (https://www.ncbi.nlm.nih.gov/bioproject/) under accession number PRJNA1246365. Calculated values and outcomes can be found in Supplemental Tables S7 and S8. All data can be explored through a user-friendly web interface at https://butterlab.imb-mainz.de/TtDDR. This web interface was designed and built with the use of R Shiny and its code is available at GitHub (https://github.com/AFraderaSola/ShinyDocker_Tetrahymena). All data and code for the analysis in this study were written in R and are freely available via the workflowr (Blischak et al. 2019) website at GitLab (https://gitlab.com/vivienschoonenberg/Tetddr_wflowr) and as Supplemental Code.
Competing interest statement
The authors declare no competing interests.
Acknowledgments
We thank the IMB Media Lab, the Electronics Workshop, and the Proteomics Core Facility for their assistance. We thank Michal Levin for her input and advice for data analysis. Support by the IMB Genomics Core Facility and the use of its NextSeq 500 (funded by the Deutsche Forschungsgemeinschaft [DFG, German Research Foundation] – INST 247/870-1 FUGG) is gratefully acknowledged. This project was funded by the Deutsche Forschungsgemeinschaft (DFG, German Research Foundation) (Project-ID 393547839-SFB 1361). V.A.C.S. is supported by the Joachim Herz Stiftung through an Add-On fellowship for Interdisciplinary Life Science.
Author contributions: Conceptualization was by F.B., E.N., and V.A.C.S. Experimentation was by E.N., R.M., S.Z., and J.J.S. Data analysis was by V.A.C.S. Accessible user interface was by A.F.-S. Writing of the original draft was by E.N. and V.A.C.S. Reviewing and editing were by F.B., E.N., and V.A.C.S. Supervision was by F.B. All authors approved the final version.
Notes
[1] Supplementary material [Supplemental material is available for this article.]
[2] Article published online before print. Article, supplemental material, and publication date are at https://www.genome.org/cgi/doi/10.1101/gr.281000.125.
References
- ↵Agrawal RK, Patel RK, Shah V, Nainiwal L, Trivedi B. 2014. Hydroxyurea in sickle cell disease: drug review. Indian J Hematol Blood Transfus 30: 91–96. 10.1007/s12288-013-0261-4
- ↵Ashraf K, Nabeel-Shah S, Garg J, Saettone A, Derynck J, Gingras A-C, Lambert J-P, Pearlman RE, Fillingham J. 2019. Proteomic analysis of histones H2A/H2B and variant hv1 in tTetrahymena thermophila reveals an ancient network of chaperones. Mol Biol Evol 36: 1037–1055. 10.1093/molbev/msz039
- ↵Beard WA, Horton JK, Prasad R, Wilson SH. 2019. Eukaryotic base excision repair: new approaches shine light on mechanism. Annu Rev Biochem 88: 137–162. 10.1146/annurev-biochem-013118-111315
- ↵Blischak JD, Carbonetto P, Stephens M. 2019. Creating and sharing reproducible research code the workflowr way. F1000Res 8: 1749. 10.12688/f1000research.20843.1
- ↵Bowen N, Smith CE, Srivatsan A, Willcox S, Griffith JD, Kolodner RD. 2013. Reconstitution of long and short patch mismatch repair reactions using Saccharomyces cerevisiae proteins. Proc Natl Acad Sci 110: 18472–18477. 10.1073/pnas.1318971110
- ↵Campbell C, Romero DP. 1998. Identification and characterization of the RAD51 gene from the ciliate Tetrahymena thermophila. Nucleic Acids Res 26: 3165–3172. 10.1093/nar/26.13.3165
- ↵Casas-Vila N, Bluhm A, Sayols S, Dinges N, Dejung M, Altenhein T, Kappei D, Altenhein B, Roignant J-Y, Butter F. 2017. The developmental proteome of Drosophila melanogaster. Genome Res 27: 1273–1285. 10.1101/gr.213694.116
- ↵Chakraborty U, Alani E. 2016. Understanding how mismatch repair proteins participate in the repair/anti-recombination decision. FEMS Yeast Res 16: fow071. 10.1093/femsyr/fow071
- ↵Chalker DL, Meyer E, Mochizuki K. 2013. Epigenetics of ciliates. Cold Spring Harb Perspect Biol 5: a017764. 10.1101/cshperspect.a017764
- ↵Chapman JR, Taylor MRG, Boulton SJ. 2012. Playing the end game: DNA double-strand break repair pathway choice. Mol Cell 47: 497–510. 10.1016/j.molcel.2012.07.029
- ↵Ciccia A, Elledge SJ. 2010. The DNA damage response: making it safe to play with knives. Mol Cell 40: 179–204. 10.1016/j.molcel.2010.09.019
- ↵Citarelli M, Teotia S, Lamb RS. 2010. Evolutionary history of the poly(ADP-ribose) polymerase gene family in eukaryotes. BMC Evol Biol 10: 308. 10.1186/1471-2148-10-308
- ↵Damgaard C, Weiner J. 2000. Describing inequality in plant size or fecundity. Ecology 81: 1139–1142. 10.1890/0012-9658(2000)081[1139:DIIPSO]2.0.CO;2
- ↵Deans AJ, West SC. 2011. DNA interstrand crosslink repair and cancer. Nat Rev Cancer 11: 467–480. 10.1038/nrc3088
- ↵Dobin A, Davis CA, Schlesinger F, Drenkow J, Zaleski C, Jha S, Batut P, Chaisson M, Gingeras TR. 2013. STAR: ultrafast universal RNA-seq aligner. Bioinformatics 29: 15–21. 10.1093/bioinformatics/bts635
- ↵Duan M, Ulibarri J, Liu KJ, Mao P. 2020. Role of nucleotide excision repair in cisplatin resistance. Int J Mol Sci 21: 9248. 10.3390/ijms21239248
- ↵Evans WE, Yee GC, Crom WR, Pratt CB, Green AA. 1982. Clinical pharmacology of bleomycin and cisplatin. Drug Intell Clin Pharm 16: 448–458. 10.1177/106002808201600602
- ↵Fayyad N, Kobaisi F, Beal D, Mahfouf W, Ged C, Morice-Picard F, Fayyad-Kazan M, Fayyad-Kazan H, Badran B, Rezvani HR, 2020. Xeroderma pigmentosum C (XPC) mutations in primary fibroblasts impair base excision repair pathway and increase oxidative DNA damage. Front Genet 11: 561687. 10.3389/fgene.2020.561687
- ↵The Gene Ontology Consortium. 2021. The Gene Ontology resource: enriching a GOld mine. Nucleic Acids Res 49: D325–D334. 10.1093/nar/gkaa1113
- ↵Howard-Till RA, Lukaszewicz A, Loidl J. 2011. The recombinases Rad51 and Dmc1 play distinct roles in DNA break repair and recombination partner choice in the meiosis of Tetrahymena. PLoS Genet 7: e1001359. 10.1371/journal.pgen.1001359
- ↵Huang R-X, Zhou P-K. 2020. DNA damage response signaling pathways and targets for radiotherapy sensitization in cancer. Signal Transduct Target Ther 5: 60. 10.1038/s41392-020-0150-x
- ↵Huang H, Zhu L, Reid BR, Drobny GP, Hopkins PB. 1995. Solution structure of a cisplatin-induced DNA interstrand cross-link. Science 270: 1842–1845. 10.1126/science.270.5243.1842
- ↵Jackson SP, Bartek J. 2009. The DNA-damage response in human biology and disease. Nature 461: 1071–1078. 10.1038/nature08467
- ↵Kanehisa M, Furumichi M, Sato Y, Kawashima M, Ishiguro-Watanabe M. 2023. KEGG for taxonomy-based analysis of pathways and genomes. Nucleic Acids Res 51: D587–D592. 10.1093/nar/gkac963
- ↵Kelley MR, Kow YW, Wilson DMIII. 2003. Disparity between DNA base excision repair in yeast and mammals: translational implications. Cancer Res 63: 549–554.
- ↵Kovalchuk I. 2016. Conserved and divergent features of DNA repair: future perspectives in genome instability research. In Genome stability (ed. Kovalchuk I, Kovalchuk O), pp. 651–666. Academic Press, Boston. https://www.sciencedirect.com/science/article/pii/B9780128033098000380.
- ↵Kumar N, Theil AF, Roginskaya V, Ali Y, Calderon M, Watkins SC, Barnes RP, Opresko PL, Pines A, Lans H, 2022. Global and transcription-coupled repair of 8-oxoG is initiated by nucleotide excision repair proteins. Nat Commun 13: 974. 10.1038/s41467-022-28642-9
- ↵Kunkel TA, Erie DA. 2015. Eukaryotic mismatch repair in relation to DNA replication. Annu Rev Genet 49: 291–313. 10.1146/annurev-genet-112414-054722
- ↵Lanz MC, Dibitetto D, Smolka MB. 2019. DNA damage kinase signaling: checkpoint and repair at 30 years. EMBO J 38: e101801. 10.15252/embj.2019101801
- ↵Lee SR, Pollard DA, Galati DF, Kelly ML, Miller B, Mong C, Morris MN, Roberts-Nygren K, Kapler GM, Zinkgraf M, 2021. Disruption of a ∼23–24 nucleotide small RNA pathway elevates DNA damage responses in Tetrahymena thermophila. Mol Biol Cell 32: 1335–1346. 10.1091/mbc.E20-10-0631
- ↵Lehoczký P, McHugh PJ, Chovanec M. 2007. DNA interstrand cross-link repair in Saccharomyces cerevisiae. FEMS Microbiol Rev 31: 109–133. 10.1111/j.1574-6976.2006.00046.x
- ↵Li X, Heyer W-D. 2008. Homologous recombination in DNA repair and DNA damage tolerance. Cell Res 18: 99–113. 10.1038/cr.2008.1
- ↵Li Z, Pearlman AH, Hsieh P. 2016. DNA mismatch repair and the DNA damage response. DNA Repair (Amst) 38: 94–101. 10.1016/j.dnarep.2015.11.019
- ↵Liao Y, Smyth GK, Shi W. 2014. featureCounts: an efficient general purpose program for assigning sequence reads to genomic features. Bioinformatics 30: 923–930. 10.1093/bioinformatics/btt656
- ↵Lin I-T, Chao J-L, Yao M-C. 2012. An essential role for the DNA breakage-repair protein Ku80 in programmed DNA rearrangements in Tetrahymena thermophila. Mol Biol Cell 23: 2213–2225. 10.1091/mbc.e11-11-0952
- ↵Loidl J. 2021. Tetrahymena meiosis: simple yet ingenious. PLoS Genet 17: e1009627. 10.1371/journal.pgen.1009627
- ↵Loidl J, Mochizuki K. 2009. Tetrahymena meiotic nuclear reorganization is induced by a checkpoint kinase–dependent response to DNA damage. Mol Biol Cell 20: 2428–2437. 10.1091/mbc.e08-10-1058
- ↵Love MI, Huber W, Anders S. 2014. Moderated estimation of fold change and dispersion for RNA-seq data with DESeq2. Genome Biol 15: 550. 10.1186/s13059-014-0550-8
- ↵Marsh TC, Cole ES, Stuart KR, Campbell C, Romero DP. 2000. RAD51 is required for propagation of the germinal nucleus in Tetrahymena thermophila. Genetics 154: 1587–1596. 10.1093/genetics/154.4.1587
- ↵Marsh TC, Cole ES, Romero DP. 2001. The transition from conjugal development to the first vegetative cell division is dependent on RAD51 expression in the ciliate Tetrahymena thermophila. Genetics 157: 1591–1598. 10.1093/genetics/157.4.1591
- ↵Mathiasen DP, Lisby M. 2014. Cell cycle regulation of homologous recombination in Saccharomyces cerevisiae. FEMS Microbiol Rev 38: 172–184. 10.1111/1574-6976.12066
- ↵Molinaro C, Martoriati A, Cailliau K. 2021. Proteins from the DNA damage response: regulation, dysfunction, and anticancer strategies. Cancers (Basel) 13: 3819. 10.3390/cancers13153819
- ↵Morales J, Li L, Fattah FJ, Dong Y, Bey EA, Patel M, Gao J, Boothman DA. 2014. Review of poly (ADP-ribose) polymerase (PARP) mechanisms of action and rationale for targeting in cancer and other diseases. Crit Rev Eukaryot Gene Expr 24: 15–28. 10.1615/CritRevEukaryotGeneExpr.2013006875
- ↵Orias E, Cervantes MD, Hamilton EP. 2011. Tetrahymena thermophila, a unicellular eukaryote with separate germline and somatic genomes. Res Microbiol 162: 578–586. 10.1016/j.resmic.2011.05.001
- ↵Pannunzio NR, Watanabe G, Lieber MR. 2018. Nonhomologous DNA end-joining for repair of DNA double-strand breaks. J Biol Chem 293: 10512–10523. 10.1074/jbc.TM117.000374
- ↵Perez-Riverol Y, Bai J, Bandla C, García-Seisdedos D, Hewapathirana S, Kamatchinathan S, Kundu DJ, Prakash A, Frericks-Zipper A, Eisenacher M, 2022. The PRIDE database resources in 2022: a hub for mass spectrometry-based proteomics evidences. Nucleic Acids Res 50: D543–D552. 10.1093/nar/gkab1038
- ↵Pizzul P, Casari E, Gnugnoli M, Rinaldi C, Corallo F, Longhese MP. 2022. The DNA damage checkpoint: a tale from budding yeast. Front Genet 13: 995163. 10.3389/fgene.2022.995163
- ↵Ransy C, Vaz C, Lombès A, Bouillaud F. 2020. Use of H2O2 to cause oxidative stress, the catalase issue. Int J Mol Sci 21: 9149. 10.3390/ijms21239149
- ↵Rappsilber J, Mann M, Ishihama Y. 2007. Protocol for micro-purification, enrichment, pre-fractionation and storage of peptides for proteomics using StageTips. Nat Protoc 2: 1896–1906. 10.1038/nprot.2007.261
- ↵Ray Chaudhuri A, Nussenzweig A. 2017. The multifaceted roles of PARP1 in DNA repair and chromatin remodelling. Nat Rev Mol Cell Biol 18: 610–621. 10.1038/nrm.2017.53
- ↵R Core Team. 2022. R: a language and environment for statistical computing. R Foundation for Statistical Computing, Vienna. https://www.R-project.org/.
- ↵Ruehle MD, Orias E, Pearson CG. 2016. Tetrahymena as a unicellular model eukaryote: genetic and genomic tools. Genetics 203: 649–665. 10.1534/genetics.114.169748
- ↵Saettone A, Nabeel-Shah S, Garg J, Lambert J-P, Pearlman RE, Fillingham J. 2019. Functional proteomics of nuclear proteins in Tetrahymena thermophila: a review. Genes (Basel) 10: 333. 10.3390/genes10050333
- ↵Sanderson DJ, Cohen MS. 2020. Mechanisms governing PARP expression, localization, and activity in cells. Crit Rev Biochem Mol Biol 55: 541–554. 10.1080/10409238.2020.1818686
- ↵Sandoval PY, Lee P-H, Meng X, Kapler GM. 2015. Checkpoint activation of an unconventional DNA replication program in Tetrahymena. PLoS Genet 11: e1005405. 10.1371/journal.pgen.1005405
- ↵Schärer OD. 2013. Nucleotide excision repair in eukaryotes. Cold Spring Harb Perspect Biol 5: a012609. 10.1101/cshperspect.a012609
- ↵Scherer M, Levin M, Butter F, Scheibe M. 2020. Quantitative proteomics to identify nuclear RNA-binding proteins of Malat1. Int J Mol Sci 21: E1166. 10.3390/ijms21031166
- ↵Scully R, Panday A, Elango R, Willis NA. 2019. DNA double-strand break repair-pathway choice in somatic mammalian cells. Nat Rev Mol Cell Biol 20: 698–714. 10.1038/s41580-019-0152-0
- ↵Slade KM, Freggiaro S, Cottrell KA, Smith JJ, Wiley EA. 2011. Sirtuin-mediated nuclear differentiation and programmed degradation in Tetrahymena. BMC Cell Biol 12: 40. 10.1186/1471-2121-12-40
- ↵Smith JJ, Cole ES, Romero DP. 2004. Transcriptional control of RAD51 expression in the ciliate Tetrahymena thermophila. Nucleic Acids Res 32: 4313–4321. 10.1093/nar/gkh771
- ↵Sousa FG, Matuo R, Soares DG, Escargueil AE, Henriques JAP, Larsen AK, Saffi J. 2012. PARPs and the DNA damage response. Carcinogenesis 33: 1433–1440. 10.1093/carcin/bgs132
- ↵Spivak G. 2015. Nucleotide excision repair in humans. DNA Repair (Amst) 36: 13–18. 10.1016/j.dnarep.2015.09.003
- ↵Tatum D, Li S. 2011. Nucleotide excision repair in S. cerevisiae. In DNA repair - on the pathways to fixing DNA damage and errors (ed. Storici F), pp. 95–122. IntechOpen, London. 10.5772/22129
- ↵Wahab S, Saettone A, Nabeel-Shah S, Dannah N, Fillingham J. 2020. Exploring the histone acetylation cycle in the protozoan model Tetrahymena thermophila. Front Cell Dev Biol 8: 509. 10.3389/fcell.2020.00509
- ↵Wang M, Zhao Y, Zhang B. 2015. Efficient test and visualization of multi-set intersections. Sci Rep 5: 16923. 10.1038/srep16923
- ↵Wang L, Xue Y, Yang S, Bo T, Xu J, Wang W. 2023. Mismatch repair protein Msh2 is necessary for macronuclear stability and micronuclear division in Tetrahymena thermophila. Int J Mol Sci 24: 10559. 10.3390/ijms241310559
- ↵Wickham H. 2016. ggplot2: elegant graphics for data analysis. Springer-Verlag, New York. https://ggplot2.tidyverse.org.
- ↵Wu T, Hu E, Xu S, Chen M, Guo P, Dai Z, Feng T, Zhou L, Tang W, Zhan L, 2021. clusterProfiler 4.0: a universal enrichment tool for interpreting omics data. Innovation 2: 100141. 10.1016/j.xinn.2021.100141
- ↵Xiong J, Lu Y, Feng J, Yuan D, Tian M, Chang Y, Fu C, Wang G, Zeng H, Miao W. 2013. Tetrahymena functional genomics database (TetraFGD): an integrated resource for Tetrahymena functional genomics. Database 2013: bat008. 10.1093/database/bat008
- ↵Yu G, Wang L-G, Han Y, He Q-Y. 2012. clusterProfiler: an R package for comparing biological themes among gene clusters. OMICS J Integr Biol 16: 284–287. 10.1089/omi.2011.0118
- ↵Zhou Y, Fu L, Mochizuki K, Xiong J, Miao W, Wang G. 2022. Absolute quantification of chromosome copy numbers in the polyploid macronucleus of Tetrahymena thermophila at the single-cell level. J Eukaryot Microbiol 69: e12907. 10.1111/jeu.12907