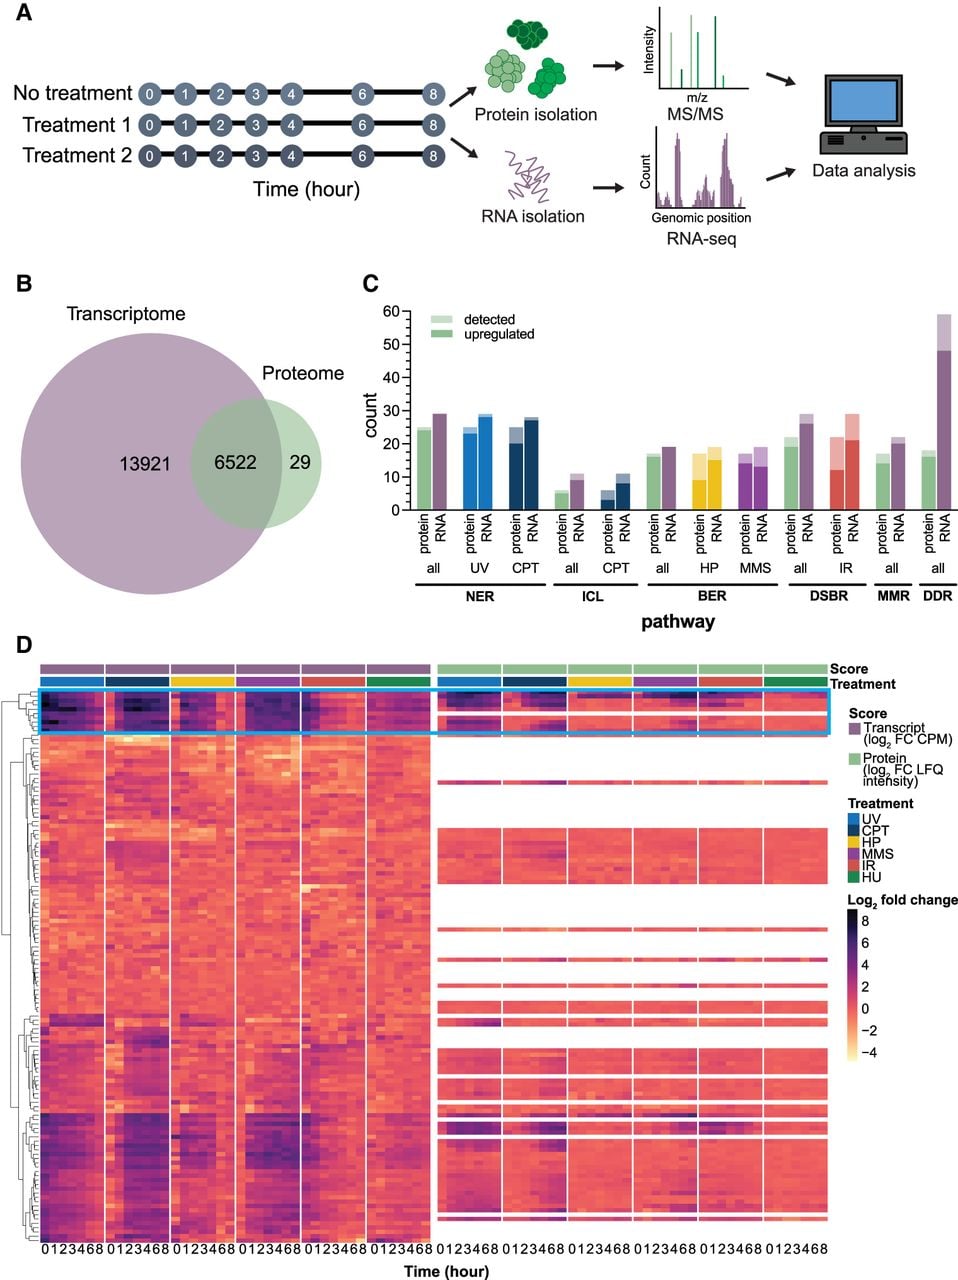
Screen to explore kinetics of DNA damage response in Tetrahymena. (A) Schematic of the screen workflow. Cells were treated with a mutagenic agent, and samples were harvested incrementally over 8 h. At each time point, samples were collected for processing for both RNA sequencing and quantitative mass spectrometry. (B) Venn diagram depicting the overlap between the identified transcripts and proteins. (C) Bar graph of enriched (full color) and detected (transparent color) DNA damage repair factors, where enriched proteins have L2FC > 1 or transcripts have L2FC > 2. Detected proteins or transcripts are present and found in the respective data sets, but not enriched. (D) Heat map of hierarchical clustering of DNA repair genes of interest. Light blue box highlighting the group of core damage response transcripts. NER: nucleotide excision repair, ICL: inter crosslink repair, BER: base excision repair, DSBR: double-strand break repair, MMR: mismatch repair, DDR: DNA damage response, UV: ultraviolet light, CPT: cisplatin, HP: hydrogen peroxide, MMS: methyl methanesulfonate, IR: ionizing radiation, HU: hydroxyurea.