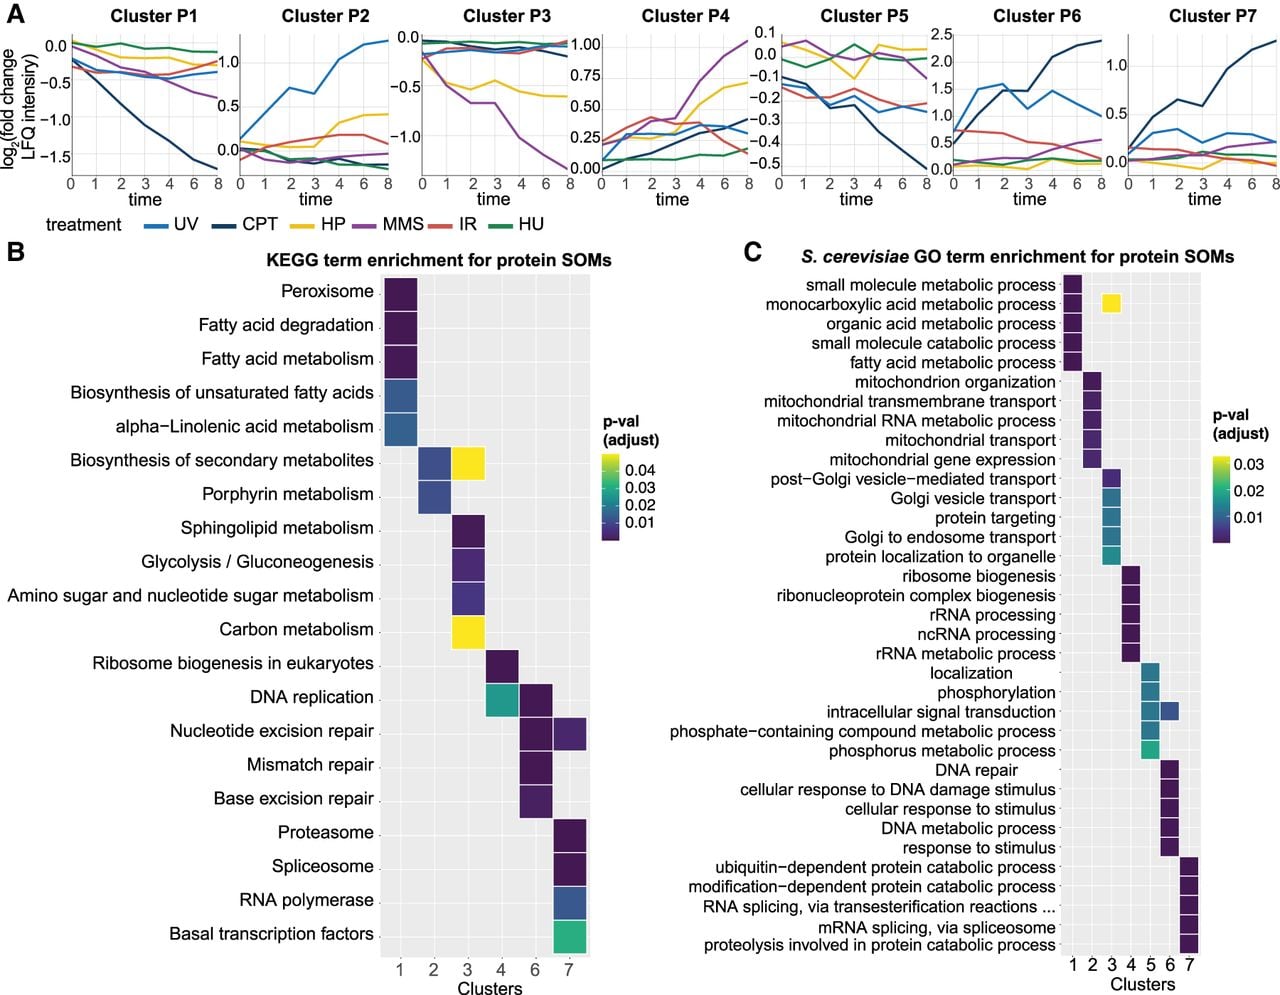
Protein clusters reveal a specific and dynamic DNA damage response. (A) Average expression profiles for clusters of dynamic proteins. Using an unsupervised machine learning technique, we clustered dynamic transcripts based on their shared expression profiles into seven different clusters. These line graphs are the average expression profiles for each treatment. (B) Heat map of functional enrichment analysis using KEGG. Each row contains an overrepresented KEGG term with a gradient representing the adjusted P-value. (C) Heat map of functional enrichment analysis using GO analysis. Each gene was mapped to its respective homolog(s) in S. cerevisiae. Each row contains an overrepresented GO term with a gradient representing the adjusted P-value.