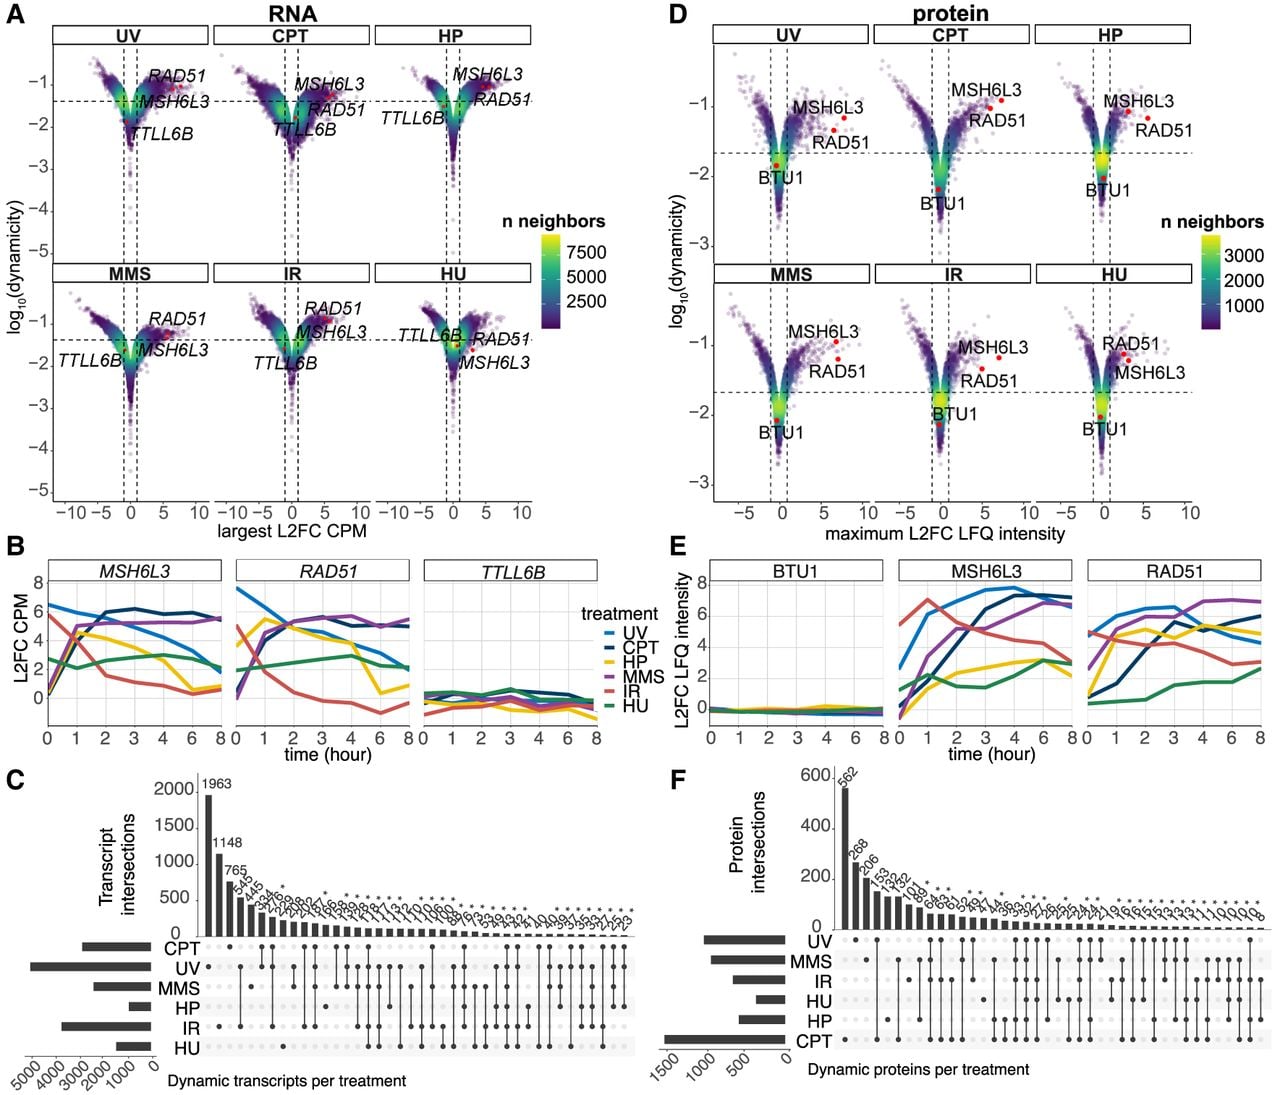
Mutagenic treatments cause global dynamic response. (A) Volcano plots plotting dynamic transcripts for each treatment. The x-axis contains the maximal positive or negative fold change during the duration of the time course, and the y-axis contains a Gini score evaluating the dynamicity throughout the entire time course. (B) Example line plots of the expression profiles dynamic (MSH6L3 and RAD51) and stable transcripts (TTLL6B). (C) Upset plots of overlapping dynamic transcripts between treatments. (D) Volcano plots plotting dynamic proteins for each treatment. The x-axis contains the maximal positive or negative fold change during the duration of the time course, and the y-axis contains a Gini score evaluating the dynamicity throughout the entire time course. (E) Line plots of the expression profiles dynamic (MSH6L3 and RAD51) and stable proteins (BTU1). (F) Upset plots of overlapping dynamic proteins between treatments.