

Abstract
ACTB is a cytoskeletal protein involved in intracellular trafficking. In recent years, it has become evident that, in addition to its established roles in these compartments, ACTB also participates in the regulation of transcription. However, the molecular mechanisms underlying this function remain poorly understood. The methyltransferase SETD3 has previously been shown to methylate ACTB at H73, thereby regulating ACTB polymerization and smooth muscle contraction. Here, we show that the genomic distribution of ACTB is SETD3-dependent and that this regulation modulates the transcription of genes involved in cell adhesion and mRNA translation in colorectal cancer cells. Proteomic analyses reveal that ACTB and SETD3 interact with multiple large protein complexes, including complexes associated with transcriptional regulation. Specifically, we demonstrate that SETD3-mediated ACTB methylation is required for the colocalization of SMARCA4, a subunit of the SWI/SNF BAF complex, at specific genomic loci. Genomic analyses further show that this colocalization enables the coordinated occupancy of SMARCA4 and H73-methylated ACTB at genes involved in cell adhesion and mRNA translation. Finally, phenotypic assays confirm these regulatory effects. Together, these findings uncover a new mechanistic layer of selective transcriptional regulation mediated by an ACTB–SETD3–SMARCA4 axis in colorectal cancer cells.
The human SET domain-containing protein 3 (SETD3) gene, located on Chromosome 14q32.2, encodes a 67 kDa protein containing a highly conserved N-terminal catalytic SET domain and a C-terminal substrate-binding domain (SBD) homologous to the RuBisCo large-subunit lysine methyltransferase (LSMT) (Tiebe et al. 2018; Abaev-Schneiderman et al. 2019; Admoni-Elisha et al. 2022; Gao et al. 2024; Kong et al. 2024; Duan et al. 2025). SETD3 is highly expressed among many tissues and regulates diverse cellular signaling pathways through protein–protein interactions or its enzymatic activity, protein methylation (Witecka et al. 2021). SETD3 methylates the transcription factor FoxM1 to negatively regulate VEGFA expression under normoxic and hypoxic cellular conditions (Cohn et al. 2016). Similar results were also observed during hypoxic pulmonary hypertension in rats (Jiang et al. 2018). In addition, SETD3 was shown to interact with several proteins involved in DNA replication and DNA repair, such as PCNA, MAF1, and RNF7 (Cooper et al. 2015). Notably, SETD3 was the first discovered metazoan protein histidine methyltransferase (Kwiatkowski et al. 2018; Dai et al. 2019; Guo et al. 2019; Wilkinson et al. 2019; Hintzen et al. 2021). SETD3 methylates ACTB on histidine 73 (H73me), and this methylation event is important for normal ACTB polymerization activity and smooth-muscle contraction. Corresponding to this, the depletion of SETD3 causes primary dystocia in female mice (Wilkinson et al. 2019).
ACTB is primarily known for its role as a major component of the cytoskeleton that participates in intracellular trafficking and cell motility (Svitkina 2018; Gibieza and Petrikaite 2021), cytokinesis (Chen et al. 2017), and cell adhesion (Hynes 1992). However, ACTB is also present in the nucleus where it participates in the regulation of RNA processing and export. Its roles also extend to the regulation of transcription and DNA repair (Hurst et al. 2019). ACTB associates with both RNA polymerase II (Pol II) (Pestic-Dragovich et al. 2000) and RNA polymerase III (Pol III) (Hu et al. 2004) complexes, suggesting that ACTB is involved in transcription initiation and elongation (Percipalle and Visa 2006). Further, experiments using in vivo mouse models found ACTB to be the only actin isoform involved in transcriptional regulation of cell cycle and cell motility genes; ACTB knockout mice are embryonic lethal (Bunnell et al. 2011).
Nuclear ACTB is an integral component of several chromatin remodeling complexes such as the BAF, BAP, and INO80 complexes, as well as the Nu4A and TIP60 histone acetyl transferase complexes (Ji et al. 2022). In the SWI/SNF BAF complex, ACTB stimulates the ATPase activity of the SMARCA4 subunit and is required for BAF complex association with the nuclear matrix (Falahzadeh et al. 2015; Sen et al. 2024). The BAF complex plays a crucial role in development and differentiation by directly regulating the chromatin state of critical genes to oppose the repressive activity of polycomb repressive complexes (PRCs). Knock-out of ACTB in mouse fibroblasts leads to a dysregulation of the BAF–PRC2 relationship (Mahmood et al. 2021).
Given that both SETD3 and ACTB localize to the nucleus and have been implicated in transcriptional regulation, we hypothesized that ACTB H73 methylation contributes to the control of specific transcriptional programs. In this study, we aim to investigate whether SETD3-dependent ACTB methylation influences the genomic distribution of ACTB, to define the molecular interaction networks of SETD3 and ACTB in colorectal cancer cells, and to determine whether this modification impacts chromatin remodeling through interactions with transcription-associated complexes such as SMARCA4. Together, these objectives seek to elucidate the mechanistic role of the SETD3–ACTB axis in regulating gene expression programs relevant to colorectal cancer.
Results
Methylated ACTB regulates gene transcription
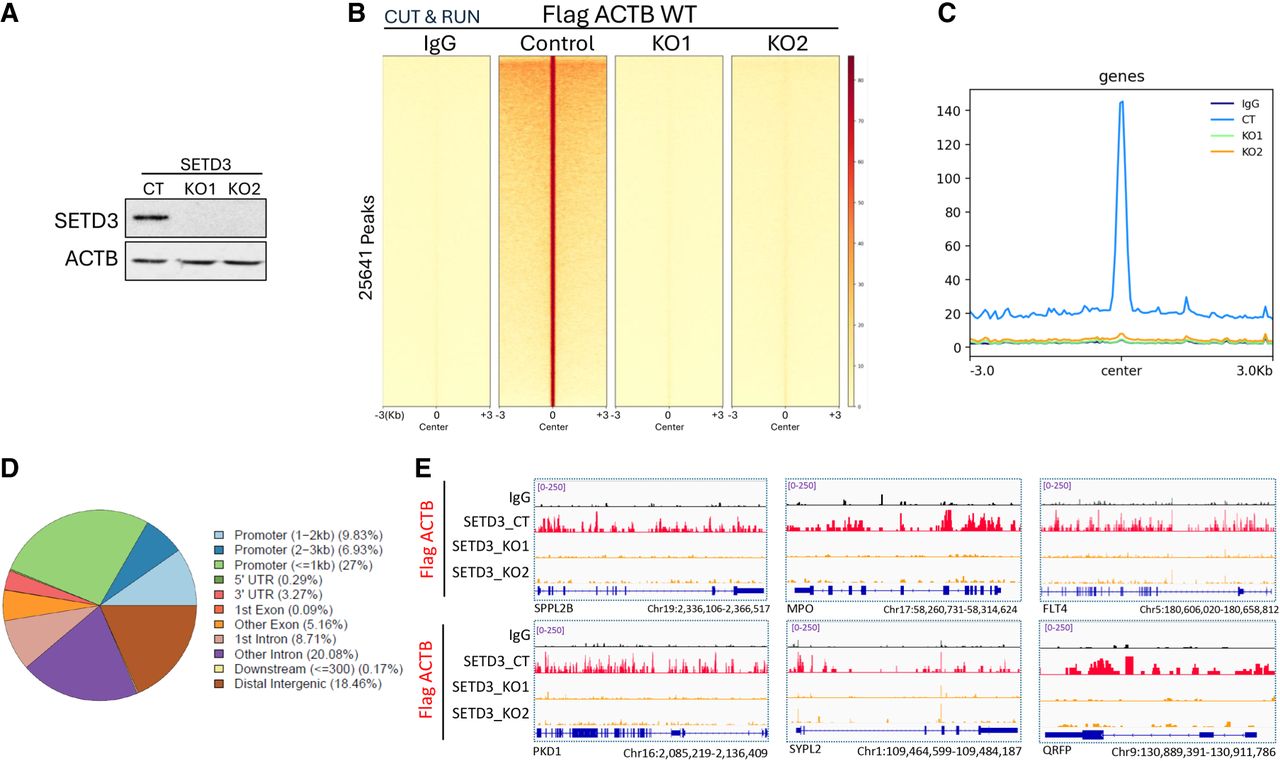
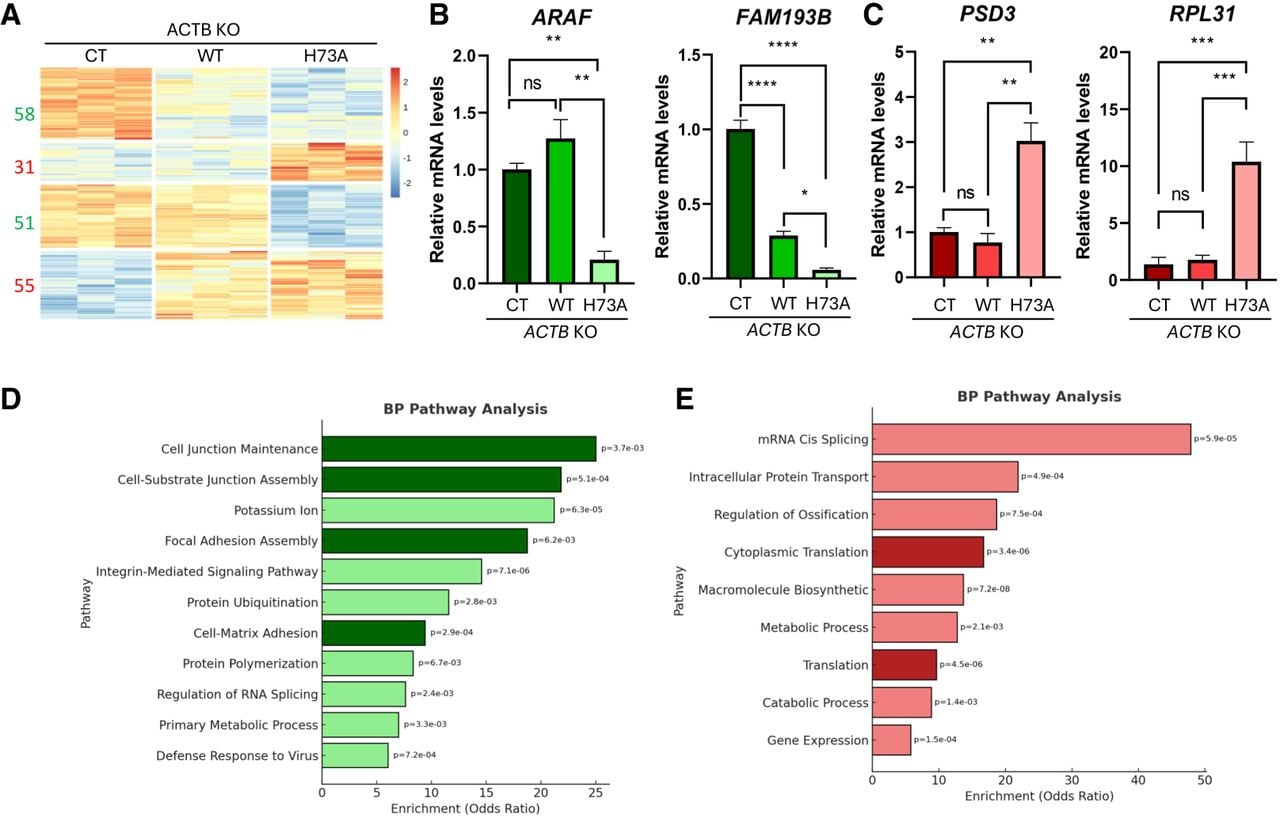
It was previously shown that depletion of SETD3 completely eliminates ACTB methylation on H73 (Wilkinson et al. 2019). To examine if ACTB H73 methylation regulates its genomic distribution, we performed Cleavage Under Targets and Release Using Nuclease (CUT&RUN) assays in control and SETD3 KO HCT116 colorectal cancer cells using two independent gRNAs (Fig. 1A). ACTB genomic distribution was significantly reduced across the whole genome in the SETD3 KO cells (Fig. 1B–D). Integrative Genomics Viewer (IGV) tracks of different genomic regions in SETD3 control and SETD3 KO cells are presented in Figure 1E. To exclude the possibility that the loss of ACTB is not due to compromised levels of nuclear ACTB in the SETD3-depleted cells, we have performed an immunofluorescence and a biochemical fractionation experiment in CT and two SETD3 KOs cells. As shown in Supplemental Figure S1, nuclear ACTB levels remain the same in both conditions. These results suggest that SETD3 regulates the genomic occupancy of ACTB and may modulate gene expression programs. To address this, we performed a RNA sequencing experiment in CT and SETD3 KO HCT116 cells (Supplemental Fig. S2A). Thirty-three and 69 genes were down- and upregulated, respectively. These differentially expressed genes are significantly involved in the regulation of several biological pathways (Supplemental Fig. S2B). qPCR validation for the RNA-seq of the down- and upregulated genes is shown in Supplemental Figure S2, C and D, respectively. Having demonstrated that SETD3 depletion alters global gene expression, we next investigated the specific contribution of SETD3-mediated ACTB H73 methylation to these transcriptional changes. To address this hypothesis, we performed an RNA-seq experiment with ACTB KO cells, stably expressing empty vector, FLAG-WT ACTB, or FLAG-ACTB H73A which cannot be methylated by SETD3 (Fig. 2A; Supplemental Fig. S3 for protein expression). Because histidine methylation occurs only as a single-methyl modification (unlike lysine, which can exist in mono-, di-, or trimethyl states), our assays comparing WT and H73A ACTB represent a binary system—methylated versus unmethylated—rather than a tunable spectrum of methylation levels. Bioinformatics analysis of differentially expressed genes revealed four main clusters presenting differences between ACTB WT and H73A (Fig. 2A). Relative to ACTB WT, target genes that were upregulated in the cells expressing the ACTB mutant are represented by Clusters 2 and 4. Conversely, target genes that were downregulated in the ACTB mutant compared to WT are represented by Clusters 1 and 3. qPCR validation for the down- and the upregulated genes in the ACTB mutant condition is shown in Figure 2, B and C, respectively. Gene Ontology (GO) pathway enrichment analysis of differentially expressed down- and upregulated genes revealed multiple significantly enriched biological processes (Fig. 2D,E). Supplemental Table S1 provides the complete GO enrichment results. Among these, adhesion-related pathways—including cell junction maintenance, focal adhesion assembly, and cell-matrix adhesion—were strongly represented in the downregulated genes (Fig 2D). Translation-related categories such as cytoplasmic translation and general translation were among the top significant pathways enriched in the upregulated genes (Fig. 2E). Based on their significance and biological relevance, we focused our downstream validation efforts on adhesion and mRNA translation, while acknowledging that additional phenotypes may also be affected by ACTB H73 methylation.
SETD3-dependent ACTB genomic distribution. (A) Protein expression levels of SETD3 and ACTB (loading control) were measured in HCT116 cells by western blot (WB). (B) Heat maps showing CUT&RUN read densities for IgG (NC) and Flag-ACTB in SETD3 control and HCT116 KO cells expressing Flag-ACTB. (C) Read density profiles ±3 kb around the center in the genome for Flag ACTB WT. Plots are shown for IgG, Control, and two SETD3 KOs (KO1 and KO2) HCT116 cells. (D) Genome-wide distribution of Flag-ACTB peaks across annotated genomic features. Peaks were assigned to promoters (≤1 kb, 1–2 kb, and 2–3 kb from TSS), UTRs, exons, introns, downstream regions, and distal intergenic sites. (E) Representative IGV snapshots showing binding profiles of six genomic regions. Black tracks represent IgG control, whereas red and orange tracks represent Flag-ACTB in SETD3 control cells and SETD3 KO1/KO2 cells, respectively.
Methylated ACTB at H73 regulates gene transcription. (A) Heat map showing up- and downregulated genes from RNA sequencing analysis of control and HCT116 ACTB KO cells expressing empty vector (CT), ACTB WT (ACTB WT), or ACTB H73A mutant (ACTB Mut). The numbers on the left indicate the number of genes which are down- (green) and up- (red) regulated under KO/perturbation conditions. Three biological replicas were tested for each condition. (B,C) RT-qPCR analysis of representative downregulated genes (B) and upregulated genes (C) identified in the RNA-seq data set shown in panel A. Data are presented as mean ± SEM from three independent experiments, normalized to GAPDH expression. Statistical analysis was performed using one-way ANOVA on two biological repeats. (*) P < 0.05, (**) P < 0.01, (***) P < 0.001, (****) P < 0.0001. (D,E) Selected pathways from Gene Ontology (GO) analysis of the differentially expressed downregulated (D) and upregulated (E) genes. Bars represent enrichment odds ratios, and P-values are indicated for each pathway.
Methylated ACTB regulates translation and cell adhesion
Following our RNA-seq results, we were interested in assessing the phenotypic outcome mediated by SETD3 and ACTB H73 methylation. To assess phenotypic changes in cell adhesion, linked to downregulated genes in cells expressing methylation-deficient H73A ACTB, we performed a cell-matrix adhesion assay in control and SETD3 KO cells. As shown in Figure 3A, the results demonstrate that, in the absence of SETD3, cells were significantly less attached to the surface and were more easily washed away compared to the control cells. Further, we confirmed that the loss of cell adhesion was SETD3-dependent, as re-expressing increasing amounts of FLAG-WT SETD3 rescued the adhesive properties of HCT-116 SETD3 KO cells (Fig. 3B). These results suggest that SETD3 is essential for proper cell-surface adhesion, whereby higher levels of SETD3 augment the ability of cells to adhere to a surface. To confirm that the loss of cell adhesion is not due to altered cell growth conditions, we assessed cell viability in control and SETD3 KO cells at 0 h, 24 h, and 48 h. As shown in Supplemental Figure S4, no significant differences were observed, indicating comparable viability between the groups. To further test if this phenomenon is H73 methylation-dependent, cells were transfected with WT ACTB or the methylation-deficient H73A ACTB (Fig. 3C). Our results indicate that H73A ACTB cells exhibited a reduced attachment to the surface in comparison to the WT ACTB cells, demonstrating that this phenotypic effect is methylation-dependent.
Methylated ACTB regulates translation and cell adhesion. (A) Fibronectin adhesion assay was carried out on HCT-116 Ct, SETD3 KO#1, and SETD3 KO#2. Top: Representative images of adherent cells stained with Crystal violet. Bottom: Crystal violet-stained cells were dissolved in 2% SDS, and the absorbance at 550 nm was measured. Error bars are S.D. Statistical analysis was performed on three experimental repeats. (**) P < 0.01. (B) Same as in A in HCT116 SETD3 KO cells rescued with increasing amounts of FLAG-SETD3 WT. (C) Fibronectin adhesion assay was carried out in HCT116 cells stably expressing empty, FLAG-WT ACTB, or FLAG-Mut ACTB H73A, as indicated. Top: Representative images of adherent cells stained with Crystal violet. Bottom: Crystal violet-stained cells were dissolved in 2% SDS, and the absorbance at 550 nm was measured. Error bars are S.D. Statistical analysis was performed on three experimental repeats. (**) P < 0.01. (D) Translation assay performed on HCT-116 Ct and two SETD3 KOs cells (KO1 and KO2). Cells were incubated with puromycin, and then cell extracts were submitted to western blot to detect protein synthesis using anti-puromycin antibody. (E) Same as in D in HCT-116 Ct and SETD3 KO rescued with empty, FLAG-WT, and Y313A SETD3. (F) Same as in D in ACTB KO cells, stably expressing empty, FLAG-WT ACTB, or FLAG-ACTB H73A.
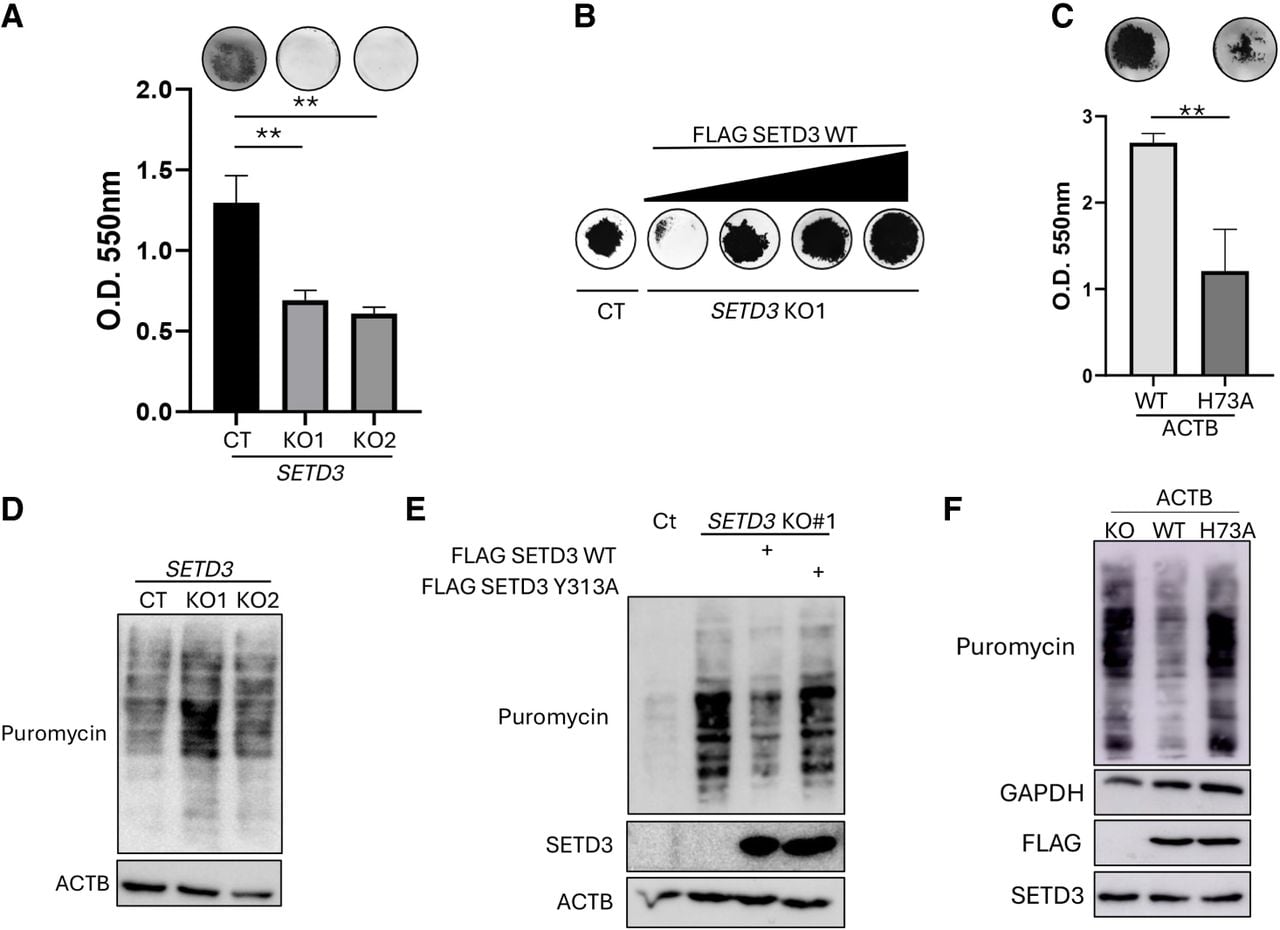
To assess phenotypic changes in mRNA translation, we first tested whether global translation varies between control and SETD3 KO cells (Fig. 3D). To this end, we conducted a puromycin incorporation assay. Puromycin is a tyrosyl-tRNA mimic that blocks translation by labeling and releasing elongated polypeptide chains from translating ribosomes (Aviner 2020). Global translation is then detected with an antibody against puromycin. An increase in mRNA translation was observed in SETD3 KO cells compared to the Ct cells (Fig. 3D). To assess dependency on SETD3 enzymatic activity, we performed this assay with SETD3 KO1 cells that were rescued with either empty vector, FLAG-WT SETD3, or FLAG-SETD3 Y313A (enzymatically dead mutant) as indicated (Fig. 3E). Whereas an elevation in mRNA translation was observed in the SETD3 KO cells or in cells expressing the catalytic inactive Y313A mutant, a less substantial increase was observed in the SETD3 WT cells, suggesting that this phenomenon is partially regulated by the catalytic activity of SETD3. To verify whether this was dependent on ACTB H73 methylation, we performed this assay using the ACTB KO cells, stably expressing either empty vector, FLAG-WT ACTB, or FLAG-ACTB H73A. As expected, ACTB KO and FLAG-Mut ACTB cells, like the SETD3 KO cells, exhibited elevated translation levels compared to Ct or FLAG-WT ACTB cells (Fig. 3F). Together, our results demonstrate that cell adhesion and mRNA translation are regulated by SETD3-dependent methylation of ACTB H73 in colorectal cancer cells.
SETD3 and ACTB interact with several large transcription complexes
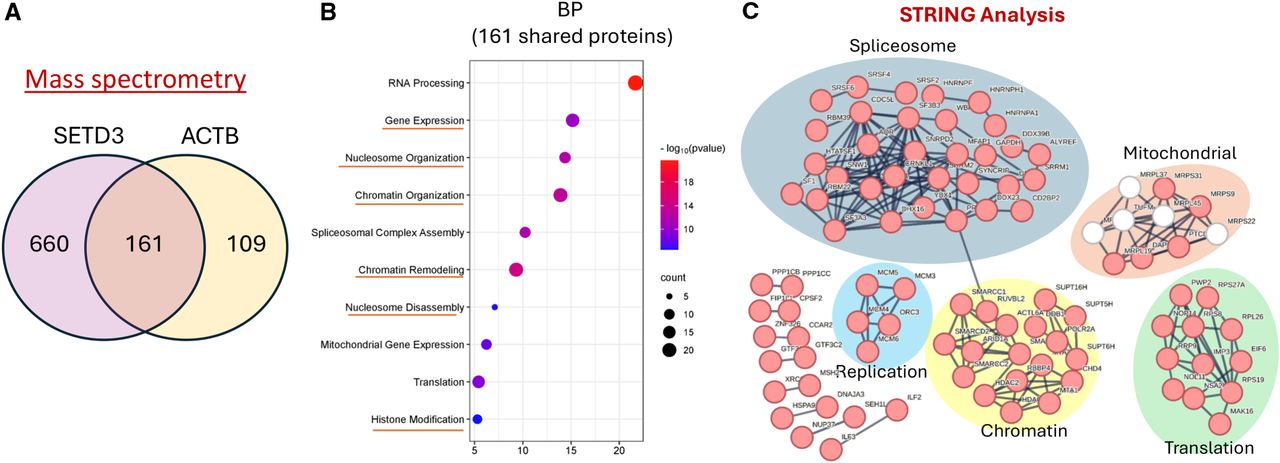
Given that SETD3-dependent methylation of ACTB H73 alters gene expression programs and the genomic distribution of ACTB, we hypothesized that this methylation may regulate ACTB nuclear interactions. To decipher the functional link between SETD3 and ACTB in the nucleus, we performed mass spectrometry to identify overlapping protein–protein interactions between these two proteins at the chromatin level. We found 660 and 109 unique interacting proteins for SETD3 and ACTB, respectively. One hundred sixty-one interacting proteins were found to overlap between both proteins (Fig. 4A). Positive hits were defined as a fold change of at least 1.2 fold over the control with a minimum of seven peptides that were identified during the analysis. A complete list of the identified proteins with peptide count is presented in Supplemental Table S2. Among these 161 interacting proteins, biological process enrichment analysis revealed enrichment for chromatin-related cellular pathways, including gene expression, nucleosome organization, and chromatin remodeling (Fig. 4B). Consistent with these findings, STRING analysis revealed enrichment of proteins associated with chromatin in addition to others cellular compartments and pathways (Fig. 4C).
SETD3 and ACTB interact with several large transcription complexes. (A) Chromatin and nuclei were purified from HCT-116 Ct cells followed by immunoprecipitation with either SETD3 or ACTB specific antibodies. Coimmunoprecipitated proteins were then identified by mass spectrometry. (B) Bubble plot showing enriched biological processes associated with the 161 shared proteins. The x-axis indicates the number of proteins per category, and the y-axis lists significantly enriched processes. Bubble size reflects the number of proteins assigned to each category, and bubble color corresponds to statistical significance (–log10 P-value), ranging from blue (less significant) to red (highly significant). Underlined enriched categories include RNA processing, gene expression, nucleosome/chromatin organization, and chromatin remodeling. (C) STRING analysis of the 161 shared proteins found in A. Nodes represent individual proteins and edges represent known or predicted interactions. Proteins are grouped into functional modules highlighted by colored ellipses. The visualization illustrates that shared proteins are enriched in interconnected modules involved in RNA metabolism, chromatin regulation, mitochondrial function, and protein synthesis.
ACTB H73 methylation is required for its cosegregation with SMARCA4
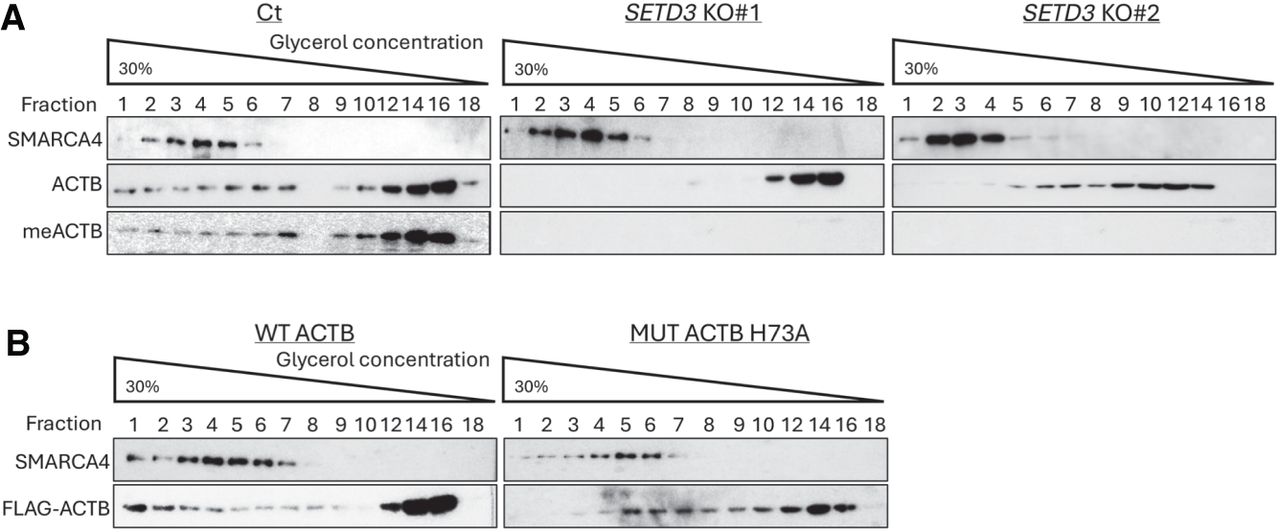
Several of the chromatin-associated proteins identified in the STRING analysis are components of chromatin remodeling complexes (Fig. 4C). Notably, ACTB is known to be involved in several of these complexes (Schick et al. 2019; Ji et al. 2022; Kunert et al. 2022). Furthermore, ACTB mediates the association of SMARCA4, a member of the BAF complex, with the chromatin (Kadoch and Crabtree 2015). We hypothesized that SETD3 and ACTB H73 methylation influences the integrity of the SMARCA4/ACTB complex. To test this hypothesis, we performed density sedimentation analysis of HCT-116 nuclear extracts using 10%–30% glycerol gradients. We applied this approach, as it has been used to assess protein complex interactions under native conditions (Schick et al. 2019). Specifically, glycerol gradients have previously been used to assess the interaction of SMARCA4 with RAD21 via cosegregation (Shang et al. 2021). We first aimed to determine whether the complex remains intact in the absence of SETD3 (Fig. 5A). The experiments indicate that SMARCA4 is maintained in the same density stratification (Fractions 1–6) under both control and SETD3 knockout conditions (KO1 and KO2). Further, although ACTB distribution is widely distributed across the glycerol gradient, cosegregation with SMARCA4 fractions could only be observed from nuclear lysates from control cells and not the SETD3 KO cells. To determine if the change in localization is dependent on ACTBH73 methylation, we performed a similar experiment using ACTB knockout cells which stably express either FLAG-WT ACTB or FLAG-ACTB H73A (Fig. 5B, left and right panel, respectively). Consistent with our previous findings, SMARCA4 largely maintained the same density stratification in the presence of ACTB WT or H73A (Fractions 1–7). However, in comparison to WT ACTB, less ACTB H73A (Mut) was found to cosegregate with SMARCA4. Overall, these experiments demonstrate that ACTB H73 methylation by SETD3 is required for its cosegregation with SMARCA4 under native conditions.
ACTB H73 methylation is required for the colocalization with SMARCA4. (A) Whole-cell lysates of HCT-116 Ct, SETD3 KO#1, SETD3 KO#2; cell lines were separated on a 10%–30% glycerol gradient. The indicated fractions were then subjected to western blot assay using the indicated antibodies. (B) Same as A with HCT116 cells expressing Flag-ACTB wt (WT ACTB) or Flag-ACTB H73A (MUT ACTB H73A).
ACTB H73 methylation regulates the selective genomic distribution of SMARCA4
Given that SETD3-mediated methylation of ACTB influences its genomic distribution and interaction with SMARCA4, we hypothesized that SETD3 and ACTB H73 methylation plays a pivotal role in regulating the genomic occupancy of SMARCA4. To test this hypothesis, we performed a CUT&RUN experiment for SMARCA4 in Control and SETD3 KO cells (Fig. 6A,B). A significant decrease in SMARCA4 genomic distribution was observed in SETD3 KO cells. To exclude the possibility that the observed decrease in SMARCA4 genomic occupancy results from reduced SMARCA4 protein levels, whole-cell lysates from control and SETD3 KO cells were subjected to western blot analysis using two independent SMARCA4 antibodies. As shown in Supplemental Figure S5A, SMARCA4 protein levels remained unchanged. Likewise, to rule out differences in nuclear SMARCA4 levels, we performed immunofluorescence staining using the same antibodies in control and SETD3-depleted cells (Supplemental Fig. S5A,B). Quantification of nuclear SMARCA4 fluorescence intensity revealed comparable levels between control and SETD3 KO cells. Consistent with these results, biochemical fractionation experiments showed no changes in nuclear SMARCA4 abundance (Supplemental Fig. S5D).
Selective genomic recruitment of SMARCA4 in the presence of methylated ACTB. (A) Heat maps showing CUT&RUN read densities for IgG (NC) and SMARCA4 in SETD3 control and two HCT116 SETD3 KO cells (KO1 and KO2). (B) Read density profiles ±3 kb around the center in the genome SMARCA4. Plots are shown for IgG, Control, and two SETD3 KOs (KO1 and KO2) HCT116 cells. (C) Heat maps showing CUT&RUN reads densities comparing the co-occupancy of methylated ACTB in HCT116 cells expressing ACTB WT and SMARCA4 in control cells. Heat map was separated into three clusters. Cluster 1 contains peaks (1340) which are shared between methylated ACTB and SMARCA4. Cluster 2 represents genomic loci (26,527 peaks) bound by methylated ACTB only. Cluster 3 represents genomic loci (28,628 peaks) bound by SMARCA4 only. (D) Representative IGV genome browser tracks illustrating the occupancy of Flag–ACTB and SMARCA4 at selected loci in control cells and SETD3 KO cells based on the clusters presented in Figure 6C. (E) KEGG pathway analysis for the 1340 shared peaks identified in panel C. Dark-blue bars highlight enriched pathways linked to cell adhesion. Bars represent enrichment odds ratios, and P-values are indicated for each pathway.
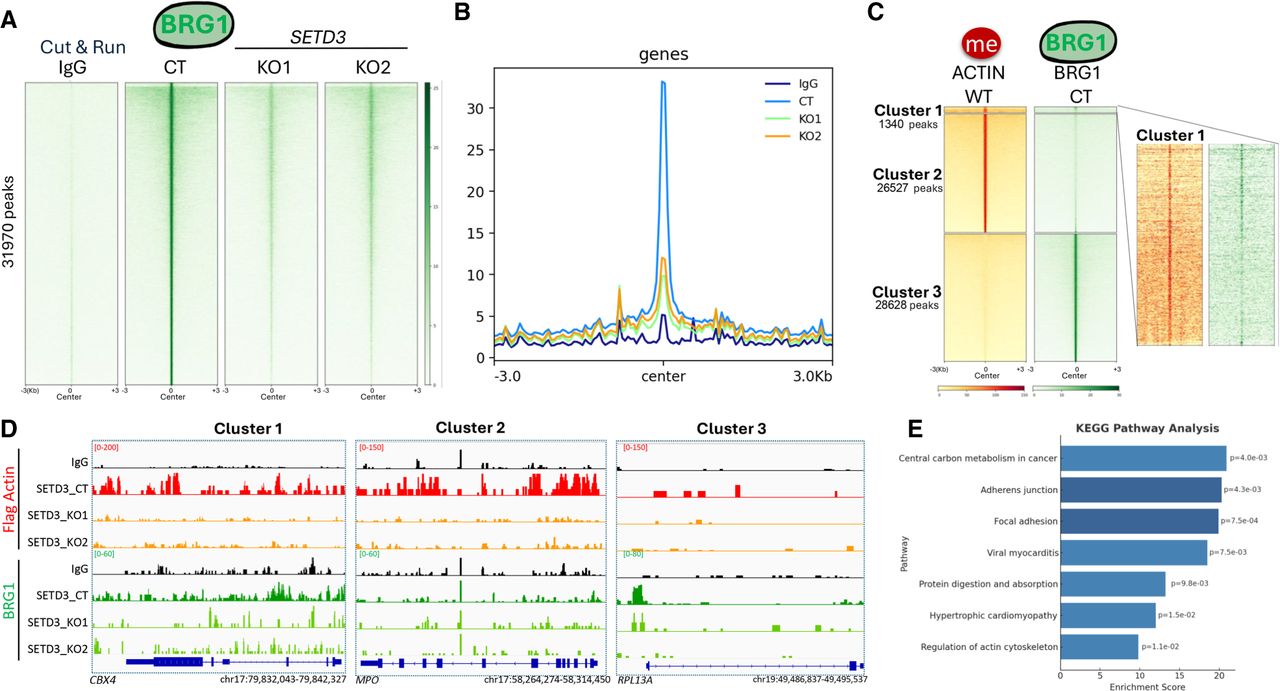
We then compared the co-occupancy of SMARCA4 and H73-methylated ACTB and stratified their genomic distributions into three clusters (Fig. 6C for heat map; Fig. 6D for IGV tracks). Cluster 1 represents 1340 genomic loci which were enriched by both SMARCA4 and H73-methylated ACTB. Cluster 2 represents 26,527 genomic loci that are exclusively bound by methylated ACTB in the control cells. In Cluster 3 there are 28,628 peaks which are enriched only by SMARCA4 in the control cells. Finally, KEGG pathways analysis was performed for the shared genes of Cluster 1 (Fig. 6E). This analysis revealed an enrichment of several biological pathways including adherens junction and focal adhesion, which were phenotypically shown to be affected by methylated ACTB in Figure 3. These results suggest that ACTB H73 methylation may regulate the genomic recruitment of SMARCA4 to specific genomic regions, thereby influencing gene expression.
Discussion
The housekeeping gene ACTB is studied mainly in the context of its cytoskeletal function. However, in recent years it has become evident that ACTB, as well as several ACTB binding proteins, also have a fundamental role in the nucleus (Hu et al. 2004; Percipalle and Visa 2006; Misu et al. 2017; Hurst et al. 2019). Specifically, it was suggested that ACTB has a role in gene expression and genome organization, through its interaction with several chromatin-associated protein complexes (Pestic-Dragovich et al. 2000; Hu et al. 2004; Percipalle and Visa 2006; Bunnell et al. 2011). Our work not only sheds new light on the role of ACTB in the regulation of transcription but also suggests a mechanistic view for its activity. Our data suggests that the methylation of ACTB at H73 by SETD3 regulates the genomic distribution of both ACTB and SMARCA4 to govern selective gene expression programs.
In a recent paper, Mahmood et al. (2021) have demonstrated that the depletion of ACTB induces changes in chromatin structure leading to alterations in the recruitment of SMARCA4, in mouse embryonic fibroblasts. Our findings correlate with these observations but provide additional mechanistic understanding. Biochemical and genomics data presented in this study suggest that the selective recruitment of SMARCA4 is mediated by ACTB H73 methylation in a SETD3-dependent manner. The fact that we can rescue these phenotypes through expression of SETD3 WT and not by the enzymatically-dead SETD3 Y313A mutant demonstrates that the enzymatic activity of SETD3 is required for colorectal cancer cells to exhibit these characteristics. It was also shown that the depletion of ACTB from mouse embryonic fibroblasts disrupts SMARCA4 chromatin binding and induces EZH2 and H3K27me3 accumulation at selected genomic loci. Additional experiments are necessary to assess whether these effects are influenced by ACTB methylation or if they occur through an independent mechanism.
Our RNA-seq data in Figure 2 are directly linked to SETD3 function, as SETD3 depletion eliminates ACTB H73 methylation (Wilkinson et al. 2019). The distinct transcriptional profiles of ACTB knockout versus the H73 mutant likely reflect the difference between complete ACTB loss, which disrupts multiple essential processes and triggers broad compensatory responses, and the selective loss of H73 methylation, which fine-tunes nuclear functions such as SMARCA4 recruitment. Thus, whereas ACTB depletion produces widespread transcriptomic changes, H73 methylation acts as a more subtle, context-dependent regulator that shapes chromatin-related processes without broadly rewiring gene expression.
To gain insights into the mechanistic aspects controlling the genomic occupancy of ACTB and how this phenomenon is regulated by SETD3, we performed a proteomic experiment to identify overlapping interacting proteins with ACTB and SETD3. Biological process GO enrichment and STRING analysis of the 161 shared interacting proteins revealed an enrichment for transcriptional regulatory factors discussed in this paper among others, such as a large cluster of proteins involved in splicing. A recent paper by Kong et al. (2024) has shown that SETD3 associates with numerous splicing-related proteins and provided evidence that SETD3 association with HNRNPK regulates global mRNA splicing. Consistent with our findings, their study also demonstrated a significant enrichment of proteins associated with cellular replication and protein synthesis. Specifically, they identified an abundance of ribosomal proteins and noted a connection to mitochondrial biogenesis. Whereas our findings suggest that SETD3 and the methylation of ACTB at H73 are linked to DNA replication, it was already shown by others that there is a functional link between SETD3 and replication through histidine methylation of H459 on MCM7 (Duan et al. 2025). The wide variety of different signaling pathways regulated by SETD3 suggests a broader substrate repertoire besides ACTB. These potential substrates may be involved in nuclear transcription regulation, whereas others likely have cytosolic functions, requiring further investigation.
Recent studies have linked the expression of SETD3 to oncogenic processes (Chen et al. 2013; Cheng et al. 2017, 2022; Zou et al. 2022). For instance, high expression of mutated SETD3 lacking the SET domain displays oncogenic properties in lymphoma (Chen et al. 2013). In contrast, in liver cancer, the upregulation of wild-type SETD3 is associated with cancer development (Cheng et al. 2017). Moreover, elevated SETD3 was shown to promote hepatocellular carcinoma (HCC) by enhancing polo-like kinase 1 (PLK1) expression (Cheng et al. 2022), suggesting a pro-tumorigenic role of SETD3. However, SETD3 was also suggested to be a biomarker for renal cancer diagnosis, where low expression levels were associated with significantly shorter disease-free survival (Pires-Luís et al. 2015). Because SETD3 also regulates the expression of multiple breast cancer-associated genes, such as ACTB, FBXW7, Fascin, NOS3 (also known as eNOS), and MMP2, it was suggested as a biomarker for breast cancer prognosis as well (Hassan et al. 2020). These findings provide compelling support for the regulatory role of SETD3 in the expression of diverse gene sets implicated in numerous signaling pathways. What determines SETD3 oncogenic versus its tumor suppressor cellular activity remains an open question and requires further examination. We propose that SETD3's involvement in selective transcription activation, mediated by the methylation of ACTB H73, may help elucidate its contrasting biological functions in various types of cancer and potentially in other biological and physiological contexts. The observation that SETD3 can modulate gene expression programs through nuclear ACTB provides a potential framework for understanding how the same enzyme might promote or suppress tumor progression depending on the cellular environment, genetic background, or signaling context. We propose that the net outcome of SETD3 activity may be shaped by the interplay between cytoplasmic ACTB functions (affecting migration, invasion, and morphology) and nuclear roles (affecting chromatin remodeling and transcription), which may dominate differently across tissue types and disease states.
Our findings reveal that SETD3 depletion leads to a global reduction in SMARCA4 occupancy across the genome. This effect cannot be attributed to compromised cellular integrity, as both cell viability and nuclear SMARCA4 protein levels remain unchanged (Supplemental Figs. S3, S4). Instead, these results may point to a broader role of SETD3 in stabilizing SMARCA4–chromatin interactions. Whereas only a subset of SMARCA4 sites are co-occupied with ACTB, the loss of SETD3-dependent ACTB methylation may weaken the overall capacity of SMARCA4-containing BAF complexes to associate with chromatin. Consistent with this model, our updated analysis highlights more than 1300 shared genomic peaks between Flag–ACTB and SMARCA4, supporting a functional connection between ACTB methylation and SMARCA4 recruitment. Thus, SETD3 appears to regulate chromatin accessibility and gene expression not only through localized ACTB-dependent mechanisms but also by broadly influencing SMARCA4 genomic occupancy.
A question raised by our findings is how SETD3 expression itself is regulated in colorectal cancer cells. To gain preliminary insight into potential upstream regulatory mechanisms, we performed an in silico transcription factor binding site prediction analysis of the SETD3 promoter using the JASPAR database. This analysis identified several candidate transcription factors such as E2F1, SP1 and ELF5 with predicted binding motifs in the SETD3 regulatory region, suggesting that SETD3 expression may be controlled by multiple signaling pathways and transcriptional programs. Although experimental validation of these upstream regulators is beyond the scope of the current study, these predictions provide a framework for future investigations aimed at understanding how SETD3 expression is dynamically regulated in response to cellular and environmental cues. Such regulation may represent an additional layer of control over ACTB methylation and SMARCA4-dependent transcriptional programs in cancer.
Although our study was performed in colorectal cancer cell models, several lines of evidence suggest that SETD3 and ACTB H73 methylation may be clinically relevant. SETD3 expression has been reported to be altered across multiple cancer types, including colorectal cancer, and may correlate with disease progression or patient outcomes (Abaev-Schneiderman et al. 2019; Hassan et al. 2020; Zou et al. 2022). Given that our results establish a mechanistic link between SETD3-mediated ACTB methylation and SMARCA4-dependent chromatin regulation, it is plausible that SETD3 expression levels or ACTB methylation status could influence tumor growth, invasiveness, or therapy responsiveness in colorectal cancer. Although we did not address these clinical aspects directly in the present work, we propose that future studies systematically analyze SETD3 expression and ACTB H73 methylation in patient samples, in relation to clinical parameters such as stage, prognosis, and treatment response. Such studies would provide valuable insights into whether the chromatin regulatory role of SETD3 uncovered here has translational implications in cancer.
Methods
Cell lines and transfection
Human colon carcinoma cells, HCT-116 (purchased from ATCC), were maintained in Dulbecco's Modified Eagle Medium (Sigma-Aldrich, #D5671) with 10% fetal bovine serum (Gibco), 2 mg/mL L-glutamine (Sigma-Aldrich, #G7513), 1% penicillin-streptomycin (Sigma-Aldrich, #P0781) and nonessential amino acids (Sigma-Aldrich, #M7145), and they were cultured at 37°C in a humidified incubator with 5% CO2. Cells were maintained on an average of 15–20 passages before new aliquots were thawed. For transient transfection, we used Poly (ethyleneimine) (PEI) solution, with the medium described above, or with Mirus LT1, according to the manufacturer's protocol.
Plasmids
Plasmids used for overexpression in cells were: pcDNA-FLAG-SETD3, pcDNA-FLAG-SETD3 Y313A, and pcDNA-Empty. pGEX-6P-1 ACTB and H73A mutant (kindly provided by Or Gozani's lab) were subcloned into the pcDNA vector to generate pcDNA-FLAG-ACTB WT and pcDNA-FLAG-ACTB H73A.
For CRISPR-Cas9 mediated gene disruption, two different guide RNAs (gRNAs) of SETD3 exons were subcloned into the lentiCRISPR plasmid (Addgene, #49535). gRNA sequences that were used to target SETD3 are: #1- CGAGTAAAAACTCAGAAATC, #2- CACCGGTATGTGCAGATCCGGACTC. gRNA sequence that was used to target ACTB is CACCACTCTCAGGCATGGAGTCCTG. Following transfection and puromycin selection, single clones were isolated, expanded, and validated by sequencing.
Genomic DNA extraction
For the KO genomic DNA validation, the QuickExtract DNA Extraction Solution 1.0 kit was used. Briefly, cells were harvested, extraction solution was added, and tubes were vortexed for 15 sec, then, incubated for 6 min at 65°C, vortexed again, and incubated for 2 min at 98°C. Five microliters were taken for PCR. We used the following primers: KO#1 (gRNA #1) Fw 5′-TTAGGCGCGCCAAGAGTTTTGGGGGGATAGTTT-3′, Rev 5′-GCCTTAATTAAAAAATTGTATCATTTTAGCACCC-3′, and KO#2 (gRNA #2) Fw 5′-TTAGGCGCGCCTTAAGGCAAAGTGGGGAGAGAATA-3′, Rev 5′-GCCTTAATTAAGGAAGCTCACAATTACTTCACCC-3′.
Western blotting and antibodies
Primary antibodies used were as follows: SETD3 (Abcam, #ab176582), ACTB (Abcam, #ab3280), SMARCA4-mouse (Santa Cruz, #sc-17796), SMARCA4-Rabbit (Epicypher, #132002), FLAG (Sigma-Aldrich, #F1804), GAPDH (ABM, #G041), SETD6 (Genetex, #GTX629891), Lamin B1 (#12987-1-AP), and puromycin (DSHB, #PMY-2A4). Secondary HRP-conjugated antibodies (goat antimouse and goat antirabbit) were from Jackson ImmunoResearch (#115-035-062 and #111-035-144, respectively). Antibodies were diluted in TBST with 5% BSA or in PBST with 10% skim milk, according to the manufacturer's recommendations. The immobilized HRP-antibodies were detected by ECL (Biological Industries). Fluorescently labeled secondary antibodies used were: Alexa 647 and 549 antimouse (Invitrogen, #A-21443).
For western blot analysis, cells were lysed in RIPA buffer (50 mM Tris-HCl [pH 8], 150 mM NaCl, 1% Nonidet P-40, 0.5% sodium deoxycholate, 0.1% SDS, 1 mM DTT, and 1:100 protease inhibitor mixture (Sigma-Aldrich). Samples were resolved on 8%–12% SDS- PAGE, followed by western blot analysis.
Biochemical fractionation
Biochemical fractionation was performed using a Thermo Fisher Scientific subcellular protein fractionation kit for cultured cells (#78840). Cells were first lysed using cytoplasmic extraction buffer (CEB) for 10 min on ice for the collection of the cytoplasmic extraction. Next, the pellet was supplemented using membrane extraction buffer (MEB) for 10 min on ice for membrane extract. Finally, nuclear extraction buffer (NEB) was added for 30 min incubation on ice with gentle mixing for the extraction of the nuclear fraction.
RNA-seq library preparation
Total RNA was extracted from three biological replicas of HCT-116 cells (ACTB KO, stably expressing empty vector, FALG-WT, or H73A ACTB) and three biological replicas of Control and two HCT116 SETD3 KO cells derived from two independent SETD3 gRNAs, using the NucleoSpin RNA kit (Macherey-Nagel). Samples were prepared in three biological replicates for each condition. Libraries were prepared using the INCPM-mRNA-seq protocol. Briefly, the poly(A) fraction (mRNA) was purified from 500 ng of total input RNA followed by fragmentation and the generation of double-stranded cDNA. Afterward, an Agencourt Ampure XP beads cleanup (Beckman Coulter), end repair, A base addition, adapter ligation, and PCR amplification steps were performed. Libraries were quantified by Qubit (Thermo Fisher Scientific) and TapeStation (Agilent). Sequencing was done on a HiSeq instrument (Illumina) using two lanes of an SR60_V4 kit, allocating 20 m reads per sample (single-read sequencing).
RNA-seq data analysis
The analysis of the raw sequence reads was carried out using the NeatSeq-Flow platform (https://doi.org/10.1101/173005). The sequences were quality-trimmed and filtered using Trim Galore! (version 0.4.5, https://github.com/felixkrueger/trimgalore) (quality cutoff = 25, length cutoff = 25) and cutadapt (version 1.15) (https://doi.org/10.14806/ej.17.1.200). Alignment of the reads to the human genome (GRCh38) was done with RSEM (version 1.2.28) (Li and Dewey 2011) (option “bowtie2”), and calculation of number of reads per gene per sample was also done with RSEM. Quality assessment of the process was carried out using FASTQC (version 0.11.8) and MultiQC (version 1.0.dev0) (Ewels et al. 2016). Genes with low expression values (mean count < 1 over all samples) were excluded from differential expression analysis.
Read counts for differential gene expression were analyzed with the DESeq2 R package (Love et al. 2014) using the NeatSeq-Flow platform DESeq2 module. For the two CRISPR-treated KO samples versus the two control samples, genes with fold change ≥1 and adjusted P < .05 for the HCT-116 cells stably expressing empty vector, FLAG-WT, or H73A ACTB (Fig. 2) and P < .01 for the Ct and two HCT116 SETD3 KO cells (Supplemental Fig. S2) were considered as significantly differentially expressed genes. Significant genes were clustered using the “eclust” function from the factorextra R package (R Core Team 2023) with the default restriction of maximum clusters. Enrichment for Gene Ontology biological processes and KEGG pathways was performed using clusterProfiler v4.0 R package (Wu et al. 2021).
qPCR analysis
Two hundred nanograms of the extracted RNA were reverse-transcribed to cDNA using the iScript cDNA Synthesis kit (Bio-Rad) according to the manufacturer's instructions. Real-time qPCR was performed using the SYBR Green I master (Roche) in a LightCycler 480 System (Roche). The real-time qPCR primers were designed using the PrimerQuest tool of the Syntezza-Israel IDT portal and UCSC Genome Bioinformatics (Supplemental Table S1). All samples were amplified in triplicate in a 384-well plate using the following cycling conditions: 10 min at 95°C, 45 cycles of 10 sec at 95°C, 30 sec at 60°C and 1 sec at 72°C, followed by 30 sec at 40°C. Gene expression levels were normalized relative to GAPDH gene and controls of the experiment. The primers used for the qPCR validation experiments are provided in the Supplemental Table S3.
Cleavage under targets and release using nuclease
CUT&RUN was performed using the CUTANA Assay kit (EpiCypher) according to the manufacturer's instructions. An input of 1 × 10⁶ cells per sample was processed according to the manufacturer's protocol. More specifically, with the use of nuclear extraction buffer, the CUT&RUN assay was performed directly on nuclei. Digitonin was used at a final concentration of 0.01% for nuclear permeabilization. Control antibodies (0.5 µg, IgG and H3K4me3) were used as recommended, and 1 µg anti-SMARCA4 (EpiCypher, #13-2002) and anti-Flag (EpiCypher, #13-2031) antibodies were used per sample. Libraries were quantified with the Qubit dsDNA HS Assay kit, and DNA fragment sizes were assessed using an Agilent TapeStation. Resulting libraries were sequenced with 50- to 150-bp paired-end reads, with 15 m reads per sample using a NextSeq 2000 system from Illumina through the Center for Advance Genomics, IKI, BGU.
CUT&RUN data analysis
The analysis was carried out using the NeatSeq-Flow platform (https://doi.org/10.1101/173005). Raw sequencing data in FASTQ format was trimmed by Trim Galore! (version 0.4.5) (length = 25, q- 25); reads that were too short were discarded. FastQC v0.12.0 was used for reads quality control. BWA Mapper (version 0.7.12, default parameters t = 20, B = 5) (Li and Durbin 2009) was used to align paired-end reads to reference human genome assembly GRCh38 (hg38) and to the spike-in control (Escherichia coli) reference genome assembly. SAMtools (Danecek et al. 2021) was used to remove PCR duplicates and create coordinate-sorted BAM files. Normalization between samples and IgG was performed with a custom script that calculates read scaling factor based on spike-in DNA reads of each sample (Supplemental Code). The scaling factor was then used in bamCoverage v3.5.6 by deepTools (Ramírez et al. 2016) to normalize each sample according to its spike-in, bigWig files were created by bamCoverage, and reads mapped to blacklisted areas designated by ENCODE (Amemiya et al. 2019) were filtered. Reads that refer to off-Chromosome locations were removed with BedClip v377 and sorted by BEDTools v2.30.0 (Quinlan and Hall 2010). bigWig files were then created with bedGraphTobigWig by deepTools (Ramírez et al. 2016). Peaks were called by SEACR v1.3 (using the top 1 percentile as the high-confidence peak calibration in “stringent” mode) (Meers et al. 2019). Peaks within 100 bp were then merged and sorted with BEDTools. Peaks from each two replicates (Flag-ACTB and SMARCA4) were then intersected by BEDTools (version 2.31.0) (Quinlan and Hall 2010), resulting in a peak list that included only peaks that exist in both replicates. Peaks were viewed in IGV (version 2.16.1) (Robinson et al. 2011) and annotated with ChIPseeker (Yu et al. 2015; Wang et al. 2022). Matrices were generated with deepTools createMatrix, and heat maps were plotted with deepTools plotHeatmap (Ramírez et al. 2016).
Sample preparation for mass spectrometry and data analysis
Endogenous SETD3 and ACTB were immunoprecipitated from HCT-116 cells after lysis using the MBT Small scale Nuclear Protein Extraction (Moore et al. 2013). Briefly, cells were harvested and washed with PBS × 1, the pellet was suspended in lysis buffer (10 mM HEPES 7.9, 1.5 mM MgCl2 10 mM KCl) including DTT (1:1000) and protein inhibitor (PI) (1:100), and incubated for 15 min. The cell pellet was then suspended again in lysis buffer and disrupted by a narrow-gauge syringe (1 mL) eight times. Cells were centrifuged for 5 min at 11,000g. Supernatant was removed (cytoplasmic fraction). The nuclei pellet was suspended in the extraction buffer (420 mM KCl) containing DTT and PI as mentioned above. After 30 min of rotation, tubes were centrifuged for 5 min at 21,000g. Supernatant was then conveyed to IP with SETD3- or ACTB-specific antibodies preconjugated with glyceraldehyde to magnetic beads. Following overnight IP, proteins were eluted by 2% SDS. Supernatants were subjected to mass spectrometry analysis (Weizmann Institute of Science). Data was analyzed using Byonic search engine (Protein Metrics) against the Human protein database (SwissProt Dec20) allowing for the following modifications: fixed carbamidomethylation on C, variable protein N-terminal acetylation, oxidation on M, and deamidation on NQ. Protein FDR was set to 1%.
Glycerol gradient
Glycerol gradients (10%–30%) were established by pipetting 2 mL of each of the glycerol fractions (10%, 15%, 20%, 25%, and 30% v/v) in buffer A (20 mM HEPES [pH 7.9], 0.3 m KCl, 0.2 mM EDTA, 0.1% NP-40) into centrifugation tubes (Beckman). Gradients were formed by standing for 6 h at 4°C. HCT-116 cells (Ct, SETD3 KO, ACTB WT, or H73A) were lysed in 0.5 mL of buffer A containing 0.1% protease inhibitor and either 0.5% RNase inhibitor or RNase A (100 mg/mL final concentration) for 30 min at 4°C. The lysates were centrifuged at 10,000g for 10 min, and the supernatants were loaded into tubes with the preformed glycerol gradients. Protein complexes were then fractionated by centrifugation in a SW 41Ti rotor (Beckman) at 38,000 rpm for 21 h. Twenty fractions (0.5 mL) were collected and analyzed by immunoblotting with the indicated antibodies.
Fibronectin adhesion assay
For the cell adhesion assay to fibronectin, cells were serum-starved (no FBS) overnight. Then, the cells were harvested, and 1 × 10⁵ cells/well were plated on a fibronectin (Millipore, #341631) precoated 96-well plate (2.5 µg/well); BSA was used as a negative control (5% in PBS) for 4 h at room temperature, followed by a PBS wash and Crystal violet staining (0.5% Crystal violet in 20% methanol). Crystal violet staining was solubilized in 2% SDS and quantified at 550 nm using the Tecan Infinite M200 plate reader.
Translation assay
For the translation assay performed using the SUnSET method (Schmidt et al. 2009), cells were treated with puromycin (10 µg/mL) for 10 min. Cells were then lysed in RIPA buffer and submitted to western blot to detect protein synthesis using antipuromycin antibody.
PrestoBlue viability assay
For viability counts, cells were plated at 5000 cells/well in a 48-well plate. The cells were left for adherence overnight, then media was removed from cells and new media containing 10% PrestoBlue (Invitrogen) was introduced to the cells for 20 min at 37°C. The number of viable cells was measured using a Tecan Infinite M200 plate reader by measuring absorbance at 560 and 590 nm. This step was considered as T(0) of the experiment, and similar measurements were performed every 24 h. Each measurement was normalized to the count at T(0). Statistical analysis was performed using the two-way ANOVA, followed by the Tukey's multiple comparisons test.
Immunofluorescence and image analysis
For immunofluorescence (IF), fluorescently labeled secondary antibodies were used: Alexa Fluor 488 antimouse (Invitrogen, #R37120), Alexa Fluor 647 antirabbit (Invitrogen, #A21441), and Alexa Fluor 647 antimouse (Invitrogen, #A21463). Cells were fixed with 4% PFA, permeabilized with 0.5% Triton X-100, and blocked with 10% fetal bovine serum for 30 min, after which cells were stained for 3 h with the relevant primary antibody (described above) followed by 30 min incubation with fluorescent secondary antibody and DAPI. Images were acquired with a 3i Marianas spinning disk confocal microscope using a 63× Zeiss Plan-Apochromat oil, 1.4 NA objectives. For the automated analysis of nuclear geometry and overlapping intensities in batch mode, we implemented a custom ImageJ (Fiji) macro (Schindelin et al. 2012). For each image stack, a maximum intensity projection (MIP) was generated. In the resulting 2D images, nuclei were segmented using Cellpose (Stringer et al. 2021). Owing to the high quality of the nuclear signal, segmentation could be performed directly with the pretrained models without additional training. The segmentation masks were imported into Fiji's ROI Manager after conversion to ImageJ ROIs via the PTBIOP plugin. For each ROI (nucleus), shape and geometry parameters were quantified. In addition, overlapping intensity measurements (total, mean, and standard deviation) were extracted for all available channels. Results were compiled in a summary table, and the script also generated reference images of the segmented nuclei to facilitate quality control.
Data access
All raw and processed sequencing data generated in this study have been submitted to the NCBI Gene Expression Omnibus (GEO; https://www.ncbi.nlm.nih.gov/geo/) under accession numbers GSE308375 (CUT&RUN) and GSE308376 (RNA-seq).
Competing interest statement
The authors declare no competing interests.
Acknowledgments
We thank the Levy lab for technical assistance and for critical reading of the manuscript, and Or Gozani for methylated ACTB antibody, pGEX-6P-1 ACTB and ACTB H73A. This work was supported by grants to D.L. from The Israel Science Foundation (262/18 and 496/23), The Israeli Cancer Research Foundation Israel (ICRF), and the Israel Cancer Association.
Author contributions: E.A-S., M.F., C.V.R., and D.L. designed the experiments. E.A-S. performed most of the experiments. N.T.M. and L.L. carried out the bioinformatics analysis. L.N. performed some of the translation assays experiments. R.S., A.C., and G.J. conducted the cell fractionation and viability assays. T.E.B. performed the qPCR validation experiments, and D.S. carried out the microscopic analyses. E.A-S. and D.L. wrote the manuscript. All authors read and approved the final version of the manuscript.
Notes
[1] Supplementary material [Supplemental material is available for this article.]
[2] Article published online before print. Article, supplemental material, and publication date are at https://www.genome.org/cgi/doi/10.1101/gr.280534.125.
References
- ↵Abaev-Schneiderman E, Admoni-Elisha L, Levy D. 2019. SETD3 is a positive regulator of DNA-damage-induced apoptosis. Cell Death Dis 10: 74. 10.1038/s41419-019-1328-4
- ↵Admoni-Elisha L, Abaev-Schneiderman E, Cohn O, Shapira G, Shomron N, Feldman M, Levy D. 2022. Structure-function conservation between the methyltransferases SETD3 and SETD6. Biochimie 200: 27–35. 10.1016/j.biochi.2022.05.003
- ↵Amemiya HM, Kundaje A, Boyle AP. 2019. The ENCODE blacklist: identification of problematic regions of the genome. Sci Rep 9: 9354. 10.1038/s41598-019-45839-z
- ↵Aviner R. 2020. The science of puromycin: from studies of ribosome function to applications in biotechnology. Comput Struct Biotechnol J 18: 1074–1083. 10.1016/j.csbj.2020.04.014
- ↵Bunnell TM, Burbach BJ, Shimizu Y, Ervasti JM. 2011. β-Actin specifically controls cell growth, migration, and the G-actin pool. Mol Biol Cell 22: 4047–4058. 10.1091/mbc.e11-06-0582
- ↵Chen Z, Yan CT, Dou Y, Viboolsittiseri SS, Wang JH. 2013. The role of a newly identified SET domain-containing protein, SETD3, in oncogenesis. Haematologica 98: 739–743. 10.3324/haematol.2012.066977
- ↵Chen A, Arora PD, McCulloch CA, Wilde A. 2017. Cytokinesis requires localized β-actin filament production by an actin isoform specific nucleator. Nat Commun 8: 1530. 10.1038/s41467-017-01231-x
- ↵Cheng X, Hao Y, Shu W, Zhao M, Zhao C, Wu Y, Peng X, Yao P, Xiao D, Qing G, 2017. Cell cycle-dependent degradation of the methyltransferase SETD3 attenuates cell proliferation and liver tumorigenesis. J Biol Chem 292: 9022–9033. 10.1074/jbc.M117.778001
- ↵Cheng M, Yang Q, Liu Y, Zhao MJ, Du X, Sun J, Shu WJ, Huang Z, Bi J, Xu X, 2022. SETD3 methyltransferase regulates PLK1 expression to promote in situ hepatic carcinogenesis. Front Oncol 12: 882202. 10.3389/fonc.2022.882202
- ↵Cohn O, Feldman M, Weil L, Kublanovsky M, Levy D. 2016. Chromatin associated SETD3 negatively regulates VEGF expression. Sci Rep 6: 37115. 10.1038/srep37115
- ↵Cooper SE, Hodimont E, Green CM. 2015. A fluorescent bimolecular complementation screen reveals MAF1, RNF7 and SETD3 as PCNA-associated proteins in human cells. Cell Cycle 14: 2509–2519. 10.1080/15384101.2015.1053667
- ↵Dai S, Horton JR, Woodcock CB, Wilkinson AW, Zhang X, Gozani O, Cheng X. 2019. Structural basis for the target specificity of actin histidine methyltransferase SETD3. Nat Commun 10: 3541. 10.1038/s41467-019-11554-6
- ↵Danecek P, Bonfield JK, Liddle J, Marshall J, Ohan V, Pollard MO, Whitwham A, Keane T, McCarthy SA, Davies RM, 2021. Twelve years of SAMtools and BCFtools. GigaScience 10: giab008. 10.1093/gigascience/giab008
- ↵Duan H, Wang S, Shu WJ, Tong Y, Long HZ, Li G, Du HN, Zhao MJ. 2025. SETD3-mediated histidine methylation of MCM7 regulates DNA replication by facilitating chromatin loading of MCM. Sci China Life Sci 68: 793–808. 10.1007/s11427-023-2600-0
- ↵Ewels P, Magnusson M, Lundin S, Käller M. 2016. MultiQC: summarize analysis results for multiple tools and samples in a single report. Bioinformatics 32: 3047–3048. 10.1093/bioinformatics/btw354
- ↵Falahzadeh K, Banaei-Esfahani A, Shahhoseini M. 2015. The potential roles of actin in the nucleus. Cell J 17: 7–14. 10.22074/cellj.2015.507
- ↵Gao R, Yang H, Wang Y. 2024. SETD3 functions beyond histidine methylation. Life Sci 357: 123064. 10.1016/j.lfs.2024.123064
- ↵Gibieza P, Petrikaite V. 2021. The regulation of actin dynamics during cell division and malignancy. Am J Cancer Res 11: 4050–4069.
- ↵Guo Q, Liao S, Kwiatkowski S, Tomaka W, Yu H, Wu G, Tu X, Min J, Drozak J, Xu C. 2019. Structural insights into SETD3-mediated histidine methylation on β-actin. eLife 8: e43676. 10.7554/eLife.43676
- ↵Hassan N, Rutsch N, Győrffy B, Espinoza-Sánchez NA, Götte M. 2020. SETD3 acts as a prognostic marker in breast cancer patients and modulates the viability and invasion of breast cancer cells. Sci Rep 10: 2262. 10.1038/s41598-020-59057-5
- ↵Hintzen JCJ, Moesgaard L, Kwiatkowski S, Drozak J, Kongsted J, Mecinović J. 2021. β-actin peptide-based inhibitors of histidine methyltransferase SETD3. ChemMedChem 16: 2695–2702. 10.1002/cmdc.202100296
- ↵Hu P, Wu S, Hernandez N. 2004. A role for β-actin in RNA polymerase III transcription. Genes Dev 18: 3010–3015. 10.1101/gad.1250804
- ↵Hurst V, Shimada K, Gasser SM. 2019. Nuclear actin and actin-binding proteins in DNA repair. Trends Cell Biol 29: 462–476. 10.1016/j.tcb.2019.02.010
- ↵Hynes RO. 1992. Integrins: versatility, modulation, and signaling in cell adhesion. Cell 69: 11–25. 10.1016/0092-8674(92)90115-S
- ↵Ji L, Zhao L, Xu K, Gao H, Zhou Y, Kornberg RD, Zhang H. 2022. Structure of the NuA4 histone acetyltransferase complex. Proc Natl Acad Sci 119: e2214313119. 10.1073/pnas.2214313119
- ↵Jiang X, Li T, Sun J, Liu J, Wu H. 2018. SETD3 negatively regulates VEGF expression during hypoxic pulmonary hypertension in rats. Hypertens Res 41: 691–698. 10.1038/s41440-018-0068-7
- ↵Kadoch C, Crabtree GR. 2015. Mammalian SWI/SNF chromatin remodeling complexes and cancer: mechanistic insights gained from human genomics. Sci Adv 1: e1500447. 10.1126/sciadv.1500447
- ↵Kong YY, Shu WJ, Wang S, Yin ZH, Duan H, Li K, Du HN. 2024. The methyltransferase SETD3 regulates mRNA alternative splicing through interacting with hnRNPK. Cell Insight 3: 100198. 10.1016/j.cellin.2024.100198
- ↵Kunert F, Metzner FJ, Jung J, Höpfler M, Woike S, Schall K, Kostrewa D, Moldt M, Chen JX, Bantele S, 2022. Structural mechanism of extranucleosomal DNA readout by the INO80 complex. Sci Adv 8: eadd3189. 10.1126/sciadv.add3189
- ↵Kwiatkowski S, Seliga AK, Vertommen D, Terreri M, Ishikawa T, Grabowska I, Tiebe M, Teleman AA, Jagielski AK, Veiga-da-Cunha M, 2018. SETD3 protein is the actin-specific histidine N-methyltransferase. eLife 7: e37921. 10.7554/eLife.37921
- ↵Li H, Durbin R. 2009. Fast and accurate short read alignment with Burrows–Wheeler transform. Bioinformatics 25: 1754–1760. 10.1093/bioinformatics/btp324
- ↵Li B, Dewey CN. 2011. RSEM: accurate transcript quantification from RNA-seq data with or without a reference genome. BMC Bioinformatics 12: 323. 10.1186/1471-2105-12-323
- ↵Love MI, Huber W, Anders S. 2014. Moderated estimation of fold change and dispersion for RNA-seq data with DESeq2. Genome Biol 15: 550. 10.1186/s13059-014-0550-8
- ↵Mahmood SR, Xie X, Hosny El Said N, Venit T, Gunsalus KC, Percipalle P. 2021. β-actin dependent chromatin remodeling mediates compartment level changes in 3D genome architecture. Nat Commun 12: 5240. 10.1038/s41467-021-25596-2
- ↵Meers MP, Tenenbaum D, Henikoff S. 2019. Peak calling by Sparse Enrichment Analysis for CUT&RUN chromatin profiling. Epigenetics Chromatin 12: 42. 10.1186/s13072-019-0287-4
- ↵Misu S, Takebayashi M, Miyamoto K. 2017. Nuclear actin in development and transcriptional reprogramming. Front Genet 8: 27. 10.3389/fgene.2017.00027
- ↵Moore KE, Carlson SM, Camp ND, Cheung P, James RG, Chua KF, Wolf-Yadlin A, Gozani O. 2013. A general molecular affinity strategy for global detection and proteomic analysis of lysine methylation. Mol Cell 50: 444–456. 10.1016/j.molcel.2013.03.005
- ↵Percipalle P, Visa N. 2006. Molecular functions of nuclear actin in transcription. J Cell Biol 172: 967–971. 10.1083/jcb.200512083
- ↵Pestic-Dragovich L, Stojiljkovic L, Philimonenko AA, Nowak G, Ke Y, Settlage RE, Shabanowitz J, Hunt DF, Hozak P, de Lanerolle P. 2000. A myosin I isoform in the nucleus. Science 290: 337–341. 10.1126/science.290.5490.337
- ↵Pires-Luís AS, Vieira-Coimbra M, Vieira FQ, Costa-Pinheiro P, Silva-Santos R, Dias PC, Antunes L, Lobo F, Oliveira J, Gonçalves CS, 2015. Expression of histone methyltransferases as novel biomarkers for renal cell tumor diagnosis and prognostication. Epigenetics 10: 1033–1043. 10.1080/15592294.2015.1103578
- ↵Quinlan AR, Hall IM. 2010. BEDTools: a flexible suite of utilities for comparing genomic features. Bioinformatics 26: 841–842. 10.1093/bioinformatics/btq033
- ↵Ramírez F, Ryan DP, Grüning B, Bhardwaj V, Kilpert F, Richter AS, Heyne S, Dündar F, Manke T. 2016. deepTools2: a next generation web server for deep-sequencing data analysis. Nucleic Acids Res 44: W160–W165. 10.1093/nar/gkw257
- ↵R Core Team. 2023. R: a language and environment for statistical computing. R Foundation for Statistical Computing, Vienna. https://www.R-project.org/.
- ↵Robinson JT, Thorvaldsdóttir H, Winckler W, Guttman M, Lander ES, Getz G, Mesirov JP. 2011. Integrative genomics viewer. Nat Biotechnol 29: 24–26. 10.1038/nbt.1754
- ↵Schick S, Rendeiro AF, Runggatscher K, Ringler A, Boidol B, Hinkel M, Májek P, Vulliard L, Penz T, Parapatics K, 2019. Systematic characterization of BAF mutations provides insights into intracomplex synthetic lethalities in human cancers. Nat Genet 51: 1399–1410. 10.1038/s41588-019-0477-9
- ↵Schindelin J, Arganda-Carreras I, Frise E, Kaynig V, Longair M, Pietzsch T, Preibisch S, Rueden C, Saalfeld S, Schmid B, 2012. Fiji: an open-source platform for biological-image analysis. Nat Methods 9: 676–682. 10.1038/nmeth.2019
- ↵Schmidt EK, Clavarino G, Ceppi M, Pierre P. 2009. SUnSET, a nonradioactive method to monitor protein synthesis. Nat Methods 6: 275–277. 10.1038/nmeth.1314
- ↵Sen B, Xie Z, Thomas MD, Pattenden SG, Howard S, McGrath C, Styner M, Uzer G, Furey TS, Rubin J. 2024. Nuclear actin structure regulates chromatin accessibility. Nat Commun 15: 4095. 10.1038/s41467-024-48580-y
- ↵Shang XY, Shi Y, He DD, Wang L, Luo Q, Deng CH, Qu YL, Wang N, Han ZG. 2021. ARID1A deficiency weakens BRG1-RAD21 interaction that jeopardizes chromatin compactness and drives liver cancer cell metastasis. Cell Death Dis 12: 990. 10.1038/s41419-021-04291-6
- ↵Stringer C, Wang T, Michaelos M, Pachitariu M. 2021. Cellpose: a generalist algorithm for cellular segmentation. Nat Methods 18: 100–106. 10.1038/s41592-020-01018-x
- ↵Svitkina T. 2018. The actin cytoskeleton and actin-based motility. Cold Spring Harb Perspect Biol 10: a018267. 10.1101/cshperspect.a018267
- ↵Tiebe M, Lutz M, Levy D, Teleman AA. 2018. Phenotypic characterization of SETD3 knockout Drosophila. PLoS One 13: e0201609. 10.1371/journal.pone.0201609
- ↵Wang Q, Li M, Wu T, Zhan L, Li L, Chen M, Xie W, Xie Z, Hu E, Xu S, 2022. Exploring epigenomic datasets by ChIPseeker. Curr Protoc 2: e585. 10.1002/cpz1.585
- ↵Wilkinson AW, Diep J, Dai S, Liu S, Ooi YS, Song D, Li TM, Horton JR, Zhang X, Liu C, 2019. SETD3 is an actin histidine methyltransferase that prevents primary dystocia. Nature 565: 372–376. 10.1038/s41586-018-0821-8
- ↵Witecka A, Kwiatkowski S, Ishikawa T, Drozak J. 2021. The structure, activity, and function of the SETD3 protein histidine methyltransferase. Life 11: 1040. 10.3390/life11101040
- ↵Wu T, Hu E, Xu S, Chen M, Guo P, Dai Z, Feng T, Zhou L, Tang W, Zhan L, 2021. clusterProfiler 4.0: a universal enrichment tool for interpreting omics data. Innovation (Camb) 2: 100141. 10.1016/j.xinn.2021.100141
- ↵Yu G, Wang LG, He QY. 2015. ChIPseeker: an R/Bioconductor package for ChIP peak annotation, comparison and visualization. Bioinformatics 31: 2382–2383. 10.1093/bioinformatics/btv145
- ↵Zou T, Wang Y, Dong L, Che T, Zhao H, Yan X, Lin Z. 2022. Stabilization of SETD3 by deubiquitinase USP27 enhances cell proliferation and hepatocellular carcinoma progression. Cell Mol Life Sci 79: 70. 10.1007/s00018-021-04118-9